|
| American Resilience Model Portfolio |
| Monthly Portfolio Review: June 2025Publication date: July 2, 2025 |
| | | Current portfolio holdings |
|
| | FOR SUBSCRIBER USE ONLY. DO NOT FORWARD OR SHARE. |
| | | Strong performance from the technology sector powered U.S. stocks to new all-time highs in June. Tech stocks also contributed significantly to the performance of the American Resilience portfolio, which returned 7.4% in June, versus 5.1% for the S&P 500. Investor sentiment has undergone a dramatic shift since April. Tariff anxiety has given way to renewed appreciation for U.S. leadership following a major strategic victory in Iran that has kept oil prices low. Five positions in the portfolio generated double digit returns this month, while a handful of positions generated modest losses. Shares of Oracle (ORCL) led the way, advancing 32% in June after blowout fourth quarter earnings. While ORCL shares are up more than 50% since they were added to the portfolio just under a year ago, the improved financial performance justifies the higher price. Markets have recovered, but geopolitical stability, subdued inflation, AI growth and potentially falling interest rates create an attractive environment for investors in high quality stocks.
|
| | | The American Resilience portfolio generated a total return of 7.4% in June, outpacing the S&P 500 Index return of 5.1%. On a year to date basis through the end of June, the portfolio has returned 11.9%, versus 6.2% for the S&P 500.
There were five stocks in the portfolio that produced double digit returns this month. The best performing stocks in the portfolio in June were Oracle (ORCL), which returned 32%; GXO Logistics (GXO), which returned 18%; NVIDIA (NVDA), which returned 17%; Texas Instruments (TXN), which returned 14%; and Eaton (ETN), which returned 11%.
Notable decliners in the portfolio in June were Costco (COST), which returned -5%, and Arch Capital Group (ACGL), which returned -4%. |
| Back to All-time Highs
After a record-setting performance in May, stock market momentum continued through June. The S&P 500 and NASDAQ Composite both ended the first half of 2025 at their all-time highest levels, surpassing previous peaks reached in mid-February. |
|
| S&P 500 and NASDAQ CompositeTotal Return (12/31/24 - 6/30/25) |
| The strong performance of stocks in June is especially remarkable given the major geopolitical news of the month.
On Saturday, June 21, the United States sent a squadron of B-2 bombers into Iranian territory in an effort to eliminate, or at least severely damage, Iran’s nuclear program.
Prior to Operation Midnight Hammer, there was a great deal of hand-wringing over potential U.S. involvement in Israel’s military actions against Iran. Many observers believed it would be catastrophic, potentially even setting the stage for World War III.
Crude oil prices, which in May and April had reached their lowest levels since early 2021, began to rise sharply in June as tensions with Iran escalated.
Oil investors were primarily concerned about potential supply disruptions, which may have even included Iran taking steps to obstruct traffic through the Strait of Hormuz.
Return of the superpower
It has been less than two weeks since President Trump authorized the mission, but as we conveyed last week, the maneuver already appears to have been a military, foreign policy and even economic masterstroke.
Notwithstanding some conflicting early reporting, severe damage has clearly been done to Iran’s nuclear program.
We did see a feeble and performative counterstrike on the American military base in Qatar. The Iranians provided the U.S. with ample advance notice to ensure that the base could be evacuated and their handful of missiles would be shot down.
Shortly thereafter, Iran agreed to a ceasefire with Israel and to pursue a diplomatic course of action with the United States. The regime will survive but will not be permitted to advance its nuclear program.
Instead of triggering a geopolitical crisis, the surgical strike on three major nuclear facilities has, at least in the short-run, led to geopolitical stability and improved market sentiment.
In addition to stock prices advancing since the strike, oil prices have retreated as the perceived odds of a supply shock scenario have been drastically reduced. |
|
| Crude oil - $/barrel(Year to date) |
| We have always viewed Trump as the type of politician who likes to have his cake and eat it too. With his handling of the Iranian problem, he may have accomplished just that.
Trump has consistently said that Iran must not acquire a nuclear weapon. But he also strongly opposes open-ended U.S. involvement in Middle Eastern wars.
The precision strike on the Iranian facilities severely disabled the Iranian nuclear program, but Trump also provided the regime an immediate diplomatic off-ramp. In doing so, he appears to have accomplished his main objective at essentially no cost to the United States in terms of blood or treasure.
And instead of international chaos, the nations of the world now seem to look upon the U.S. with more respect and willingness to cooperate.
Diplomatic successes
Immediately following the successful military operation in Iran, the U.S. showed progress on many important fronts in its ongoing negotiations with other countries across a range of issues.
We did not see a deterioration in relations with America’s geopolitical rivals as many had predicted.
Instead, markets took comfort in reports that China will once again allow the sale of magnets and rare earth minerals (crucial commodities used by American semiconductor manufacturers) as a new trade framework is hammered out between U.S. and Chinese diplomats.
Meanwhile, at the NATO Summit in The Hague a few days after the raid, European countries agreed to boost their financial contribution to NATO to 5% of GDP by 2035. NATO Secretary General Mark Rutte jokingly referred to Trump as “daddy” for his successful settling of the Iran-Israel conflict.
In another sign of rising U.S. prestige, on June 30, Canada suspended its 3% Digital Services Tax, which targeted leading American tech companies, after Trump temporarily halted trade talks.
Operation Midnight Hammer and the diplomacy that followed it displayed a combination of technological supremacy, moral clarity and strategic restraint that has left governments around the world, as well as investors, more confident in U.S. leadership.
Declining interest rates
The outlook for interest rates also improved in June.
Part of this had to do with declining oil prices in the aftermath of the Iran strike. Lower energy prices contribute to lower future inflation, giving the Fed more scope to cut rates going forward.
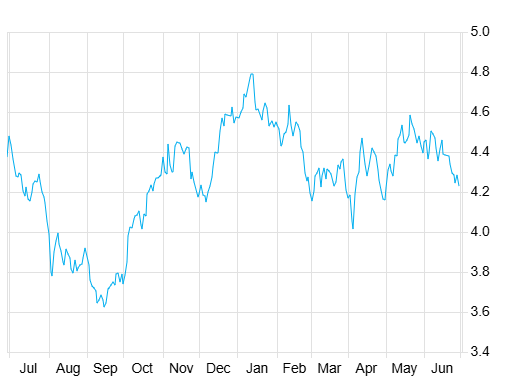
Yields on 10-Year Treasuries ended the month around 4.25%, close to their lowest levels of the year (excluding the post-Liberation Day panic when investors, fearing economic collapse, charged into Treasuries and pushed yields close to 4% for a few days).
Lower long-term interest rates are helpful for stock prices as it means borrowing costs will be lower and there will be greater liquidity in the system. |
|
| 10-Year Treasury Yields(Last 12 months) |
| Tech rebound continues
The technology sector led the way again in June. Tech stocks, as measured by the Technology Select SPDR ETF (XLK), which tracks the tech names of the S&P 500, advanced 10%. XLK was up 10% last month as well.
The tech sector has driven the recovery in stocks since markets bottomed on April 8, 2025, just prior to the tariff pause.
XLK returned 41% from 4/8/25 through 6/30/25. This compares to a total return of 25% for the broader S&P 500, which itself has more than 30% exposure to tech, which is its largest sector exposure. |
|
| Tech stocks (XLK) vs. S&P 500 (SPY)(4/8/2025 - 6/30/2025) |
| Given its high exposure within the index, tech drove the majority of the upside in the S&P 500 in June. Other sectors performed reasonably well but delivered more modest returns.
Consumer staples stocks were slightly negative for the month, as investors favored growth over defensive stocks. |
|
| | Enthusiasm around technology, especially artificial intelligence, drove stocks to new heights in early 2025. Part of this was optimism that the new administration would be highly supportive of the sector from a policy perspective.
Momentum started to break down in February, first in response to anxiety around China’s DeepSeek AI initiative (which seems to have almost entirely faded as a concern) and later with tariffs and worries over a severe rupture in trade with China.
But AI has proven very resilient as an investment theme.
AI bellwether NVIDIA (NVDA) reached a new all-time high in June. NVDA is once again the most valuable stock in the world, recently surpassing Microsoft (MSFT), after reporting an impressive growth outlook at the very end of May.
NVDA shares are up more than 60% since reaching their lowest levels of the year in early April.
What about the dollar?
With stocks setting all-time highs, energy prices low, inflation subsiding, interest rates trending down, peace and stability in the Middle East, and amazing technological breakthroughs seeming to occur on a daily basis, critics of the Trump administration appear to be running short of talking points.
Nonetheless, The New York Times gave it their best shot on June 30, focusing on recent weakness in the U.S. dollar relative to other currencies.
In The Dollar Has Its Worst Start to a Year Since 1973, columnist Joe Rennison pours cold water on the recent recovery of stocks and attempts to depict a faltering U.S. economy on the precipice of collapse. |
| | The United States’ currency has weakened more than 10 percent over the past six months when compared with a basket of currencies from the country’s major trading partners. The last time the dollar weakened so much at the start of the year was 1973, after the United States had made a seismic shift that had ended the linking of the dollar to the price of gold…. This time the seismic event is President Trump’s efforts to remake the world order with an aggressive tariff push and a more isolationist foreign policy. - The New York Times (6/30/2025) |
| | One of the challenges of being an investor with Donald Trump in the White House are the persistent attempts by the financial media, which is for the most part ideologically opposed to Trump, to spin political, economic and market events in a severely negative way.
This can have real consequences and lead to breakdowns in market confidence, as we observed in early April on the subject of tariffs. Investors who got drawn into the media-driven panic over tariffs and sold down their stock holdings missed out on substantial subsequent gains.
It is true the the U.S. dollar has declined on a year to date basis, but it is important to put this move in a larger context.
Members of the administration have indicated at multiple times that they seek a weaker dollar relative to other major currencies as part of the broader effort to rebalance global trade.
The U.S. runs very high trade deficits with the rest of the world. If the dollar is too strong, foreign firms are advantaged over American businesses. The U.S. exports less and imports more.
The Dollar Index, which was the focus of The New York Times article, measures the value of the U.S. dollar relative to a basket of foreign currencies.
The Euro represents the largest constituent of the Dollar Index with a 58% weighting. The Japanese Yen, British Pound and Canadian Dollar are assigned a 14%, 12% and 9% weighting respectively.
The Dollar Index declined significantly in the first half of 2025. But much of this merely reversed the rally in the dollar that took place in anticipation of Trump’s election and in the months that followed.
In the nine month period from September 30, 2024 through June 30, 2025, the Dollar Index only declined by 3.9%. |
|
| The Dollar Index(Last 10 Years) |
| Looking at the Dollar Index over the past 10 years, one observes that the only time the dollar was as strong as it was at the beginning of 2025 was a very brief period in late 2022.
Back then, the Fed had just started hiking interest rates, and foreign capital was quickly repositioning towards U.S. bonds.
Over the last decade, the Dollar Index has for the most part fluctuated between 90 and 110. Now at 97, it is close to the midpoint of this historical range.
While the folks at The New York Times may be deeply troubled by the move in exchange rates, from our perspective, there is nothing alarming at all here.
That being said, as we have written multiple times, most recently in Elon’s Fury: The Investment Implications of America’s Ever-growing Debt, the U.S. government does face serious fiscal challenges ahead.
We continue to view inflationary growth as the only realistic and likeliest solution to the $37 trillion problem. Trump clearly intends to choose a successor to Jerome Powell who will be inclined to bring interest rates down and stimulate economic growth and asset price appreciation.
If the U.S. is indeed going to grow/print its way out of its debt problems, long-term investors will likely be much better off owning some combination of stocks, gold and Bitcoin than cash or fixed income instruments. |
| | | The top performing stocks in the portfolio in June were Oracle (ORCL), which returned 32%; GXO Logistics (GXO), which returned 18%; NVIDIA (NVDA), which returned 17%; Texas Instruments (TXN), which returned 14%; and Eaton (ETN), which returned 11%.
The worst performing stocks in the portfolio were Costco (COST), which returned -5%, and Arch Capital Group (ACGL), which returned -4%. |
| As noted above, tech stocks were again the big winner this month, and our tech holdings performed especially well. It is worth noting that ORCL, NVDA and TXN also led performance for the portfolio in May.
ORCL has delivered outstanding results since we added it to the American Resilience portfolio just under a year ago (An AI Play with a Sensible Valuation). From 7/12/24 through 6/30/25, ORCL has returned 52%, versus 11% for the S&P 500 and 12% for the NASDAQ 100. |
|
| Total Return - ORCL, S&P 500, NASDAQ 100(7/12/24 - 6/30/25) |
| The sharp upside in ORCL in June was driven primarily by an outstanding fourth quarter earnings report and outlook, which we reviewed here.
We were originally drawn to ORCL because the valuation was modest relative to our view of the company’s tremendous prospects in AI, which seemed underappreciated.
What has occurred over the past year, and especially in the past month, is that ORCL is demonstrating to the market the reality of the opportunity in front of them. Investors are finally pricing it in.
ORCL was relatively late to the game but is rapidly becoming one of the world’s elite cloud service providers, leveraging its dominance in databases and “late mover advantage” with next-generation data center architecture.
ORCL has become a partner of choice for corporations, institutions and governments around the world who want to grow their AI capabilities aggressively.
Most of the gains in ORCL this month took place after its fourth quarter report on June 11, but shareholders were treated to additional upside (about 4%) on the very last day of the month.
On June 30, the company disclosed in a regulatory filing that it has “signed multiple large cloud services agreements including one that is expected to contribute more than $30 billion in annual revenue starting in FY28.”
For perspective on how material this new contract would be, current estimates for fiscal year 2028 revenue are just over $100 billion.
ORCL shares have advanced considerably over the past year, but the company’s position as a leader in AI has solidified and its financial outlook has improved considerably.
We are impressed with management’s execution and believe the valuation remains quite reasonable given the momentum of the business.
NVDA, which we added on 3/12/2025 amidst the tariff-related sell-off, is a similar story. Once again the most valuable business in the world, NVDA is an unquestioned leader in AI with outstanding long-term growth prospects and open-ended potential to innovate and evolve.
NVDA shares have gained 36% since we added it to the portfolio, versus 11% for the S&P 500 and 16% for the NASDAQ 100. But the stock’s valuation still makes sense relative to expected earnings growth.
Logistics services provider GXO benefited from a number of positive developments in June.
GXO received regulatory approval for an accretive acquisition in the UK, announced the hiring of a respected industry veteran as the new CEO starting in August, and lifted revenue and cash flow guidance for the year.
TXN and ETN are indirect AI plays and benefited from improved sentiment towards the AI theme as well as the industrial cycle.
A few positions in the portfolio, outside of the tech sector, were modestly lower in June. We interpret the relative underperformance of these names as reflecting renewed investor emphasis on tech-driven growth, rather than anything company-specific.
Tech stocks have led the portfolio in recent months, but it may be worth reminding subscribers, the American Resilience portfolio consists of high quality growth stocks across multiple sectors that have the potential to deliver strong long-term returns for shareholders. |
| | |
| | |
| | |
| | | Oracle Corporation (ORCL) |
|
|
| | |
|
| | |
|
| | |
|
| | Arch Capital Group (ACGL) |
|
|
| | Air Products & Chemicals (APD) |
|
|
| | |
|
| | |
|
| | |
|
| | |
|
| | |
|
| | Thermo Fisher Scientific (TMO) |
|
|
| | |
|
| | |
|
| | |
|
| | |
|
| | The 76research American Resilience Model Portfolio is designed to provide exposure to growth businesses that operate with competitive advantages in structurally attractive markets. The objective is to identify businesses that can survive and thrive across different macroeconomic environments and whatever geopolitical crises may unfold. The holdings are intended as long-term investments to drive portfolio compounding with minimal need to realize taxable gains. Emphasis is placed on critical markers of business quality such as barriers to entry, physical scarcity of assets, balance sheet strength, effective capital allocation and durable long-term growth drivers. These assessments are paired with careful consideration of valuation and risk. |
| | FOR SUBSCRIBER USE ONLY. DO NOT FORWARD OR SHARE. |
| | | |
|
|
|
|
| |
|