Income Builder
*|MC:SUBJECT|*
͏ ‌     ͏ ‌     ͏ ‌     ͏ ‌     ͏ ‌     ͏ ‌     ͏ ‌     ͏ ‌     ͏ ‌     ͏ ‌     ͏ ‌     ͏ ‌     ͏ ‌     ͏ ‌     ͏ ‌     ͏ ‌     ͏ ‌     ͏ ‌     ͏ ‌     ͏ ‌     ͏ ‌     ͏ ‌     ͏ ‌     ͏ ‌     ͏ ‌     ͏ ‌     ͏ ‌     ͏ ‌     ͏ ‌     ͏ ‌     ͏ ‌     ͏ ‌     ͏ ‌     ͏ ‌     ͏ ‌     ͏ ‌     ͏ ‌     ͏ ‌     ͏ ‌     ͏ ‌     ͏ ‌     ͏ ‌     ͏ ‌     ͏ ‌     ͏ ‌     ͏ ‌     ͏ ‌     ͏ ‌     ͏ ‌     ͏ ‌     ͏ ‌     ͏ ‌     ͏ ‌     ͏ ‌     ͏ ‌     ͏ ‌     ͏ ‌     ͏ ‌     ͏ ‌     ͏ ‌     ͏ ‌     ͏ ‌     ͏ ‌     ͏ ‌     ͏ ‌     ͏ ‌     ͏ ‌     ͏ ‌     ͏ ‌     ͏ ‌     ͏ ‌     ͏ ‌     ͏ ‌     ͏ ‌     ͏ ‌     ͏ ‌     ͏ ‌     ͏ ‌     ͏ ‌     ͏ ‌     ͏ ‌     ͏ ‌     ͏ ‌     ͏ ‌     ͏ ‌     ͏ ‌     ͏ ‌     ͏ ‌     ͏ ‌     ͏ ‌     ͏ ‌     ͏ ‌     ͏ ‌     ͏ ‌     ͏ ‌     ͏ ‌     ͏ ‌     ͏ ‌     ͏ ‌     ͏ ‌     ͏ ‌     ͏ ‌     ͏ ‌     ͏ ‌     ͏ ‌     ͏ ‌     ͏ ‌     ͏ ‌     ͏ ‌     ͏ ‌     ͏ ‌     ͏ ‌     ͏ ‌     ͏ ‌     ͏ ‌     ͏ ‌     ͏ ‌     ͏ ‌     ͏ ‌     ͏ ‌     ͏ ‌     ͏ ‌     ͏ ‌     ͏ ‌     ͏ ‌     ͏ ‌     ͏ ‌     ͏ ‌     ͏ ‌     ͏ ‌     ͏ ‌     ͏ ‌     ͏ ‌     ͏ ‌     ͏ ‌     ͏ ‌     ͏ ‌     ͏ ‌     ͏ ‌     ͏ ‌     ͏ ‌     ͏ ‌     ͏ ‌     ͏ ‌     ͏ ‌     ͏ ‌     ͏ ‌     ͏ ‌     ͏ ‌     ͏ ‌     ͏ ‌     ͏ ‌     ͏ ‌     ͏ ‌     ͏ ‌     ͏ ‌     ͏ ‌     ͏ ‌     ͏ ‌     ͏ ‌     ͏ ‌     ͏ ‌     ͏ ‌     ͏ ‌     ͏ ‌     ͏ ‌     ͏ ‌     ͏ ‌     ͏ ‌     ͏ ‌     ͏ ‌     ͏ ‌     ͏ ‌     ͏ ‌     ͏ ‌     ͏ ‌     ͏ ‌     ͏ ‌     ͏ ‌     ͏ ‌     ͏ ‌     ͏ ‌     ͏ ‌     ͏ ‌     ͏ ‌     ͏ ‌     ͏ ‌     ͏ ‌     ͏ ‌     ͏ ‌     ͏ ‌     ͏ ‌     ͏ ‌     ͏ ‌     ͏ ‌     ͏ ‌     ͏ ‌     ͏ ‌     ͏ ‌     ͏ ‌     ͏ ‌     ͏ ‌     ͏ ‌     ͏ ‌     ͏ ‌     ͏ ‌     ͏ ‌     ͏ ‌     ͏ ‌     ͏ ‌     ͏ ‌     ͏ ‌     ͏ ‌     ͏ ‌     ͏ ‌     ͏ ‌     ͏ ‌     ͏ ‌     ͏ ‌     ͏ ‌     ͏ ‌     ͏ ‌     ͏ ‌     ͏ ‌     ͏ ‌     ͏ ‌     ͏ ‌     ͏ ‌     ͏ ‌     ͏ ‌     ͏ ‌     ͏ ‌     ͏ ‌     ͏ ‌     ͏ ‌     ͏ ‌     ͏ ‌     ͏ ‌     ͏ ‌     ͏ ‌     ͏ ‌     ͏ ‌     ͏ ‌     ͏ ‌     ͏ ‌     ͏ ‌     ͏ ‌     ͏ ‌     ͏ ‌     ͏ ‌     ͏ ‌     ͏ ‌     ͏ ‌     ͏ ‌     ͏ ‌     ͏ ‌     ͏ ‌     ͏ ‌     ͏ ‌     ͏ ‌     ͏ ‌     ͏ ‌     ͏ ‌     ͏ ‌     ͏ ‌     ͏ ‌     ͏ ‌     ͏ ‌     ͏ ‌     ͏ ‌     ͏ ‌     ͏ ‌     ͏ ‌     ͏ ‌     ͏ ‌     ͏ ‌     ͏ ‌     ͏ ‌     ͏ ‌     ͏ ‌     ͏ ‌     ͏ ‌     ͏ ‌     ͏ ‌     ͏ ‌     ͏ ‌     ͏ ‌     ͏ ‌     ͏ ‌     ͏ ‌     ͏ ‌     ͏ ‌     ͏ ‌     ͏ ‌     ͏ ‌     ͏ ‌     ͏ ‌     ͏ ‌     ͏ ‌     ͏ ‌     ͏ ‌     ͏ ‌     ͏ ‌     ͏ ‌     ͏ ‌     ͏ ‌     ͏ ‌     ͏ ‌     ͏ ‌     ͏ ‌     ͏ ‌     ͏ ‌     ͏ ‌     ͏ ‌     ͏ ‌     ͏ ‌     ͏ ‌     ͏ ‌     ͏ ‌     ͏ ‌    ­ ­ ­ ­ ­ ­ ­ ­ ­ ­ ­ ­ ­ ­ ­ ­ ­ ­ ­ ­ ­ ­ ­ ­ ­ ­ ­ ­ ­ ­ ­ ­ ­ ­ ­ ­ ­ ­ ­ ­ ­ ­ ­ ­ ­ ­ ­ ­ ­ ­ ­ ­ ­ ­ ­ ­ ­ ­ ­ ­ ­ ­ ­ ­ ­ ­ ­ ­ ­ ­ ­ ­ ­ ­ ­ ­ ­ ­ ­ ­ ­ ­ ­ ­ ­ ­ ­ ­ ­ ­ ­ ­ ­ ­ ­ ­ ­ ­ ­ ­ ­ ­ ­ ­ ­ ­ ­ ­ ­ ­ ­ ­ ­ ­ ­ ­ ­ ­ ­ ­ ­ ­ ­ ­ ­ ­ ­ ­ ­ ­ ­ ­ ­ ­ ­ ­ ­ ­ ­ ­ ­ ­ ­ ­ ­ ­ ­ ­ ­ ­ ­ ­ ­ ­ ­ ­ ­ ­ ­ ­ ­ ­ ­ ­ ­ ­ ­ ­ ­ ­ ­ ­ ­ ­ ­ ­ ­ ­ ­ ­ ­ ­ ­ ­ ­ ­ ­ ­ ­ ­ ­ ­ ­ ­ ­ ­ ­ ­ ­ ­ ­ ­ ­ ­ ­ ­ ­ ­ ­ ­ ­ ­ ­ ­ ­ ­ ­ ­ ­ ­ ­ ­ ­ ­ ­ ­ ­ ­ ­ ­ ­ ­ ­ ­ ­ ­ ­ ­ ­ ­ ­ ­ ­ ­ ­ ­ ­ ­ ­ ­ ­ ­ ­ ­ ­ ­ ­ ­ ­ ­ ­ ­ ­ ­ ­ ­ ­ ­ ­ ­ ­ ­ ­ ­ ­ ­ ­ ­ ­ ­ ­ ­

Income Builder Model Portfolio

Monthly Portfolio Review: July 2025

Publication date: August 3, 2025

Current portfolio holdings

FOR SUBSCRIBER USE ONLY. DO NOT FORWARD OR SHARE.

Executive summary

  • Stock indices moved marginally higher in July but gave back much of those gains after a disappointing jobs market report last Friday.

  • The Income Builder generated a total return of 2.4% this month, outpacing the 2.1% return of the S&P 500.

  • The top performing positions in the portfolio were Carlyle Group (CG), which rose 18%; Blackstone (BX), which rose 16%; and Diamondback Energy (FANG), which rose 8%.

  • The most significant detractor within the portfolio was Texas Instruments (TXN), which declined 12% after management nudged down guidance for next quarter; we see no impact on the long-term thesis.

  • Although stocks ended last week on a sour note, we view the overall investment backdrop as favorable—solid economic growth, receding tariff risk and sustained AI momentum.

  • To the extent weaker labor markets translate into falling interest rates, this may especially benefit high dividend stocks, which compete with fixed income alternatives.

Performance review

The Income Builder portfolio returned 2.4% in July, outpacing the S&P 500, which returned 2.1%. On a year to date basis, the portfolio has generated a total return of 5.5%, versus 8.6% for the index.


The top performing positions in the portfolio in July were Carlyle Group (CG), which returned 18%; Blackstone (BX), which returned 16%; and Diamondback Energy (FANG), which returned 8%.


The most notable decliner this month was Texas Instruments (TXN), which returned -12%.

Stocks Set New Highs


In July, the stock market delivered a third consecutive month of positive returns, although much of this performance was erased on the first day of August, which was the final day of trading last week.  

S&P 500 and NASDAQ Composite

Total Return (12/31/24 - 7/31/25)

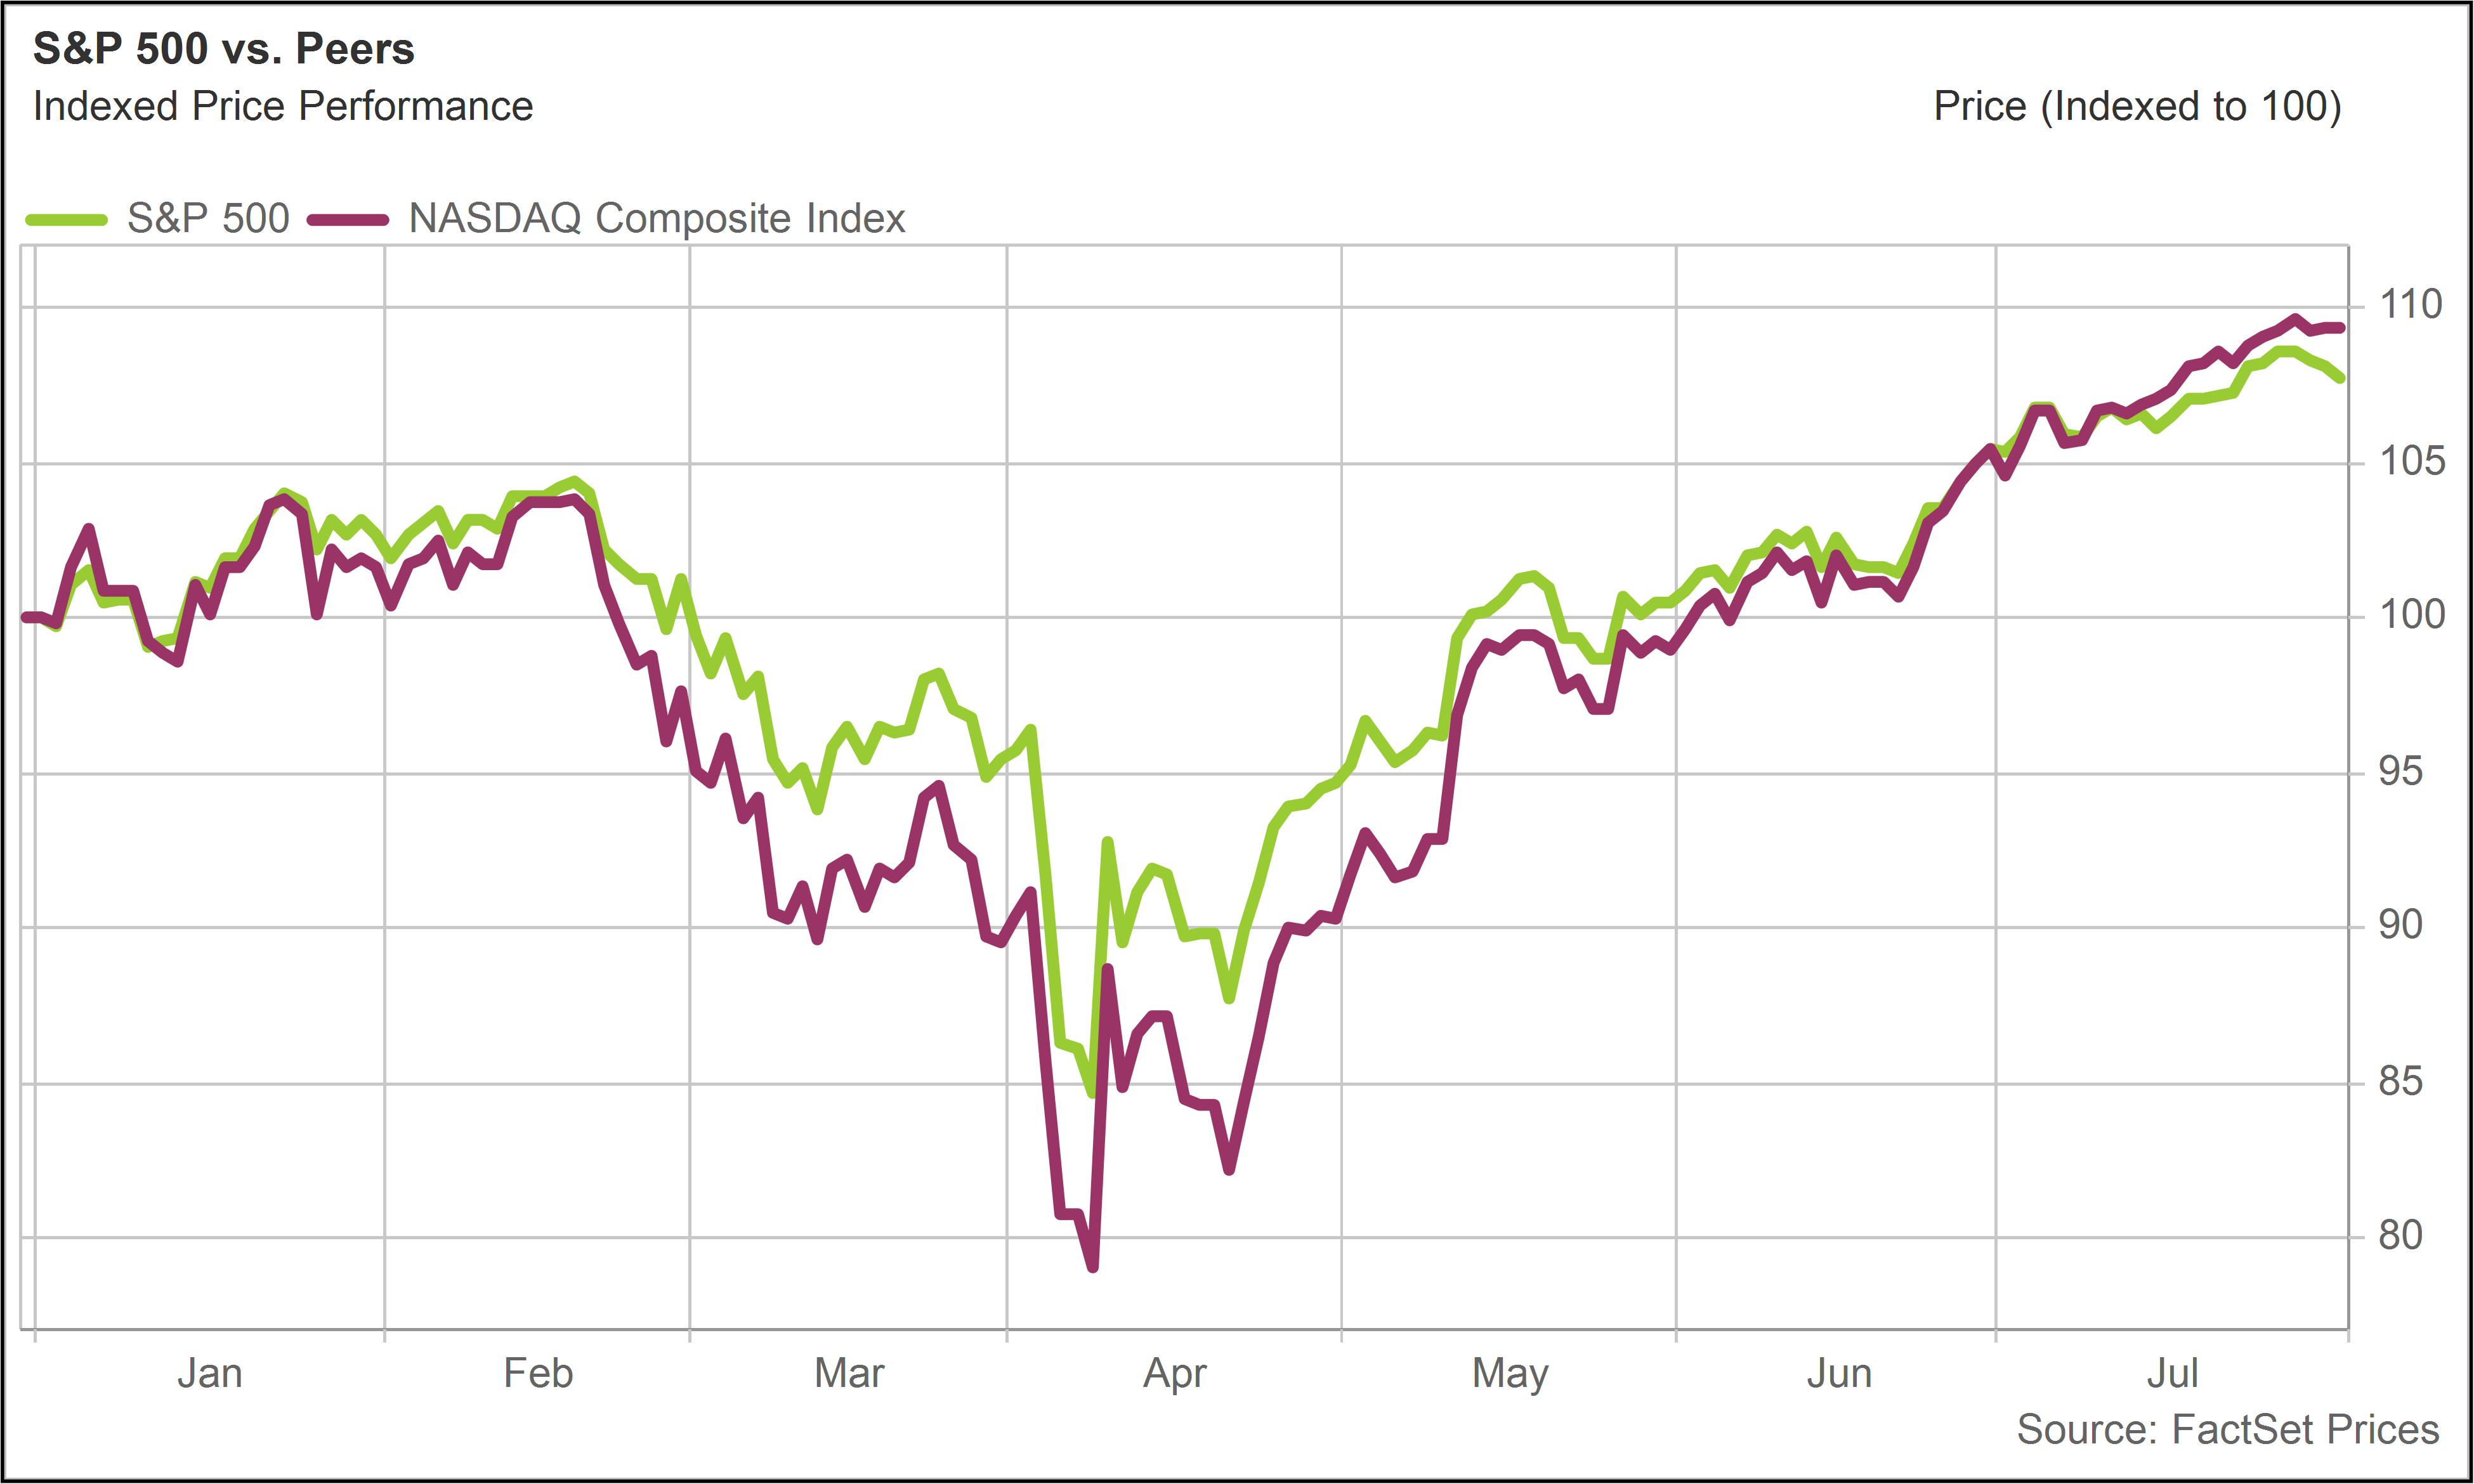
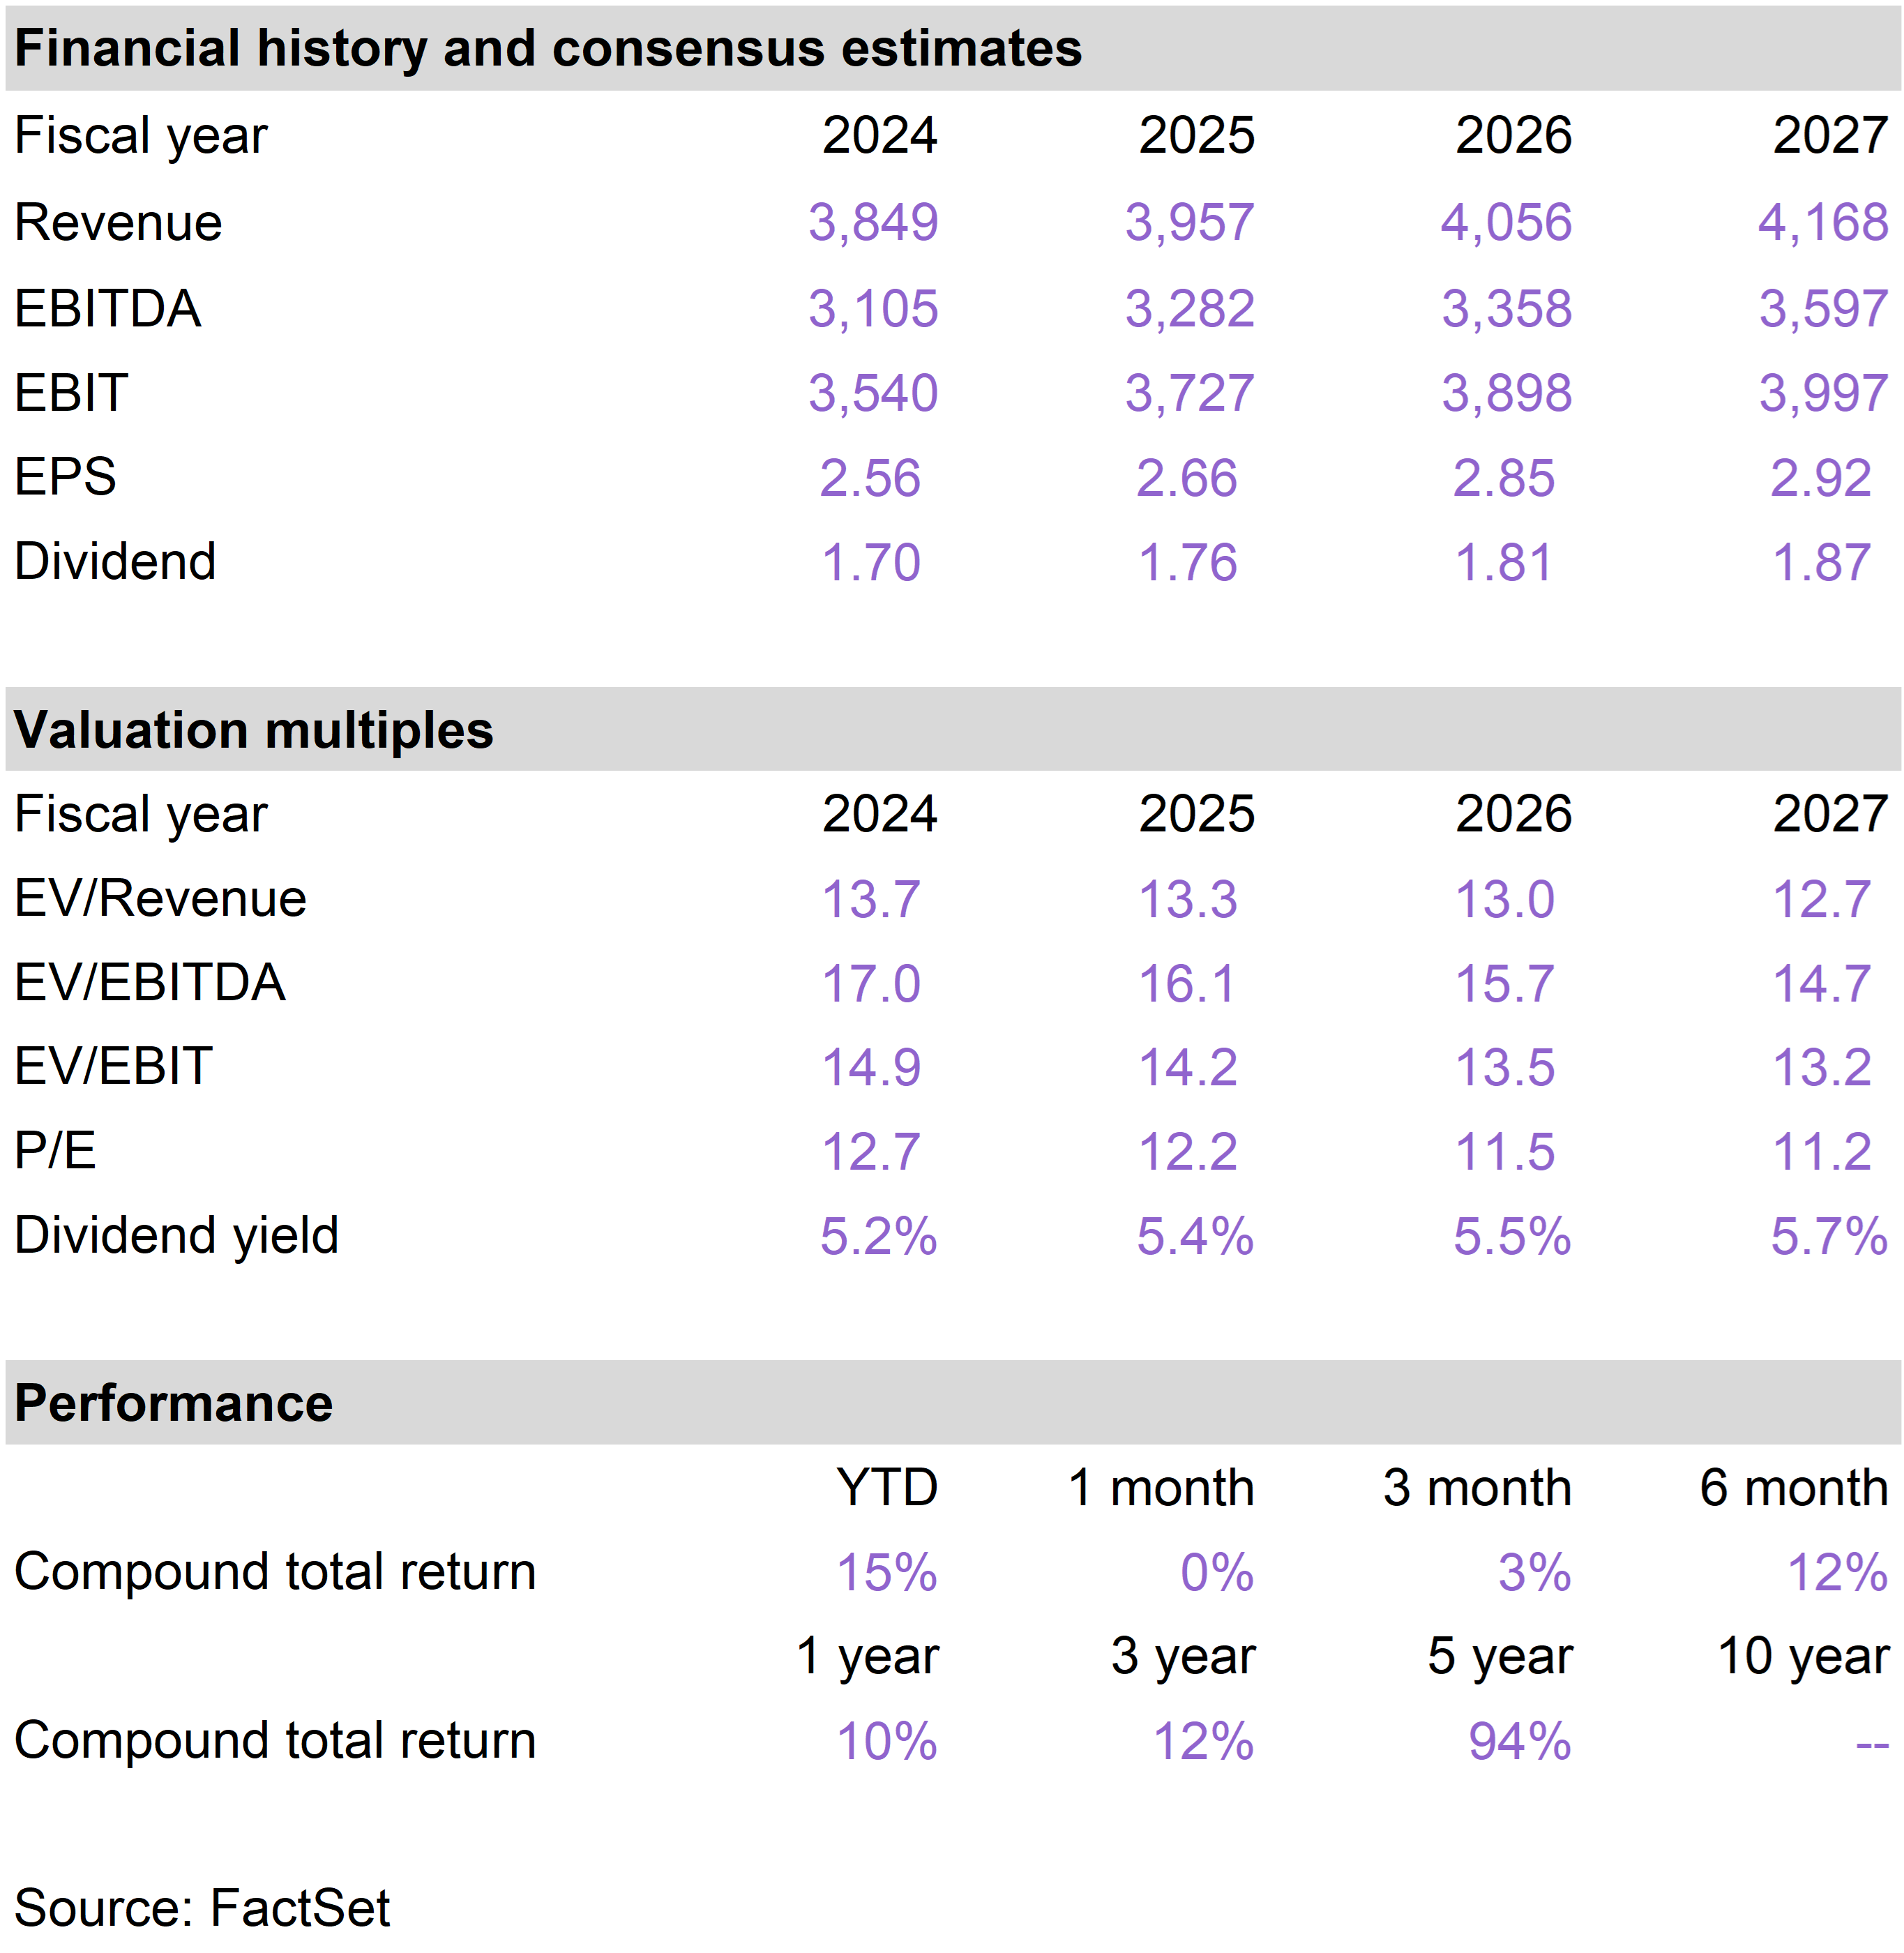
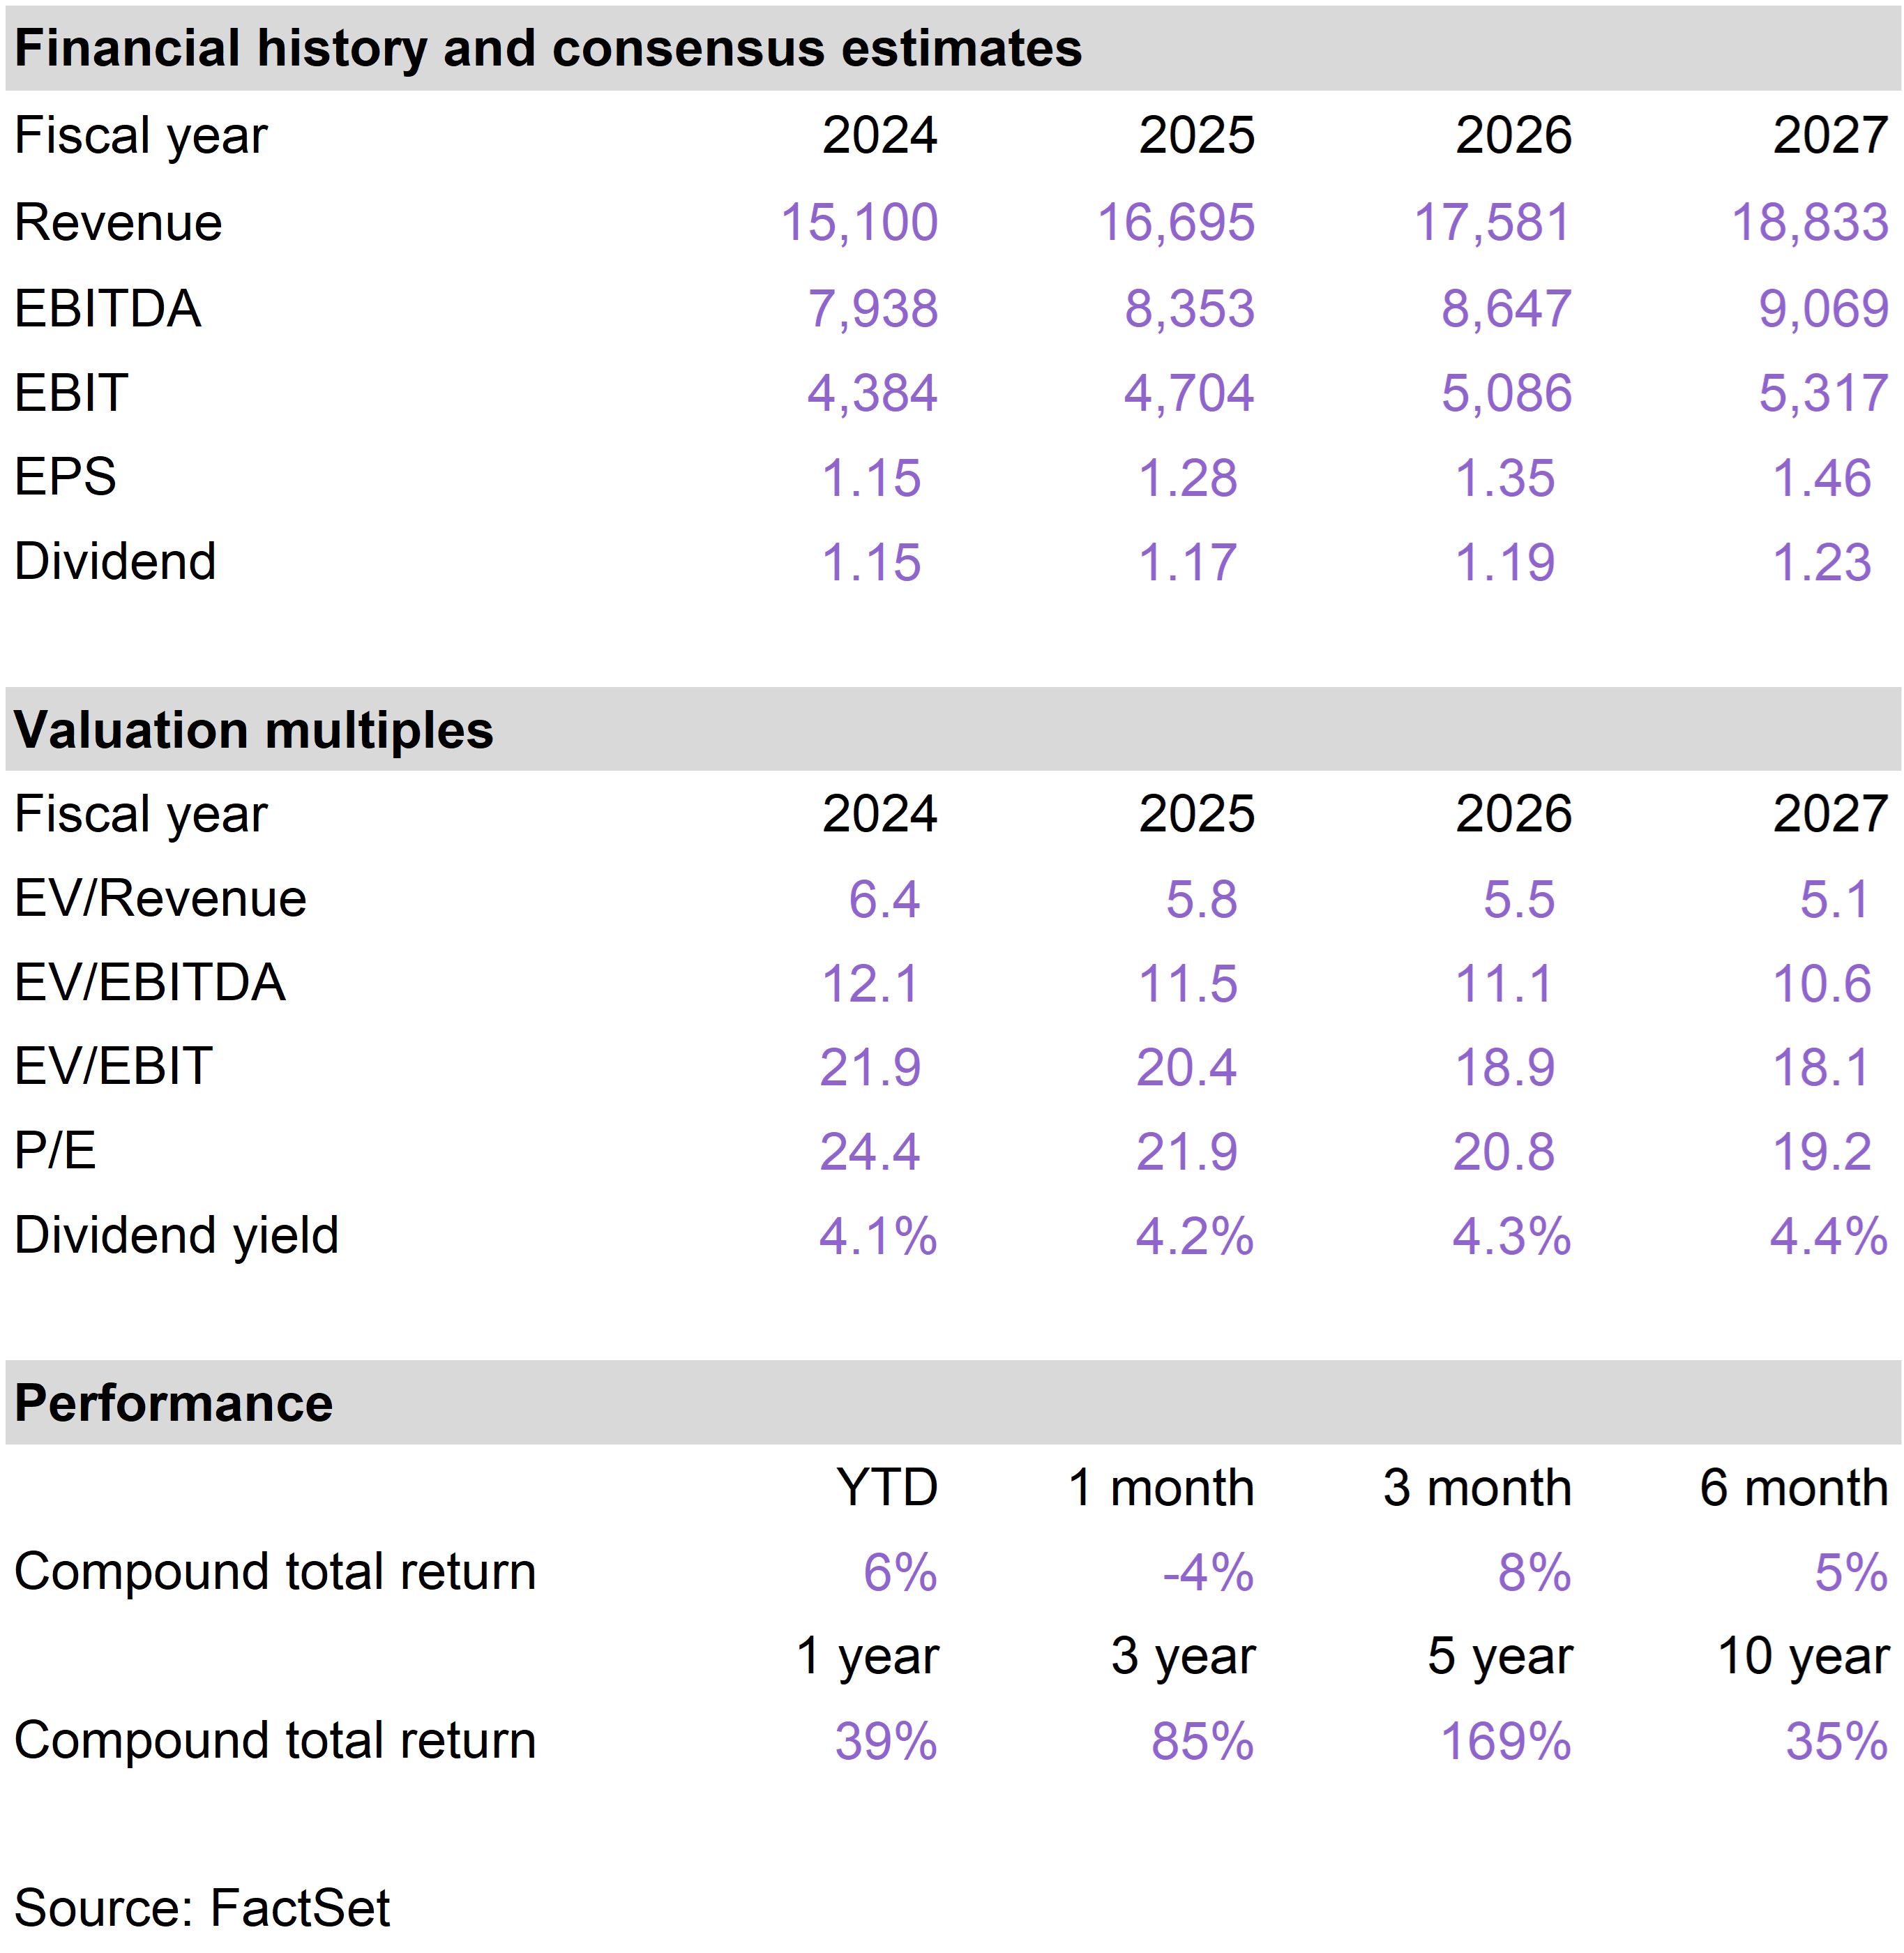
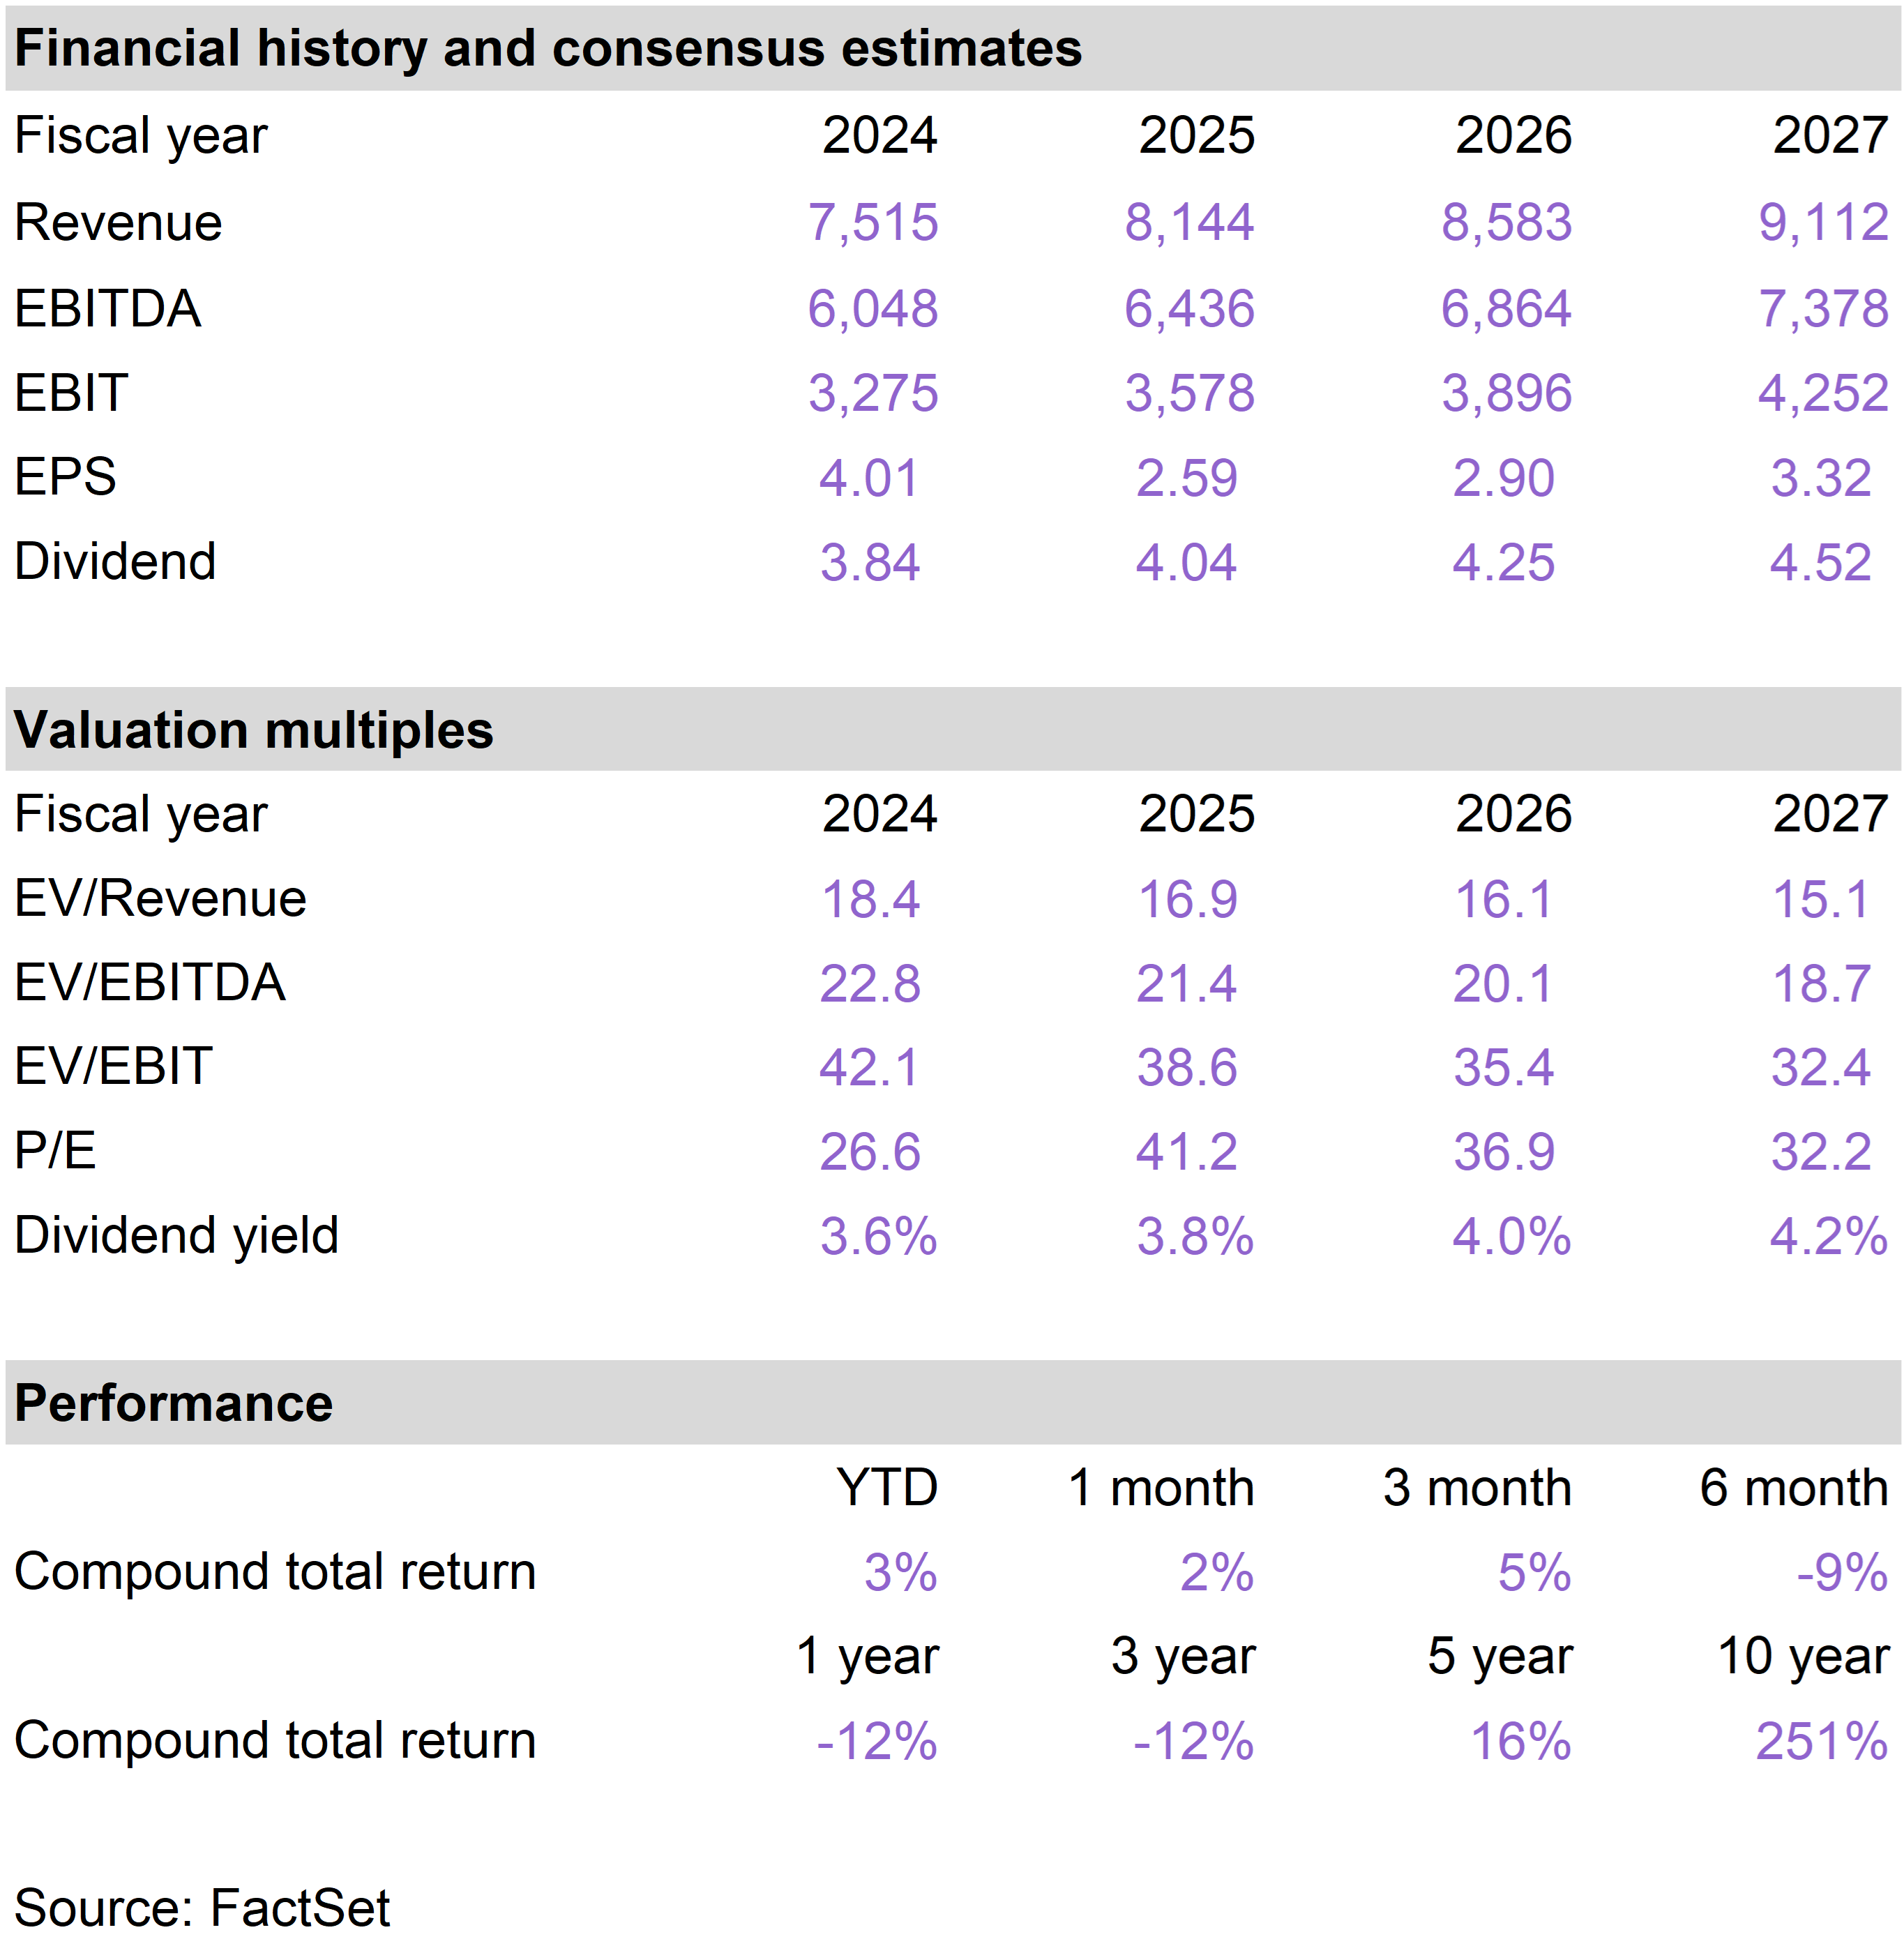
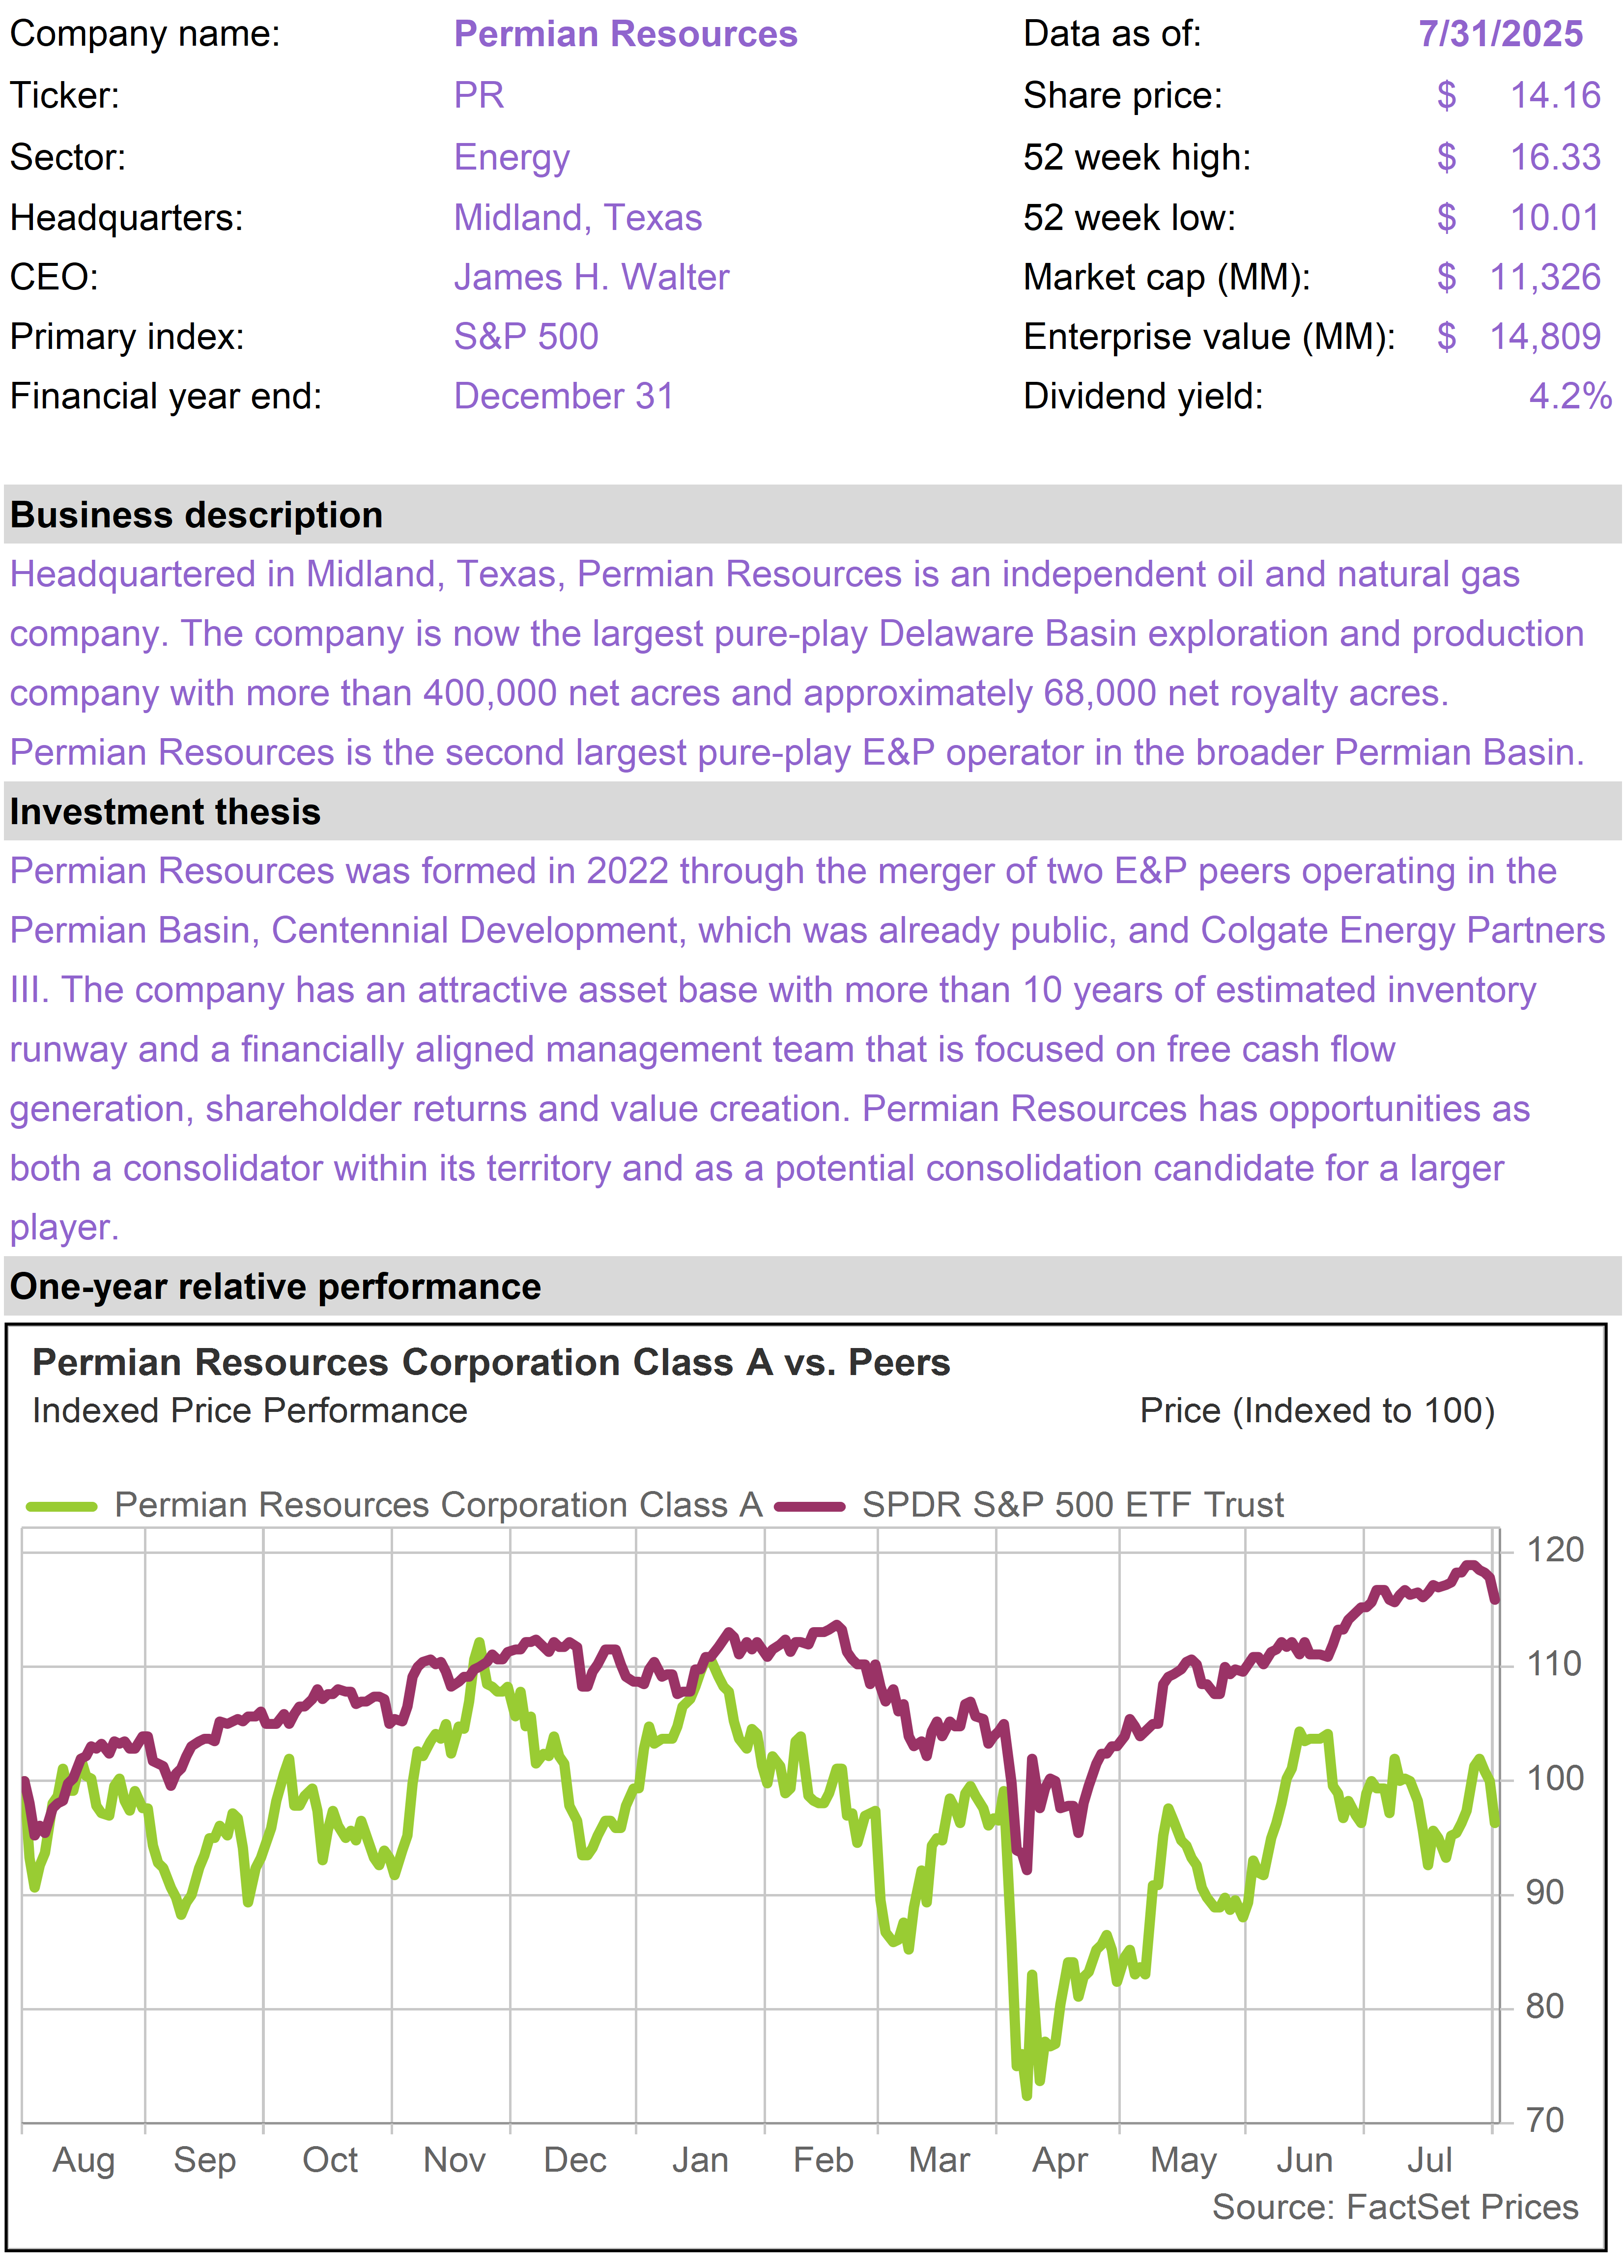
Market momentum was propelled by a spate of encouraging second quarter earnings reports, particularly in the tech sector and related industries that are linked to the AI theme.


Two notable earnings reports towards the end of the month came from Microsoft (MSFT) and Meta (META). Both stocks advanced sharply after the companies disclosed strong revenue growth associated with AI initiatives and plans for sustained investment.


Earlier in July, Alphabet (GOOGL) reported substantial growth, in excess of 30%, in its Cloud segment.


The company pointed to strong take-up in AI-related services as the internet search giant navigates its way from traditional search, where it dominates, towards an AI-assisted approach with its Gemini offering.


Tariff-related anxiety contributed to the market sell-off on August 1, the official implementation date for high tariff rates to go into effect for countries that have not yet struck deals with the U.S.


Despite lingering concerns around tariffs, July was a month where we saw significant progress on trade.


Early in the month, the U.S. reached a deal with the United Kingdom. This was followed by deals with emerging market Asian nations that have high trade deficits with the U.S., including Vietnam, Indonesia, the Philippines, and Thailand.


Then came South Korea and Japan. Among other things, they each committed to making hundreds of billions of dollars of investments in the U.S. and comparably large purchases of American energy.


A similar framework was reached by the end of the month with the European Union (EU).


Remarkably, as recently as 2014, the EU as an economic bloc was larger than the American economy in GDP terms. Today, the EU economy is about two-thirds the size of the U.S.


The EU has badly lagged the economic performance of the U.S., largely because of its failure to cultivate a strong technology industry. Nonetheless, with current GDP of approximately $20 trillion, it still represents a major global economic force.


Several countries have not finalized trade deals, including Canada and Mexico. China is not quite done either, although Treasury Secretary Scott Bessent assured the press last week that his meetings with Chinese counterparts have been “very constructive.”


Some tariff uncertainty remains, but we have clearly come a long way from the depths of the post-Liberation Day sell-off, when investors started pricing in a world of violent trade wars.


Much of the strong performance we have seen from stocks since then can be attributed to this movement away from extreme trade anxiety towards a more certain and stable international outlook.


Is the U.S. economy healthy?


While tariffs and trade potentially become back burner issues as more deals get finalized, investors are now fretting over the state of the U.S. economy. The financial media, as always, is happy to contribute to the doom and gloom mentality.


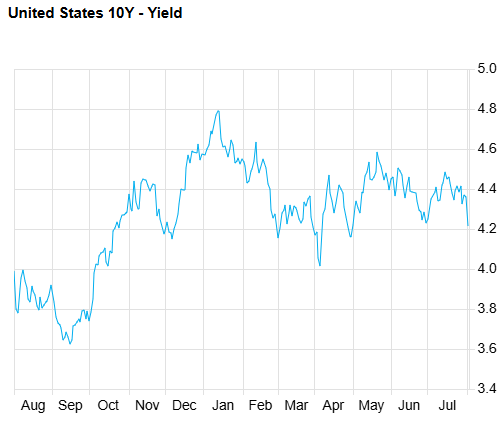
Despite a very solid 3.0% GDP print last week, the Bureau of Labor Statistics (BLS) jobs report on Friday, August 1 was interpreted by many as painting a picture of faltering economic growth.


The BLS reported some 73,000 new jobs added, versus consensus expectations closer to 110,000. There were also significant downward revisions to prior months.


Intentionally or not, President Trump drew even more investor attention to the report when he took the very unexpected step of firing the Commissioner of the department, Erika McEntarfer.

I was just informed that our Country’s “Jobs Numbers” are being produced by a Biden appointee, Dr. Erika McEntarfer, the Commission of Labor Statistics, who faked the Jobs Numbers before the Election to try and boost Kamala’s chances of Victory…. We need accurate Jobs Numbers. I have directed my Team to fire this Biden Political Appointee IMMEDIATELY. - Donald Trump on Truth Social (8/1/2025)

Trump’s ability to fire Fed Chair Jerome “Too Late” Powell faces various legal constraints, which probably cannot be overcome. But his authority to dismiss McEntarfer (and replace her with someone he has more confidence in) is undisputed.


Similar to the dynamic with Powell, Trump’s move has been interpreted by many as shooting the messenger and undermining the institutional independence of government agencies.


The employment picture


Setting aside all the political theatre, the core question for investors remains… what really is the condition of the labor market? And what does it mean for stock prices?


It is not terribly surprising that hiring was soft in the second quarter of 2025. The quarter began on Liberation Day and saw an extreme spike in market volatility.


A backdrop of plunging share prices and macro uncertainty is not one that is conducive for firms to take on new employees.


It is also important to consider that much of the decline in net jobs was attributed to the public sector. These are government jobs that were deliberately eliminated as opposed to private sector jobs that the administration wants to create.


With GDP coming in last week at a healthy 3.0% growth rate, it is hard to get too alarmed by a jobs report miss of approximately 40,000 in the context of an American labor market that consists of some 160 million jobs.


The miss represents a tiny fraction of one percent of the total job market. As we know from repeated revisions to these numbers historically, the government’s ability to produce accurate real-time measurements of the labor market is quite limited.  


To be fair, last week’s GDP number was flattered somewhat by falling imports, which causes a statistical boost to GDP, just as the prior quarter’s GDP report looked worse than it really was because of a pre-tariff rise in imports.


But with corporate earnings surging, trade deals getting finalized and stocks hovering around all-time highs, the economy has unmistakably strong positive momentum.


Falling rates


No one likes to celebrate weak job growth, but investors in stocks, and arguably Trump himself, should not be too upset if there is indeed some developing labor market weakness.


The Federal Reserve has a dual mandate of maximizing employment and keeping prices stable. To the extent there is any labor market softness, this forms the basis for potential rate cuts going forward.


After the jobs report on Friday, interest rates moved down materially as bond investors priced in higher odds of rate cuts later this year. Yields on 10-Year Treasuries now sit around 4.2%, close to their lowest levels since Trump was elected.

10-Year Treasury Yields

(Last 12 months)

Investors in stocks certainly have no interest in seeing a massive spike in unemployment that could lead to a collapse in consumer confidence and spending.


But investors arguably do have an interest in seeing some slack in labor markets, which is precisely what will get Fed governors to pivot away from their currently restrictive monetary policy and towards rate cuts.

AI-linked sectors lead the way


Utilities, Tech, Industrials and Energy were the best performing sectors of the market in July and outperformed the S&P 500 Index as a whole. These sectors are linked together by a high degree of connection to the AI buildout.


Technology stocks are clearly the most exposed, but Utilities, Industrial and Energy companies are playing a pivotal role in building and powering the data centers that are the foundation of the AI revolution.


The relative success of these sectors in July reflects improved investor sentiment towards the AI theme that flowed from the encouraging earnings reports.

Source: FactSet

Health Care was a notable laggard in July. Pharmaceutical stocks performed poorly, as the Trump administration demanded drug price reductions.


Additionally, several managed care stocks saw precipitous declines as a result of legislative cost containment initiatives related to Medicare and Medicaid. Shares of Centene (CNC) and Molina Health (MOH) were each down about 50% in July.


Favorable outlook


Corporate hiring was undoubtedly affected by market volatility and policy uncertainty in the early part of the second quarter. These overhangs are now gone.


To the extent we see additional labor market slack, this just bolsters the case for rate cuts, which tend to lead to higher stock market valuations.


With nearly half the market cap of the S&P 500 consisting of technology or technology platform stocks, the reality of the stock market in 2025 is that its fate is much more tied toward secular growth trends like the AI buildout as opposed to small fluctuations in employment levels.


Labor market conditions of course matter a great deal for households, but in terms of the stock market now, what really matters is AI growth trends, geopolitical stability and interest rates. All three appear to be headed in the right direction.  

Portfolio highlights

The top performing positions within the portfolio in July were Carlyle Group (CG), which delivered an 18% total return; Blackstone (BX), which delivered a 16% total return; and Diamondback Energy (FANG), which delivered an 8% total return.


The most notable detractor in the portfolio was Texas Instruments (TXN), which returned -12%.

CG once again led the portfolio and continues to recover from the April sell-off, reaching a new all-time high towards the end of the month.


The alternative asset manger also announced a reconfiguration of senior management, which was well received by shareholders. Three veterans of the firm have been named Co-Presidents, with dedicated responsibility for different market segments.


The goal of the management realignment is to accelerate growth in each of these areas.


BX is the world’s leading alternative asset manager. Both CG and BX stand to benefit from more buoyant equity markets and falling interest rates, which are especially helpful for the firms’ private equity/leveraged buyout divisions.


BX delivered strong second quarter earnings towards the end of July. Importantly, on the earnings call, senior management indicated that the “deal making pause is behind us.”


Management anticipates a significant pick-up in Merger and Acquisitions activity as well as Initial Public Offerings over the next two years. This would allow BX to realize greater profitability on its wide-ranging investments and likely help asset raising.


Readers may be aware that a senior Blackstone executive was senselessly murdered by a gunman in New York City last week. While Wesley LePatner had an important role as the head of Blackstone’s large private REIT, we do not expect a materially adverse impact on the overall business.


Ms. LePatner was held in the highest regard across the investment industry. She is evidence that Blackstone attracts and retains the very best talent in the financial services industry. Our thoughts and prayers are with her many friends and family.


Shares of FANG recovered in July, largely tracking movements in the oil price, which advanced marginally over the course of the month. The company is expected to report earnings in early August.


We continue to like FANG as a well-managed, low cost producer that is profitable even in low oil price environments.


After several months of strong performance, TXN shares traded down in July following its earnings report.


Reported financial results were actually solid, but investors reacted quite negatively to guidance for next quarter’s revenue growth, which at 4% was slightly below expectations.


Management, which is historically conservative in its outlook, suggested there has been some tariff-related pull-though on demand, particularly in China, which could reverse somewhat next quarter.


Notwithstanding the market’s jitters around these cyclical factors, we believe the long-term story for TXN is intact. As AI applications proliferate, it will create sustained demand growth for analog semiconductors across the automotive, industrial and robotics sectors.


To the extent long-term interest rates continue to drift lower, we view this as an especially helpful tailwind for high dividend stocks, which could see improved valuations as yields on bond alternatives get lower.

Key metrics

Valuation detail

Performance detail

Company snapshots

Blackstone (BX)

Digital Realty Trust (DLR)

Diamondback Energy (FANG)

Texas Instruments (TXN)

VICI Properties (VICI)

Williams (WMB)

Crown Castle (CCI)

Carlyle Group (CG)

Kinder Morgan (KMI)

Mid-America Apartment (MAA)

Prologis (PLD)

Permian Resources (PR)

Sempra (SRE)

WEC Energy Group (WEC)

The 76research Income Builder Model Portfolio is intended for income-oriented investors and managed to generate an overall yield that is materially higher than broad equity indices. The portfolio includes stocks with above average dividend yields from a cross section of industries. While investments are screened for their income and income growth characteristics, specific holdings are chosen based on valuation and general business quality, growth and risk considerations.

FOR SUBSCRIBER USE ONLY. DO NOT FORWARD OR SHARE.