| Income Builder Model Portfolio |
|
| Monthly Portfolio Review: May 2026Publication date: June 1, 2026 |
|
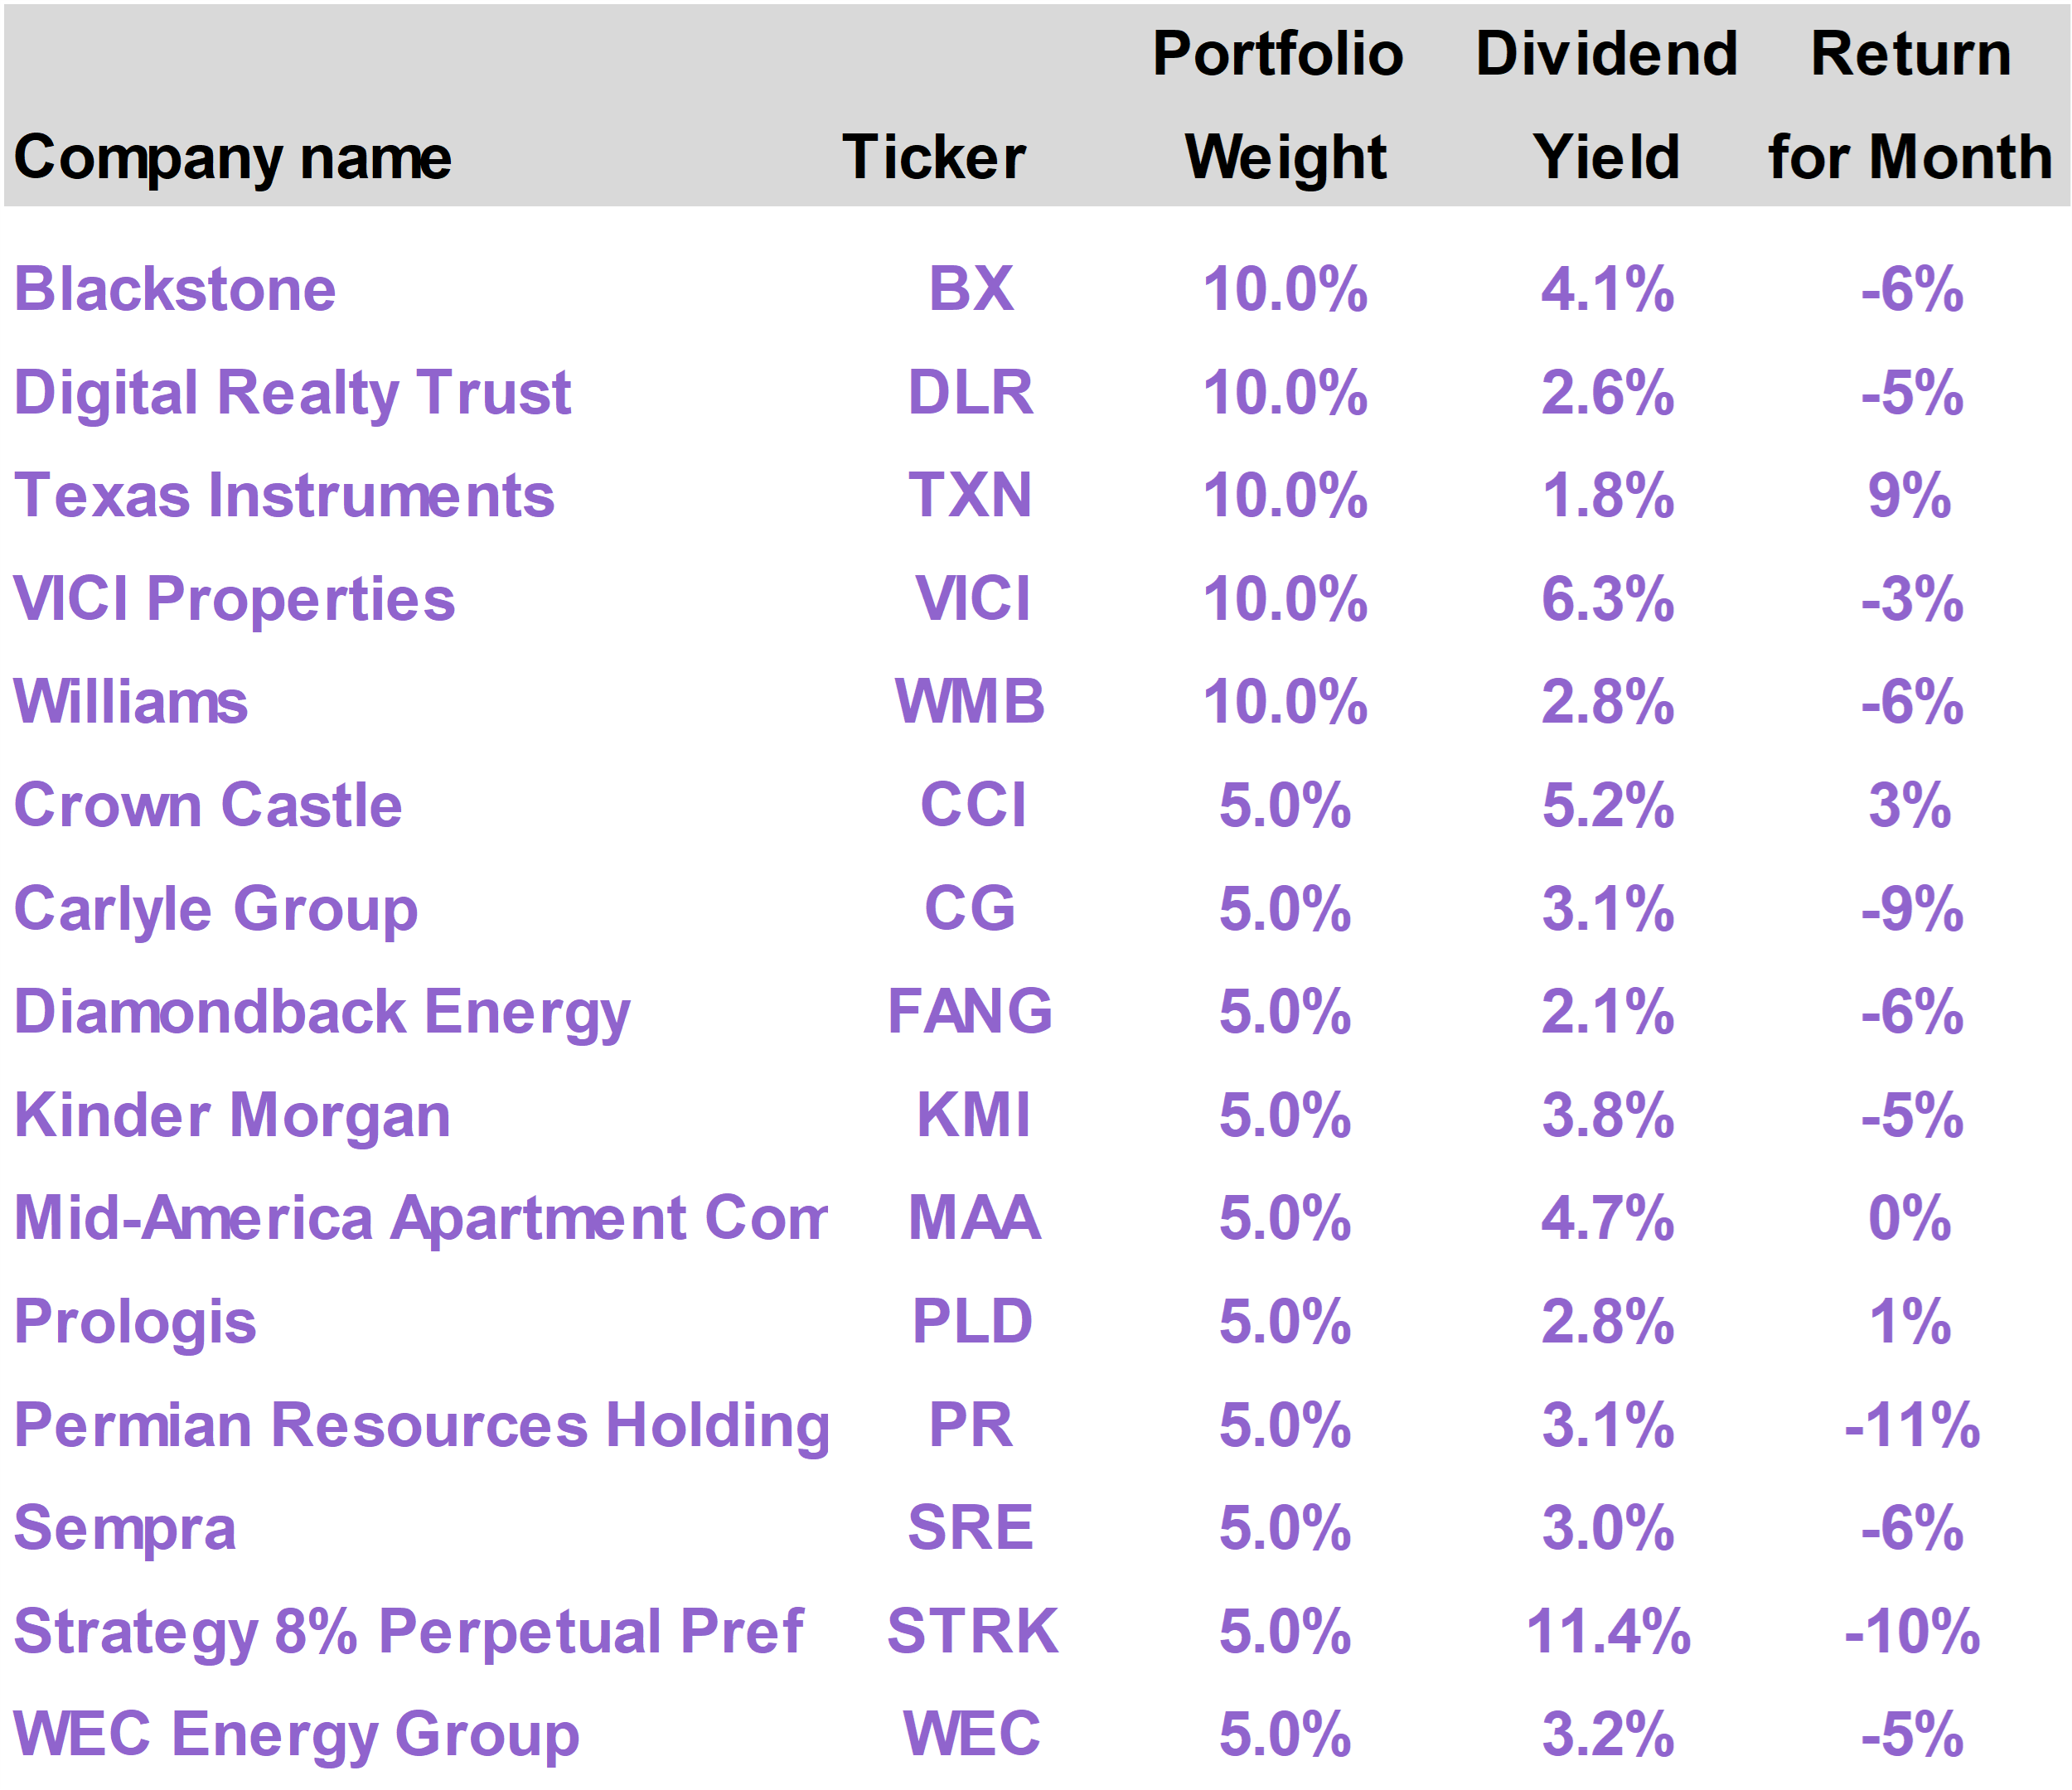
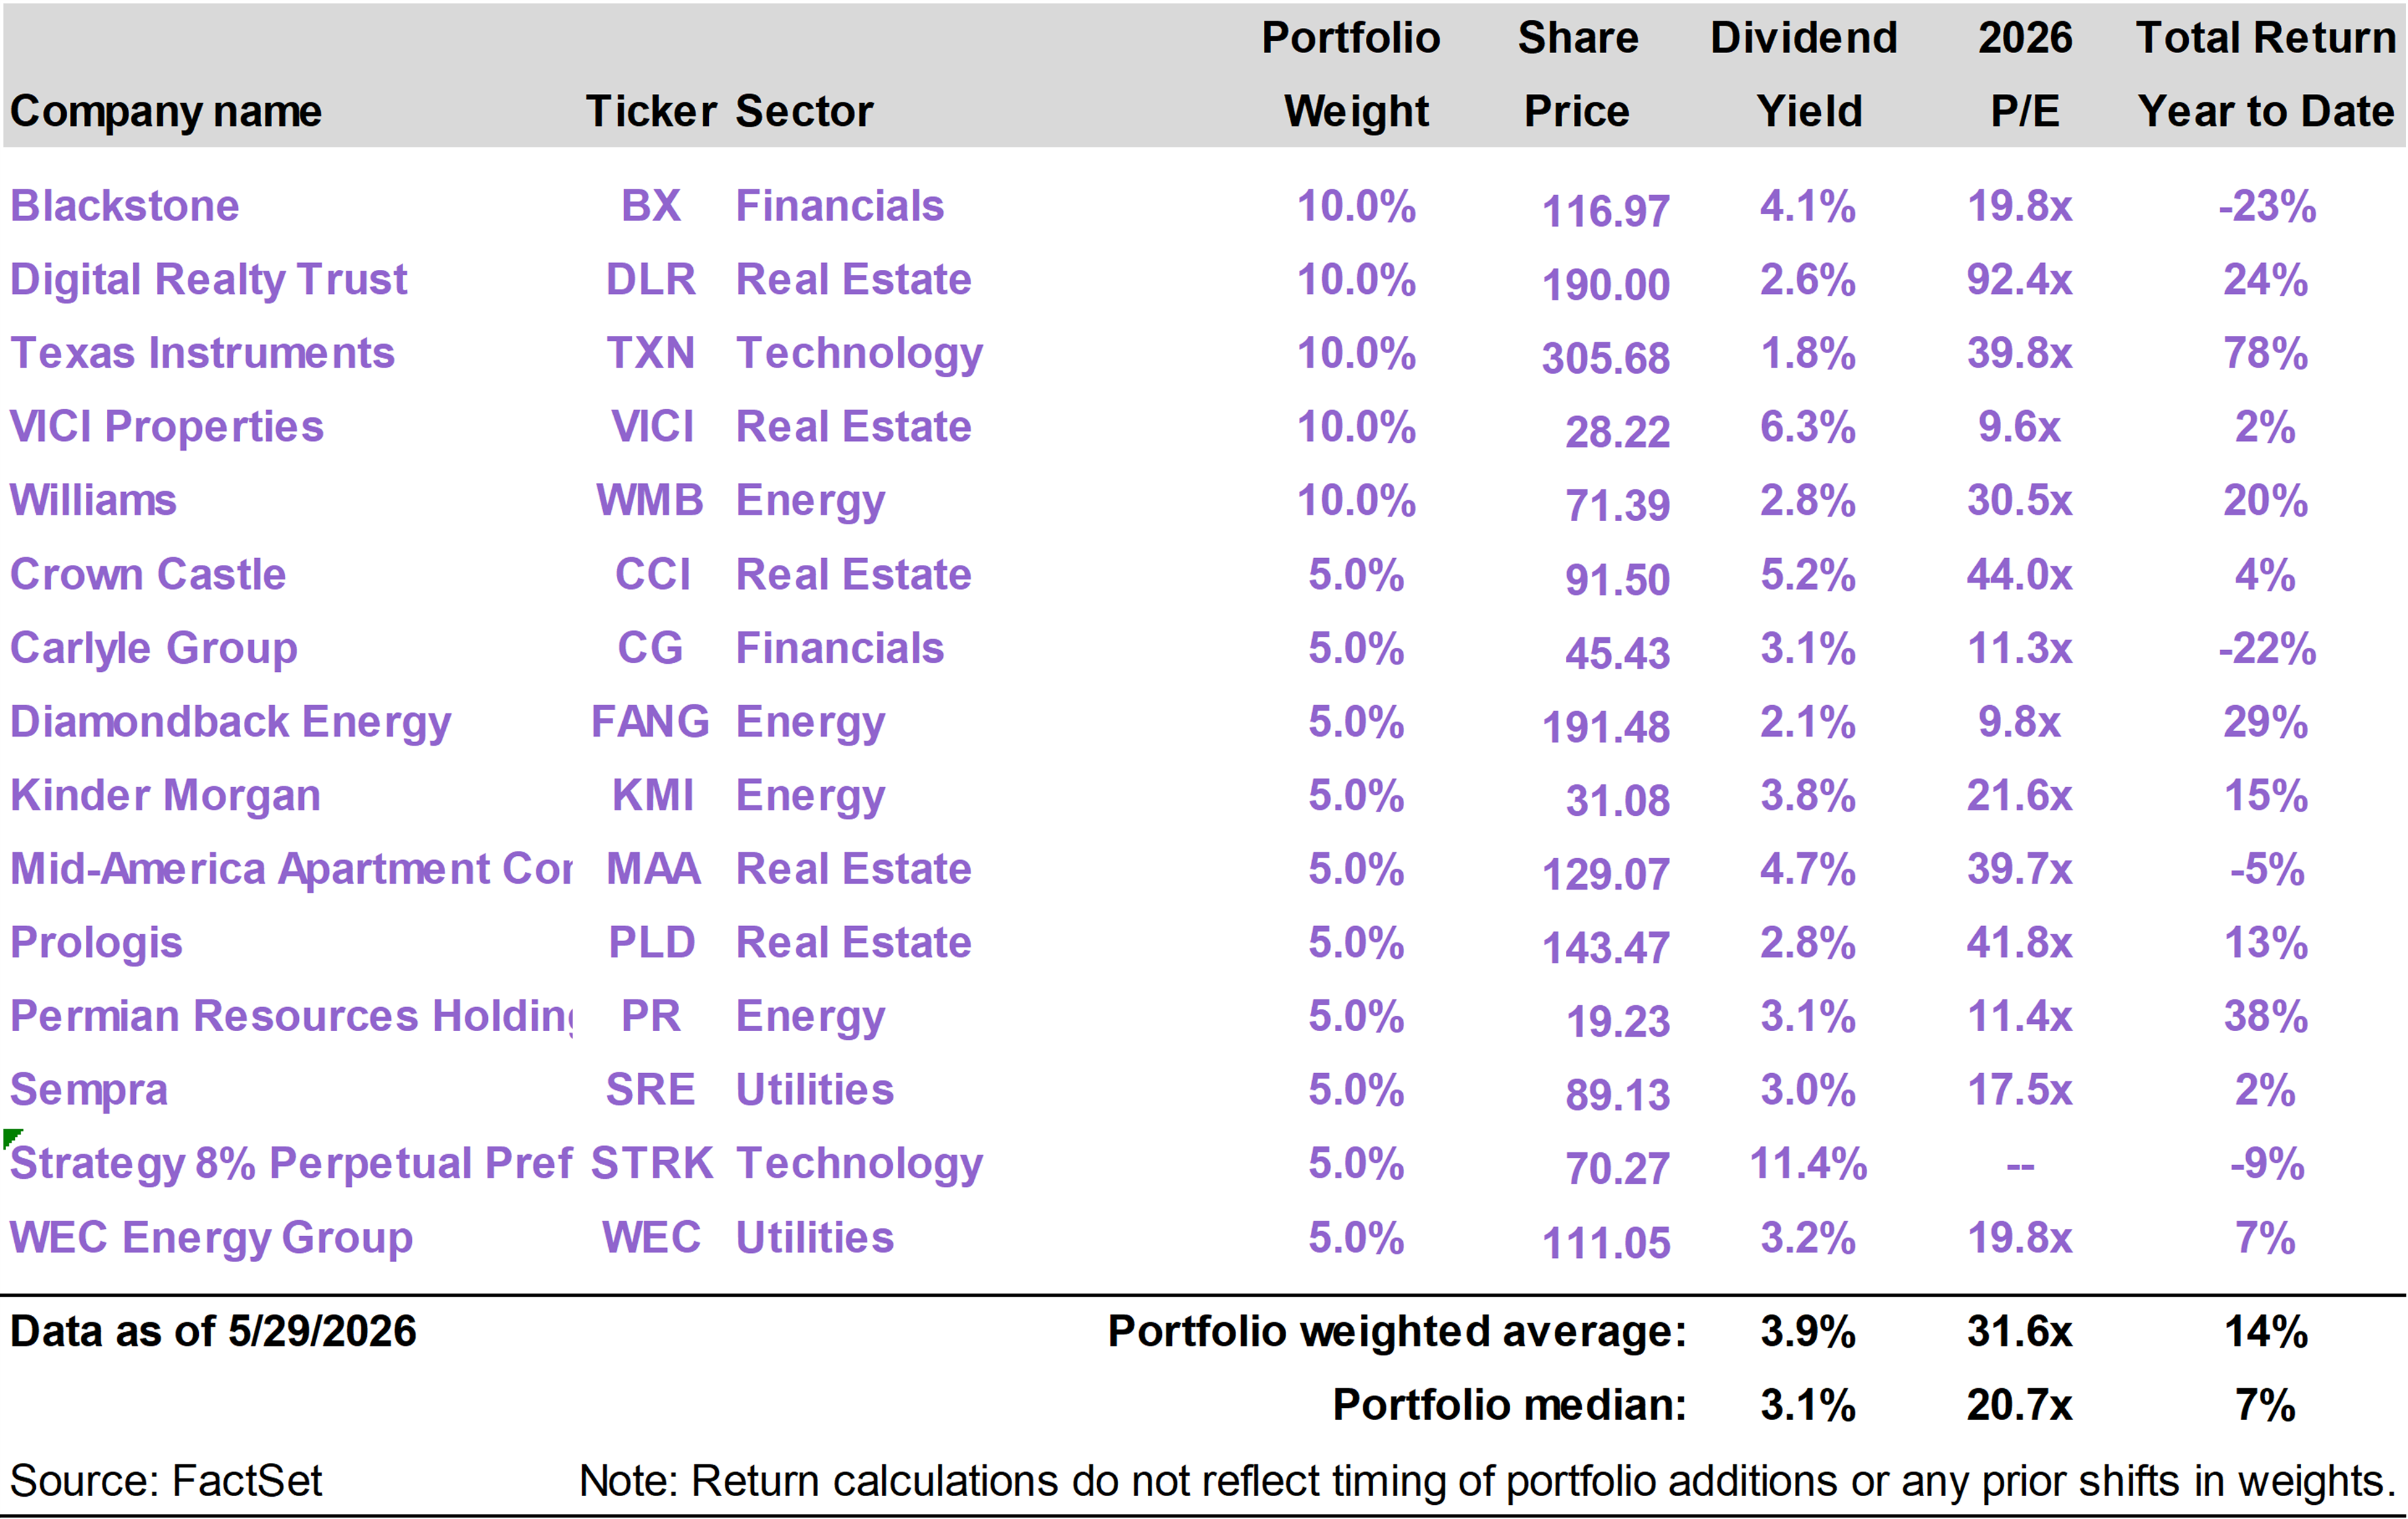
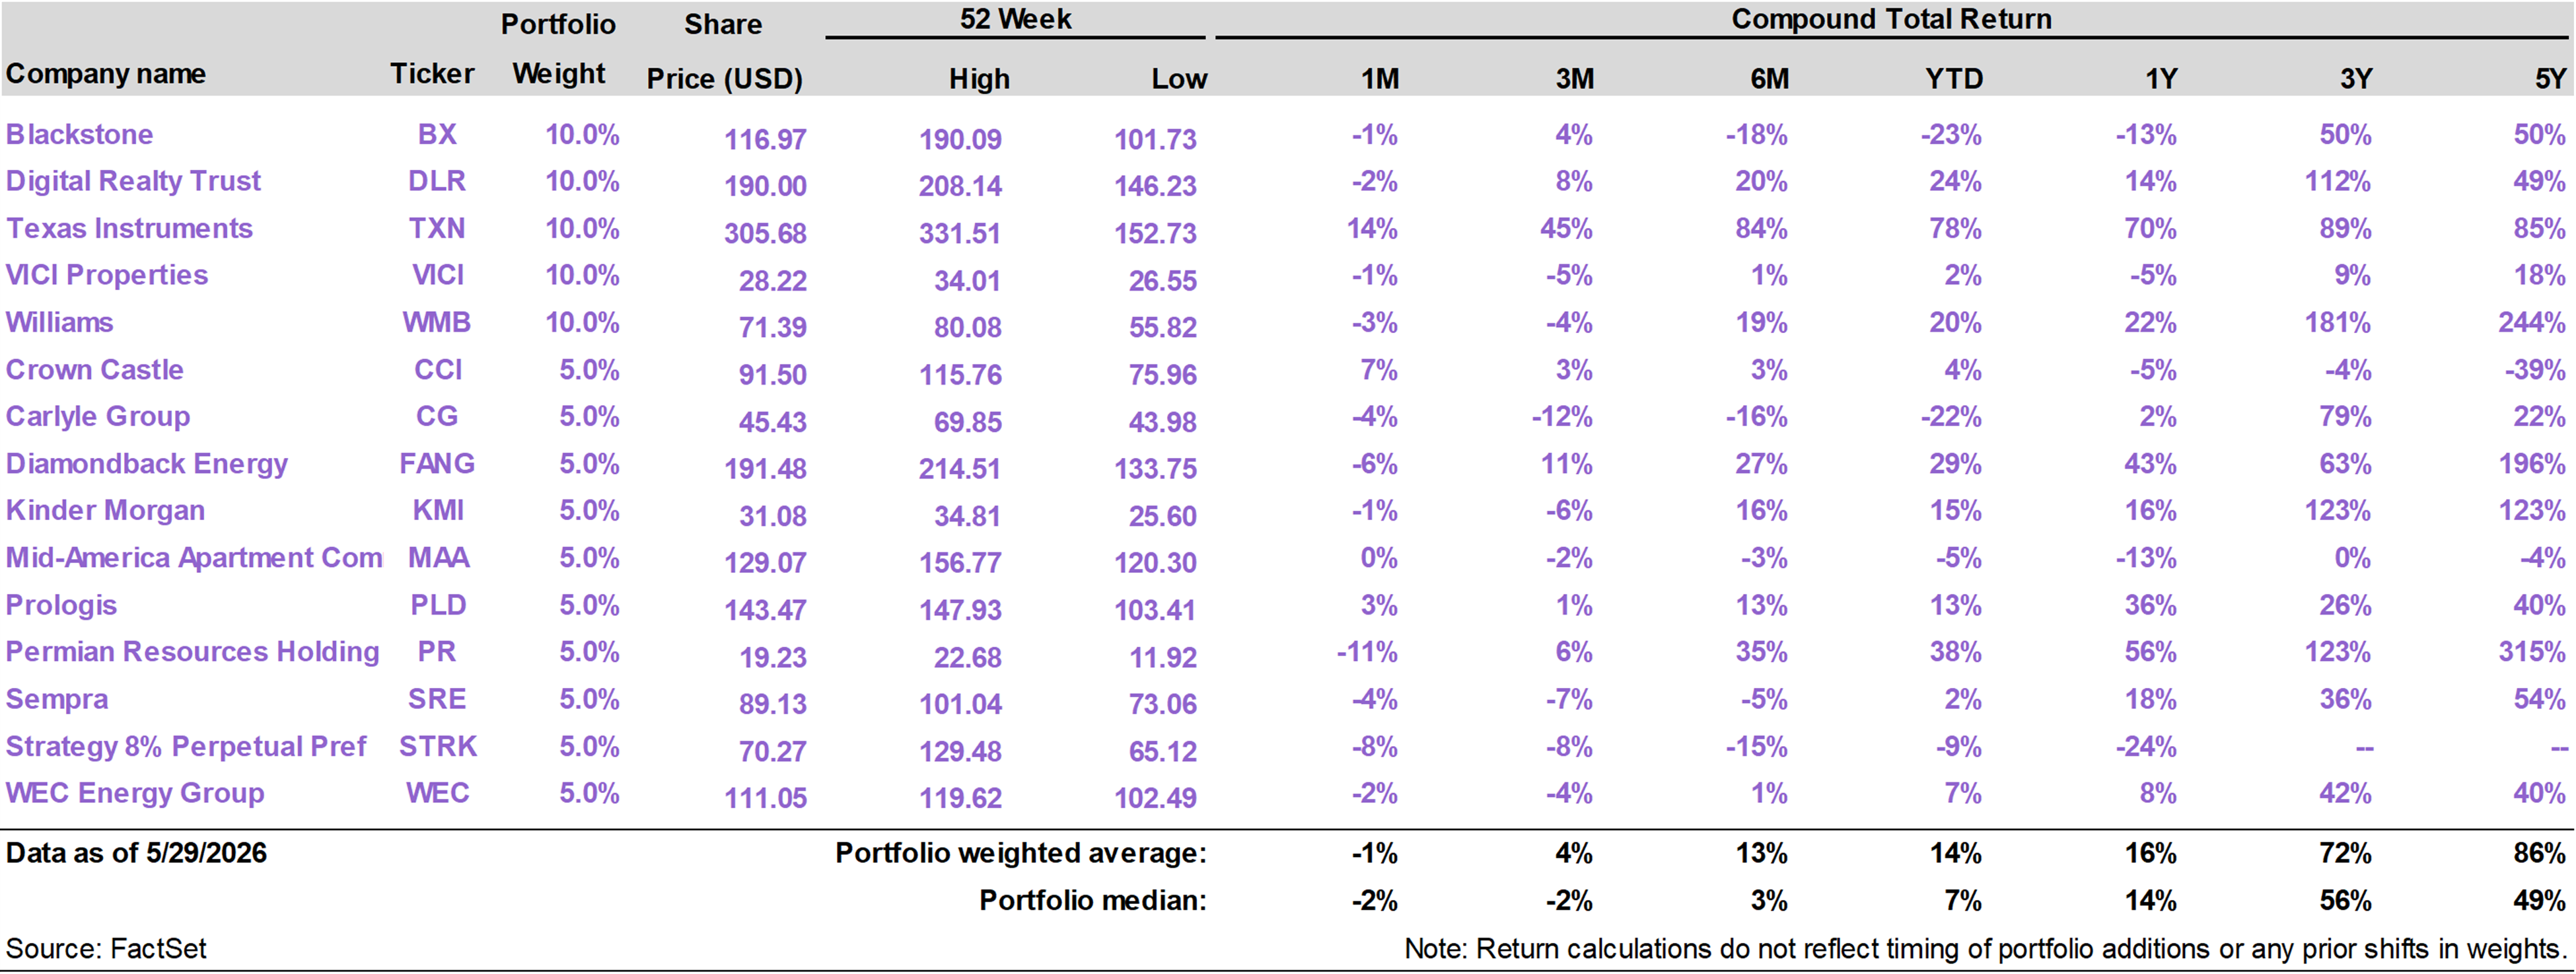
| | | Current portfolio holdings |
|
|
| | FOR SUBSCRIBER USE ONLY. DO NOT FORWARD OR SHARE. |
|
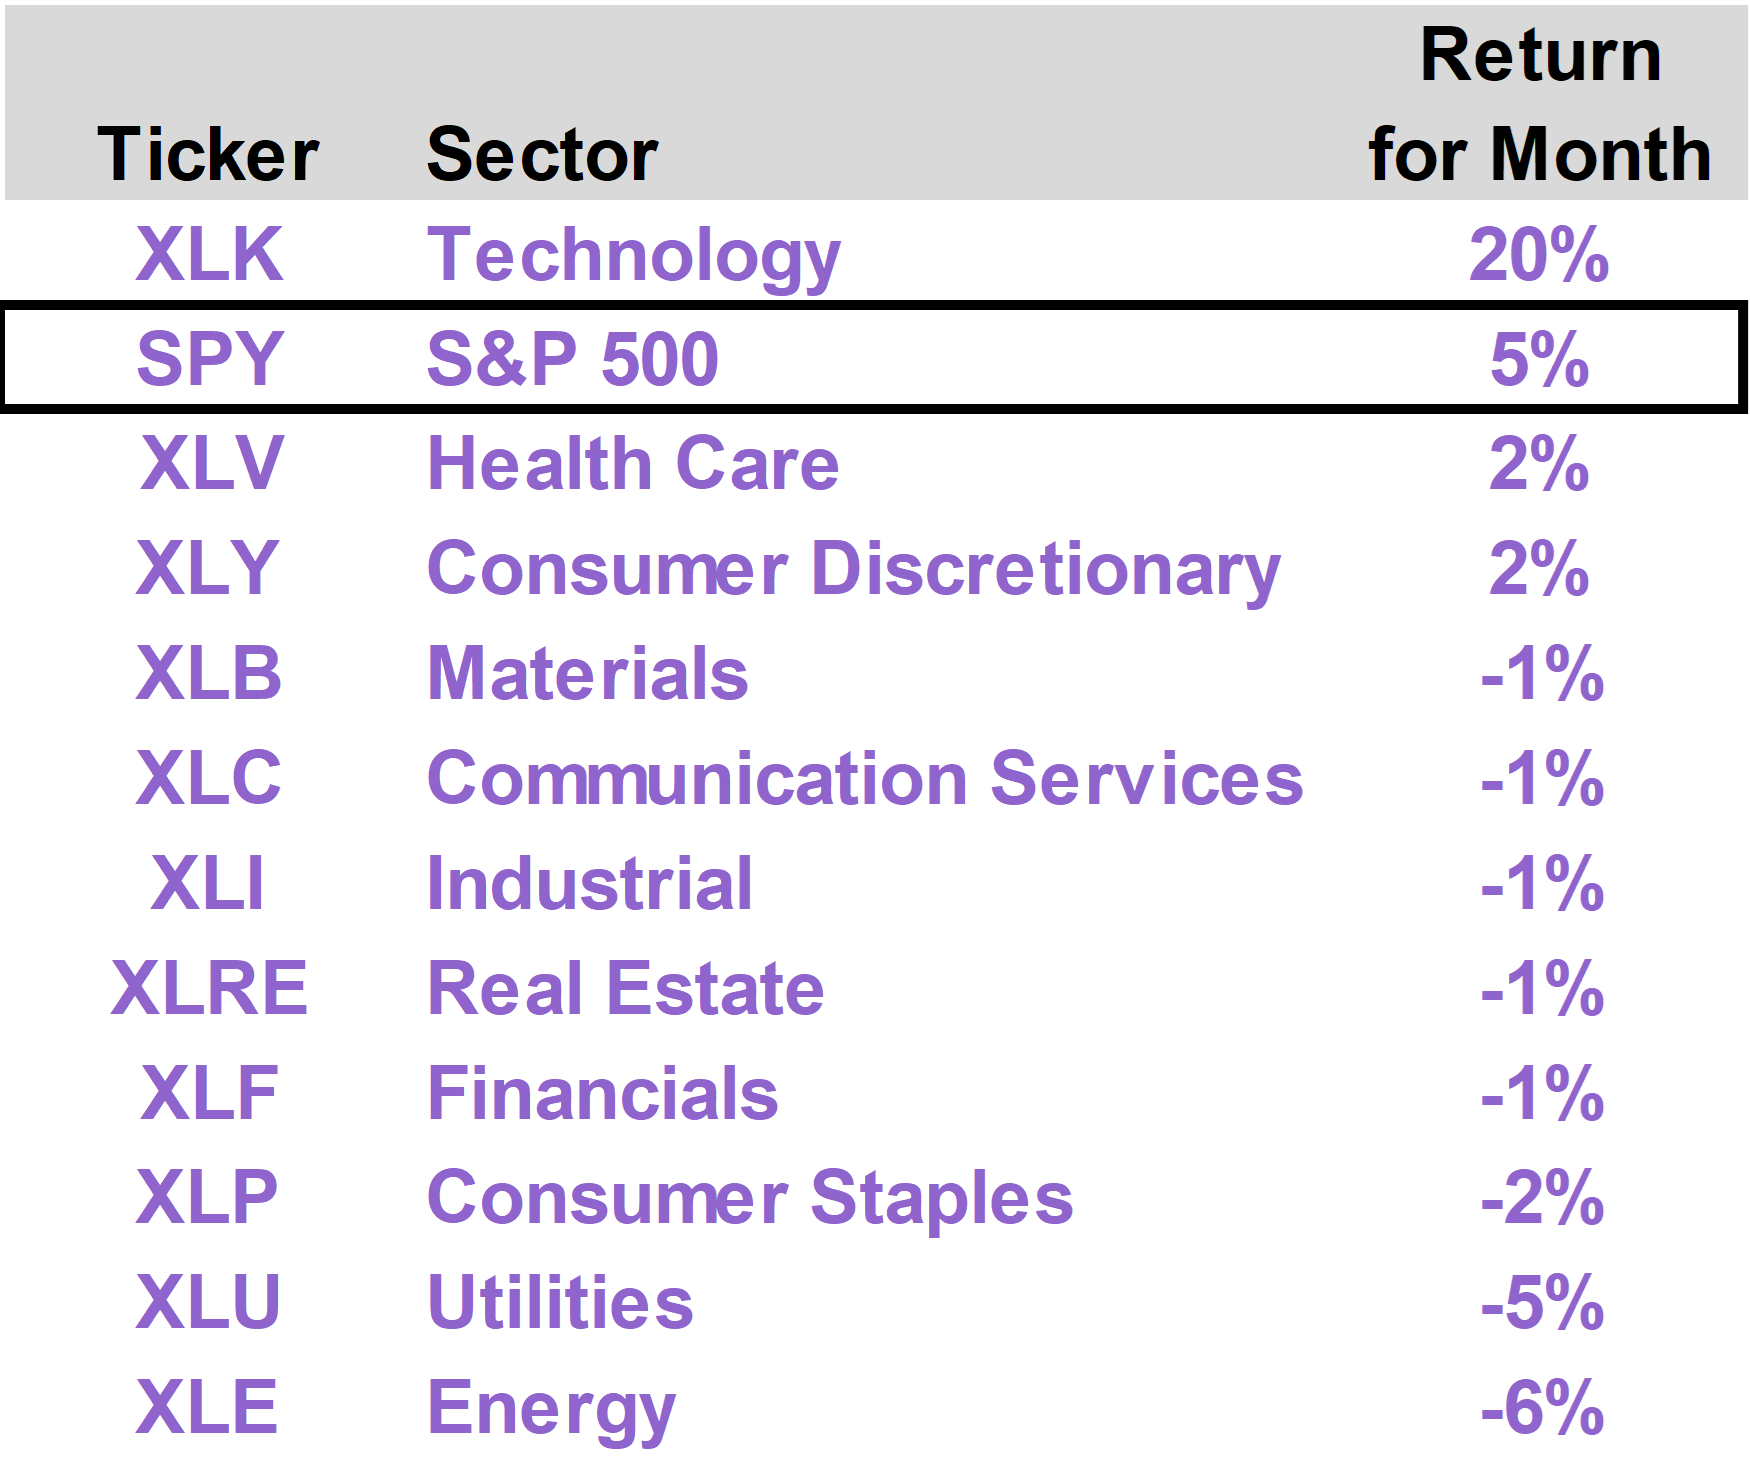
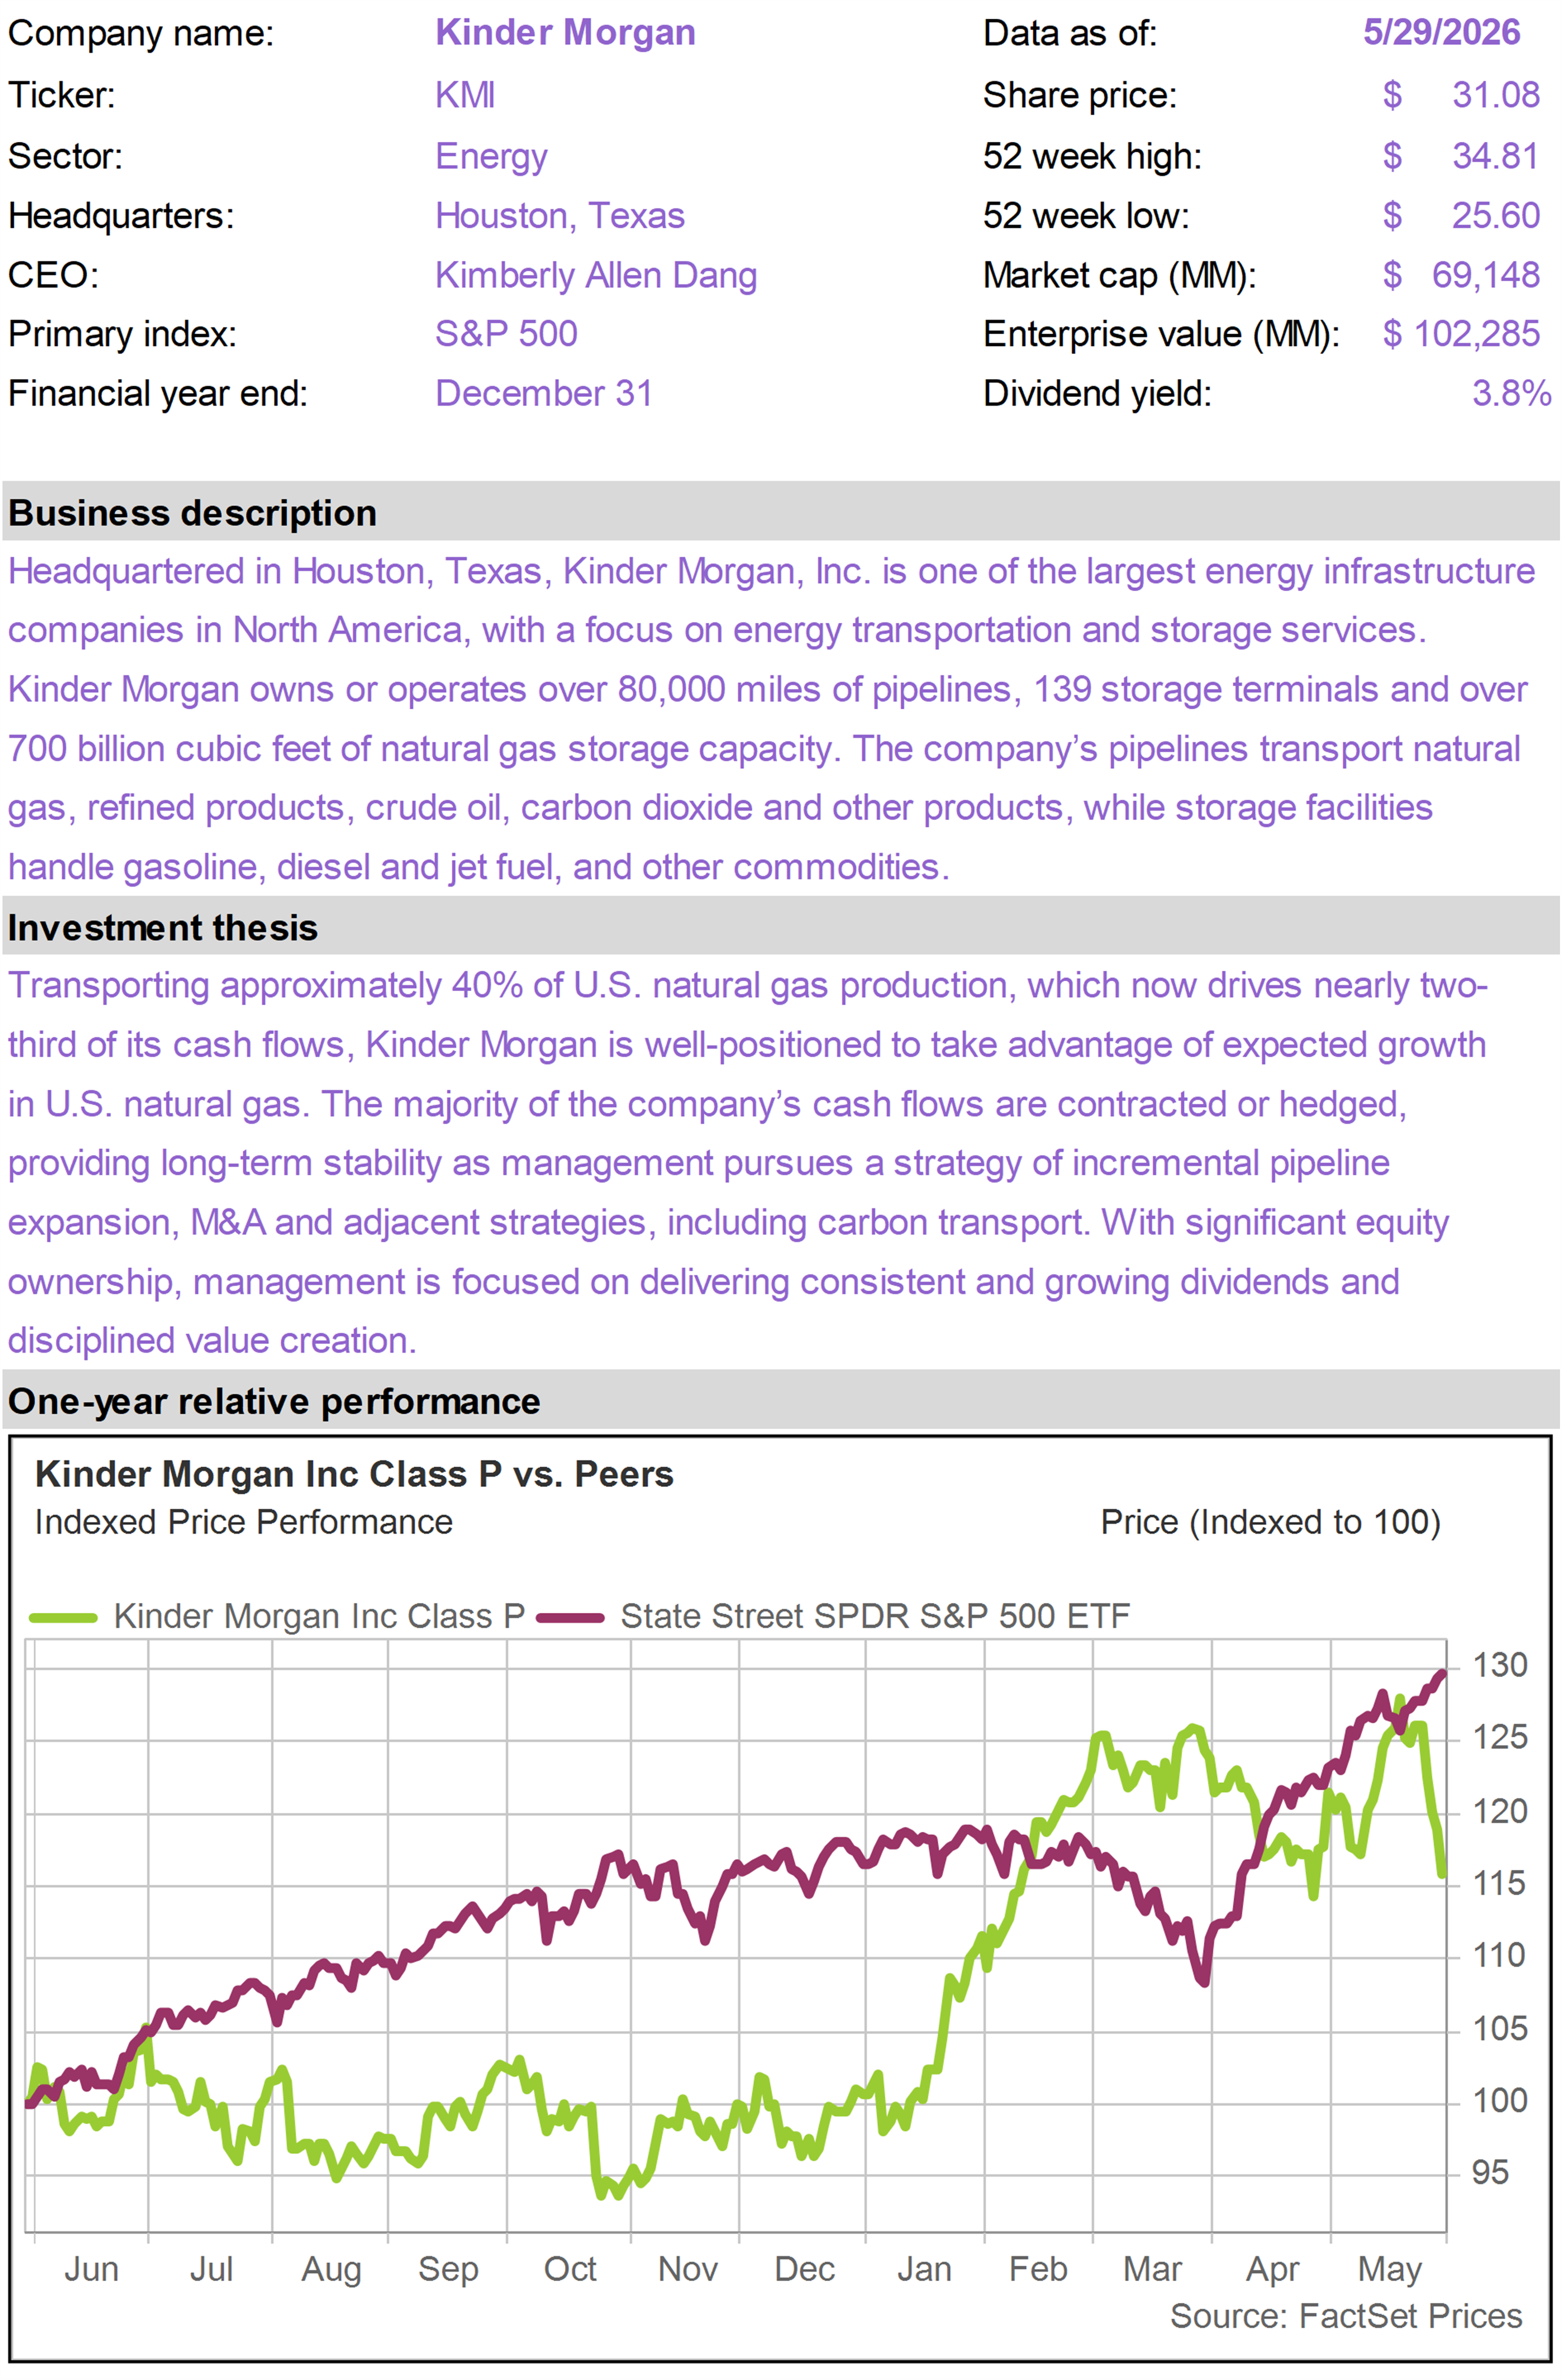
| | | Technology stocks dramatically outperformed in May, aided by a small group of AI plays that delivered exceptional earnings results. With Tech, by far the largest sector in the index, returning 20% this month, the S&P 500 generated a 5.3% return. By contrast, most other industry sectors generated negative performance as upward pressure on interest rates hurt sentiment. Energy was the worst performing sector as oil prices fell significantly toward the end of the month with diplomatic progress in Iran. The Income Builder portfolio returned -3.6% in May as energy and rate-sensitive real estate and utility holdings underperformed. On a year to date basis, the Income Builder has returned 12.8%, outpacing the 11.3% return of the S&P 500. As the conflict in Iran gets settled, lower oil prices have the potential to send a disinflationary pulse through the economy, setting the stage for the Fed’s return under Kevin Warsh to a rate-cutting bias.
|
|
| | |
The Income Builder portfolio generated a total return of -3.6% in May, versus the S&P 500 Index return of 5.3%. On a year to date basis through the end of the month, the portfolio has returned 12.8%, outpacing the 11.3% return of the S&P 500.
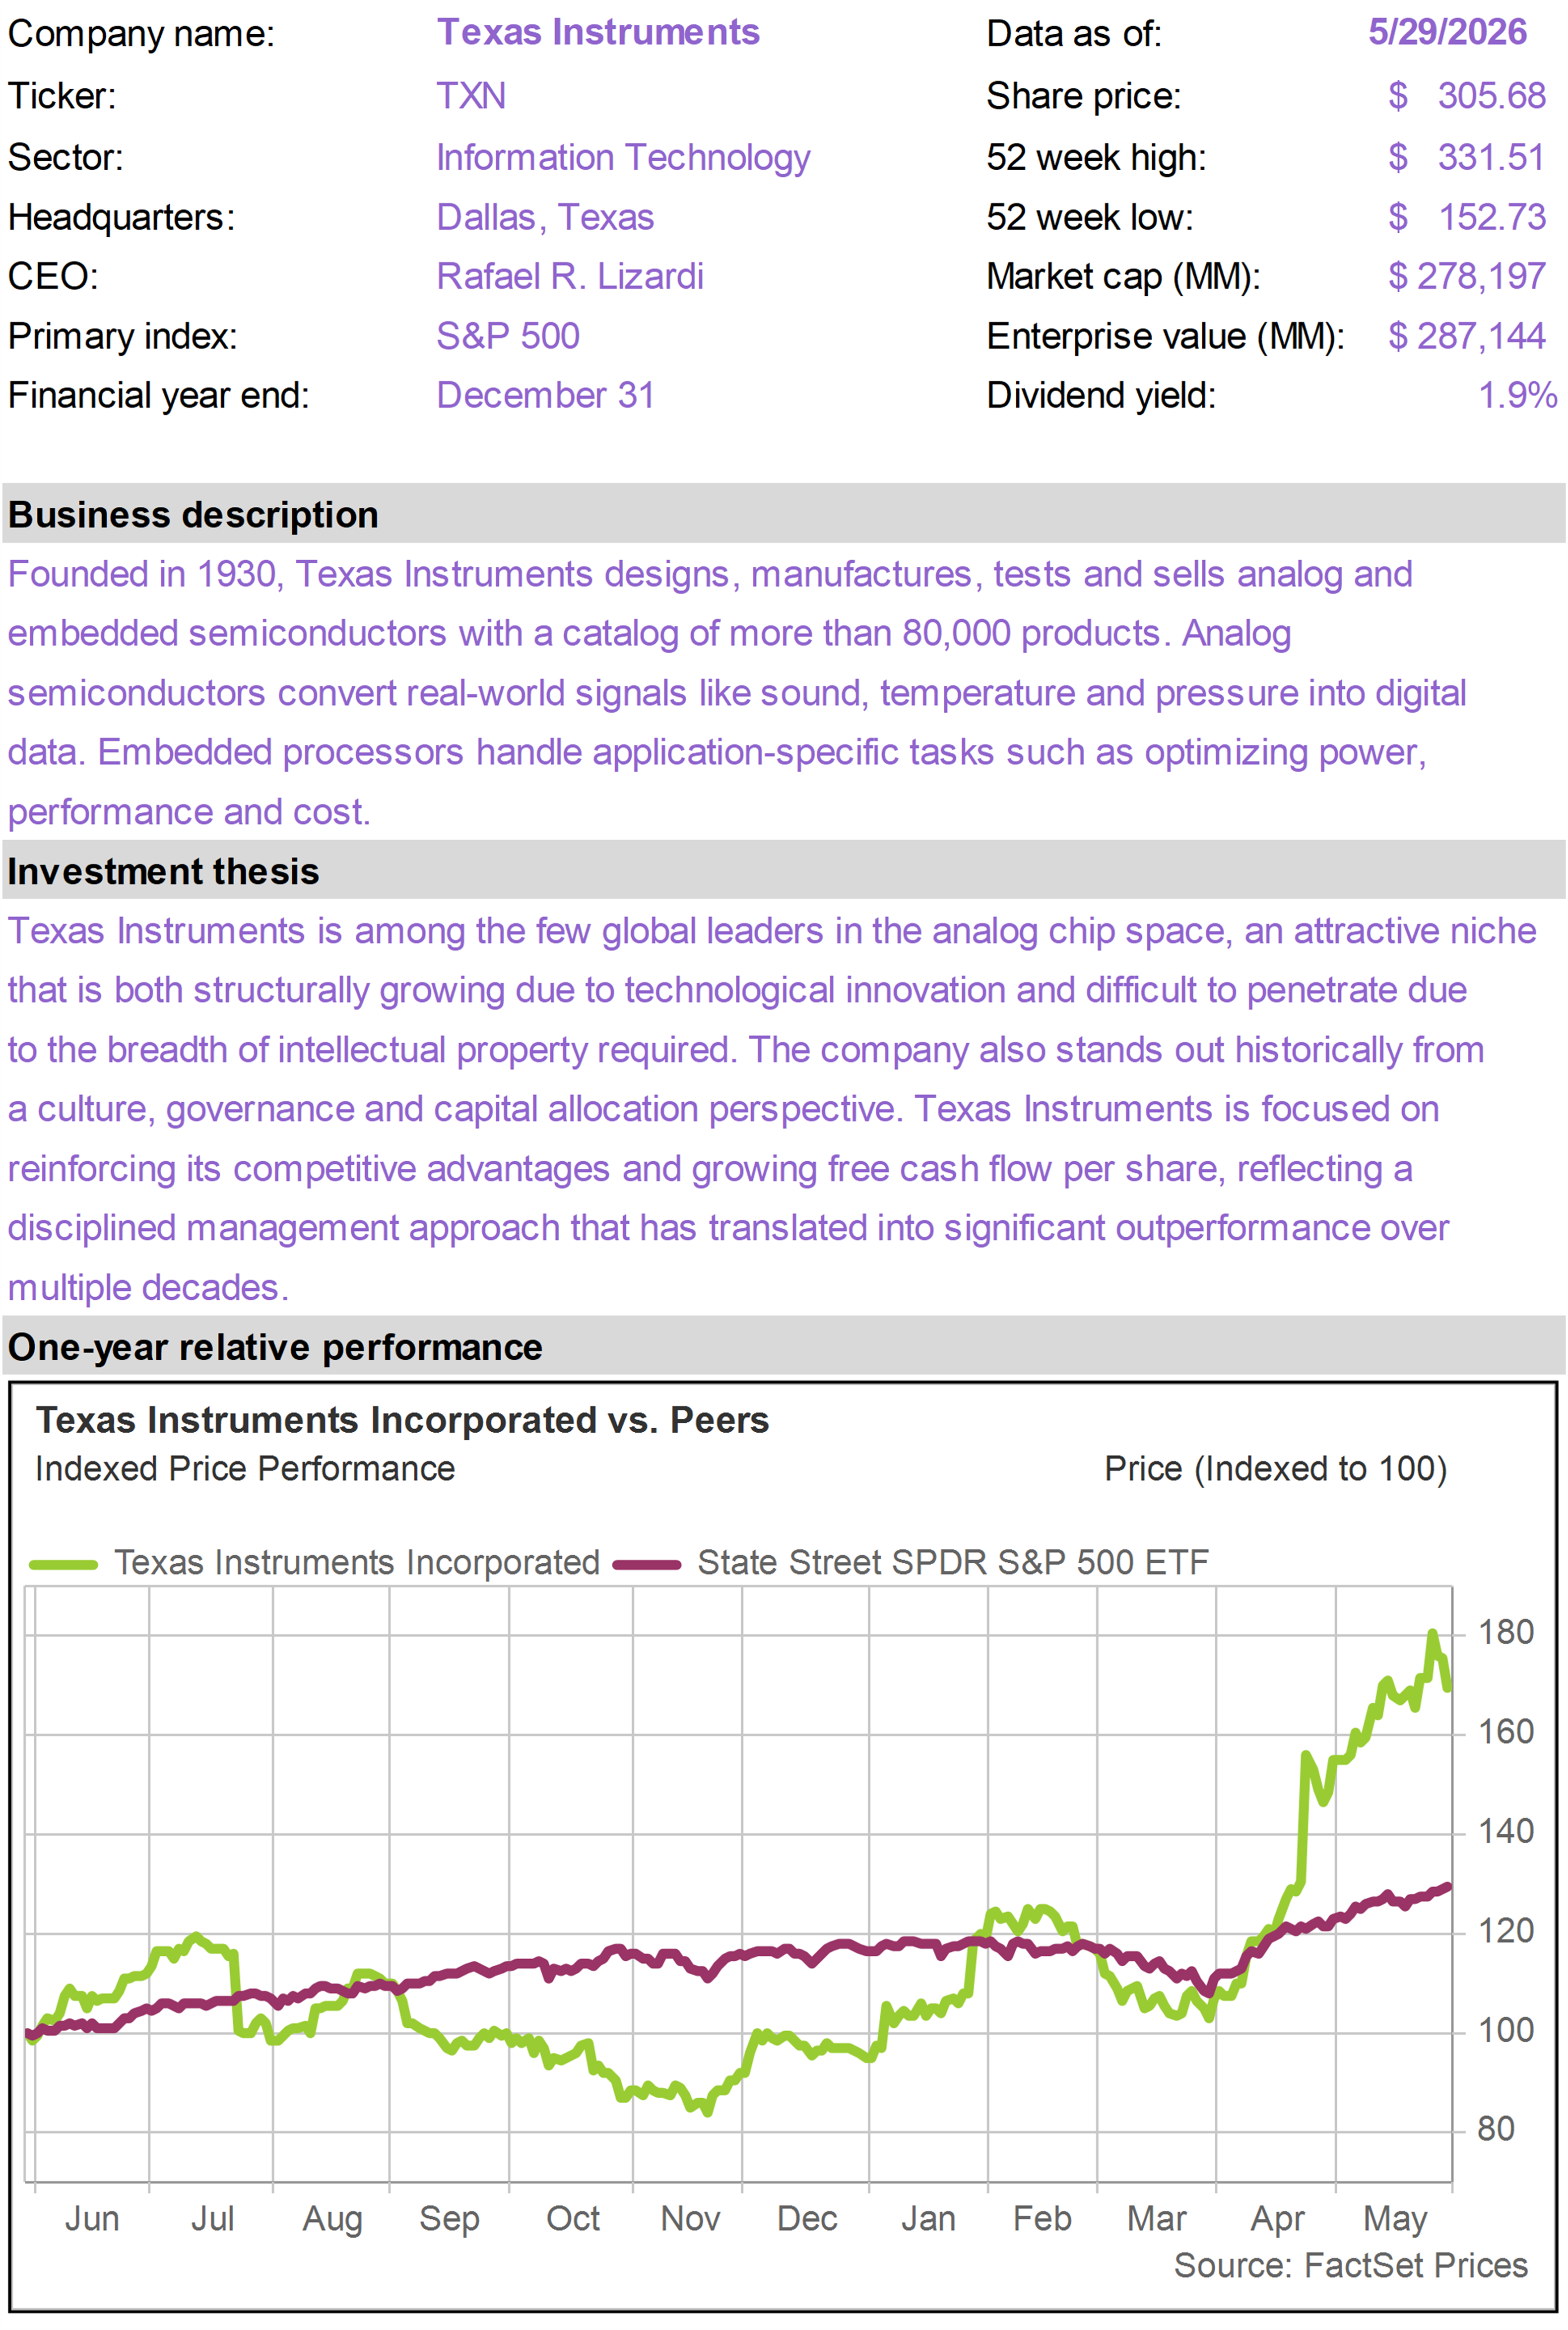
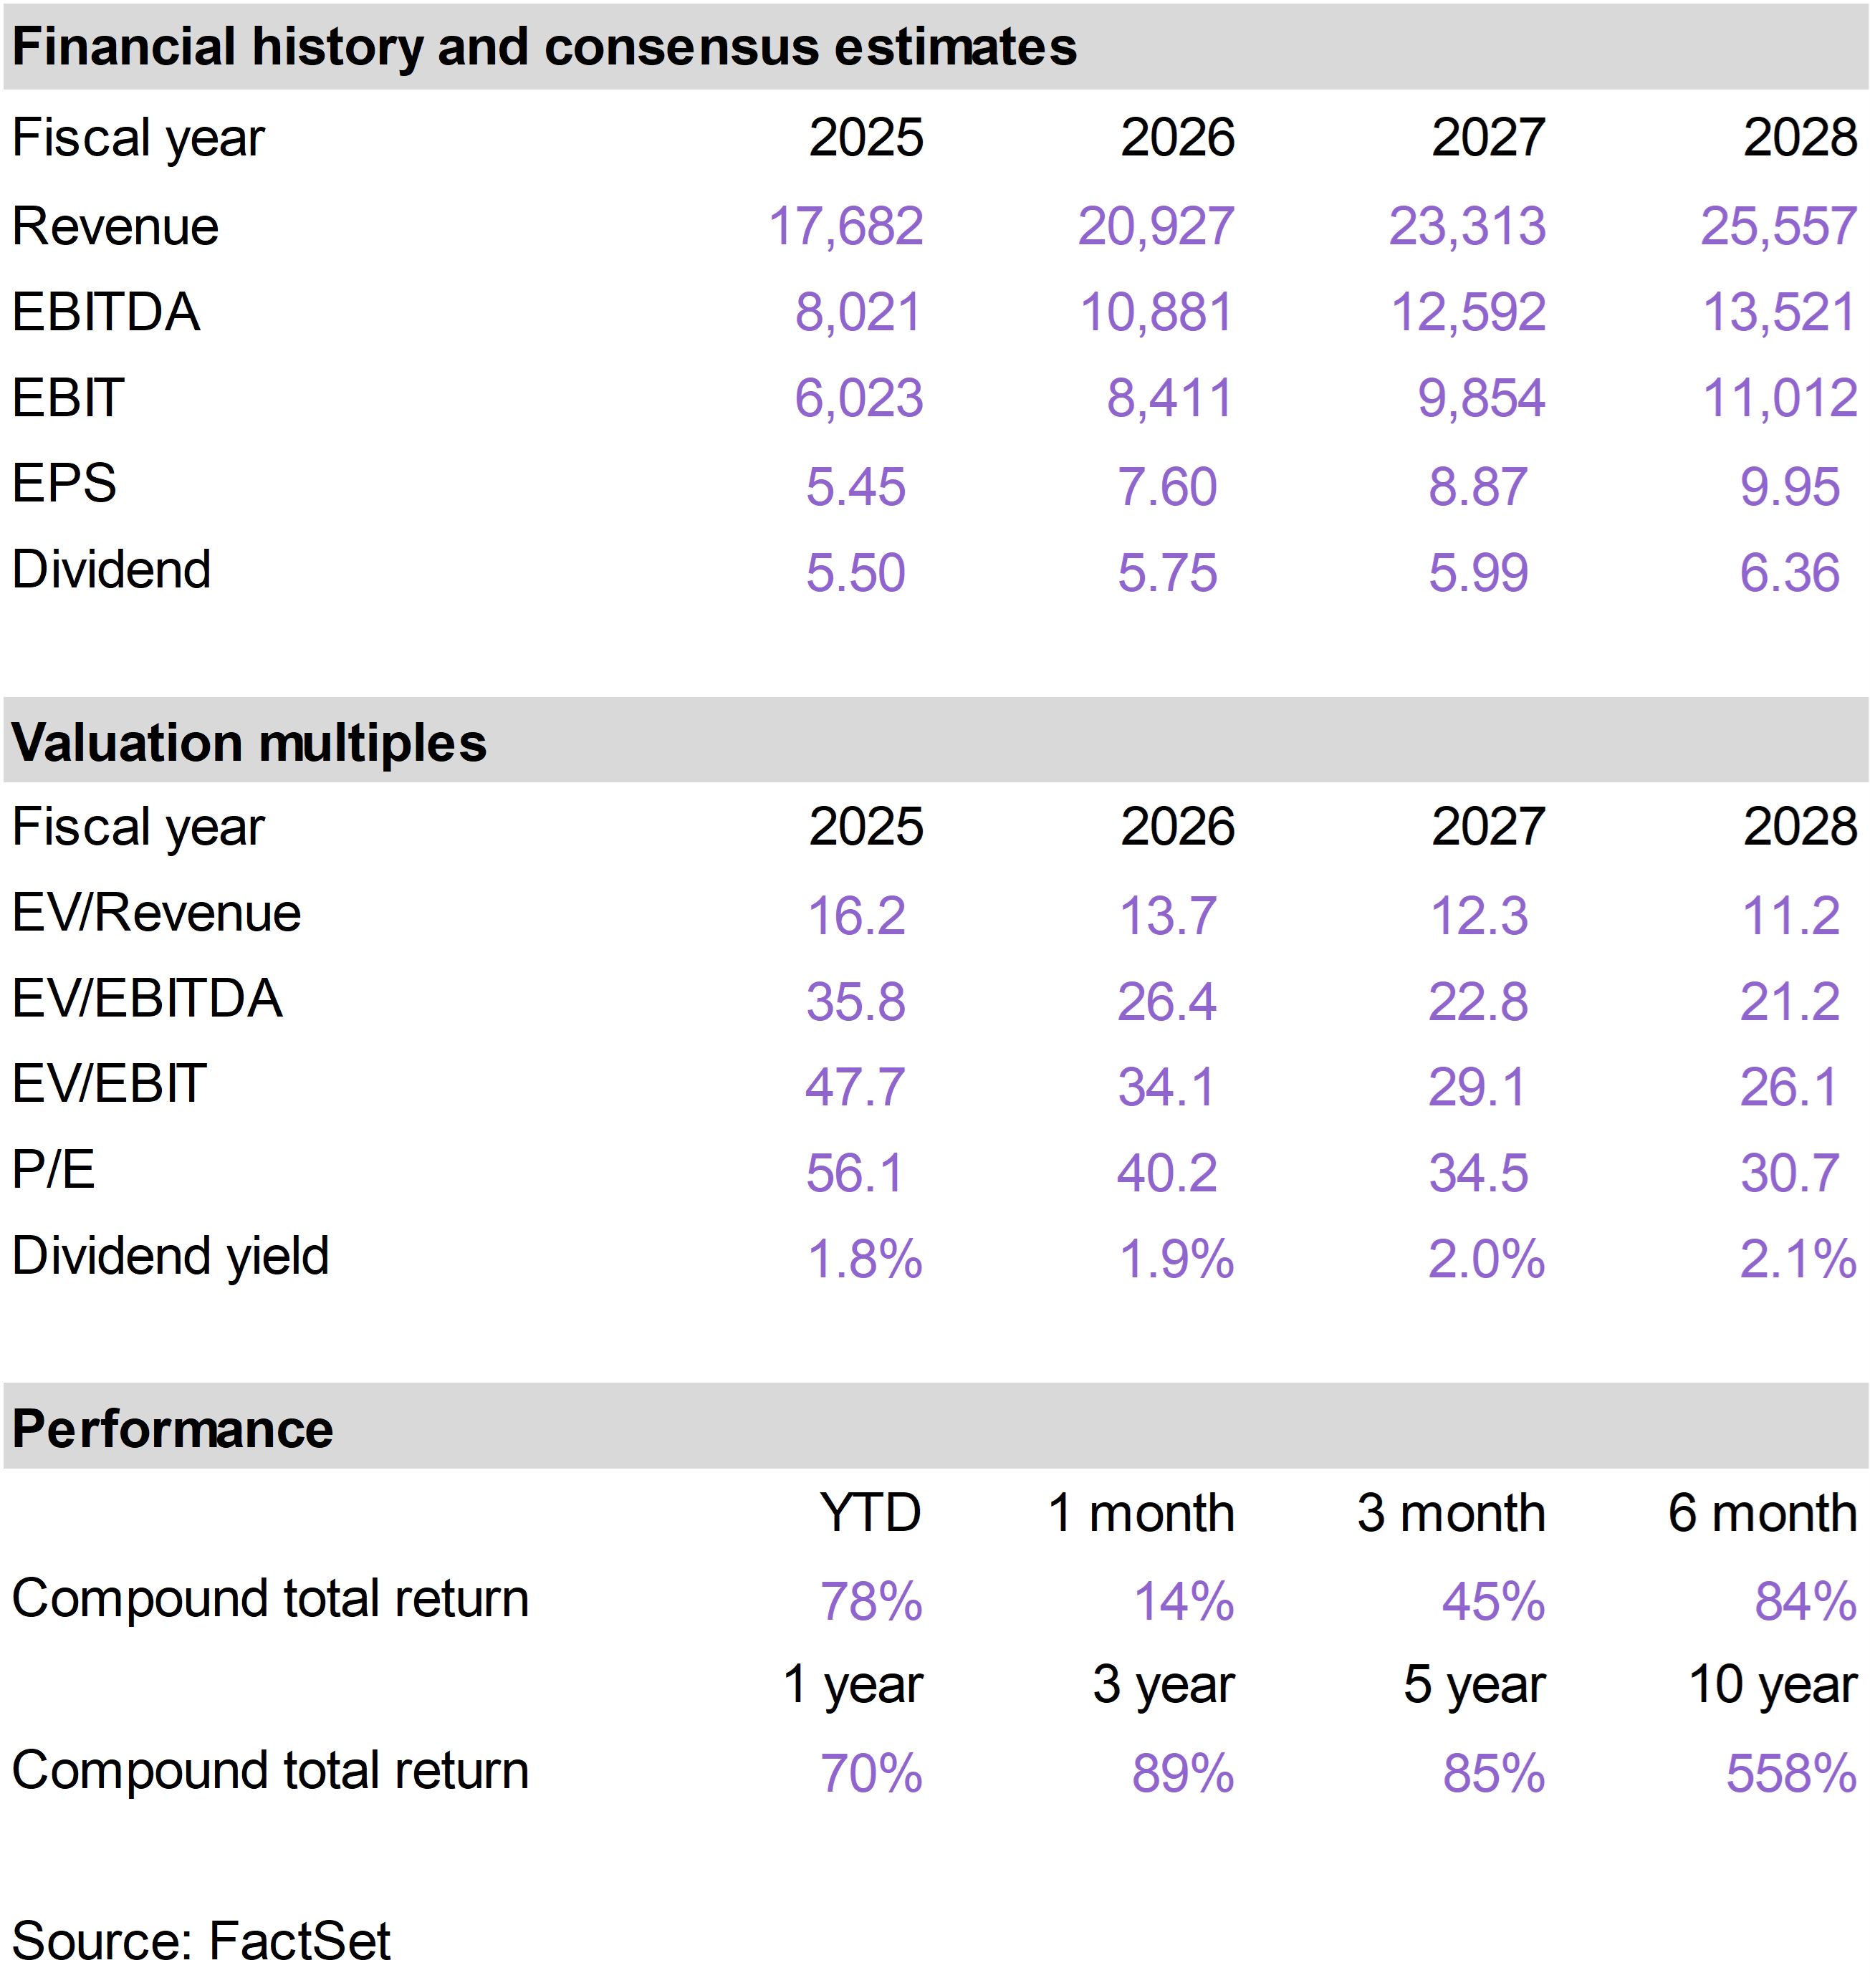
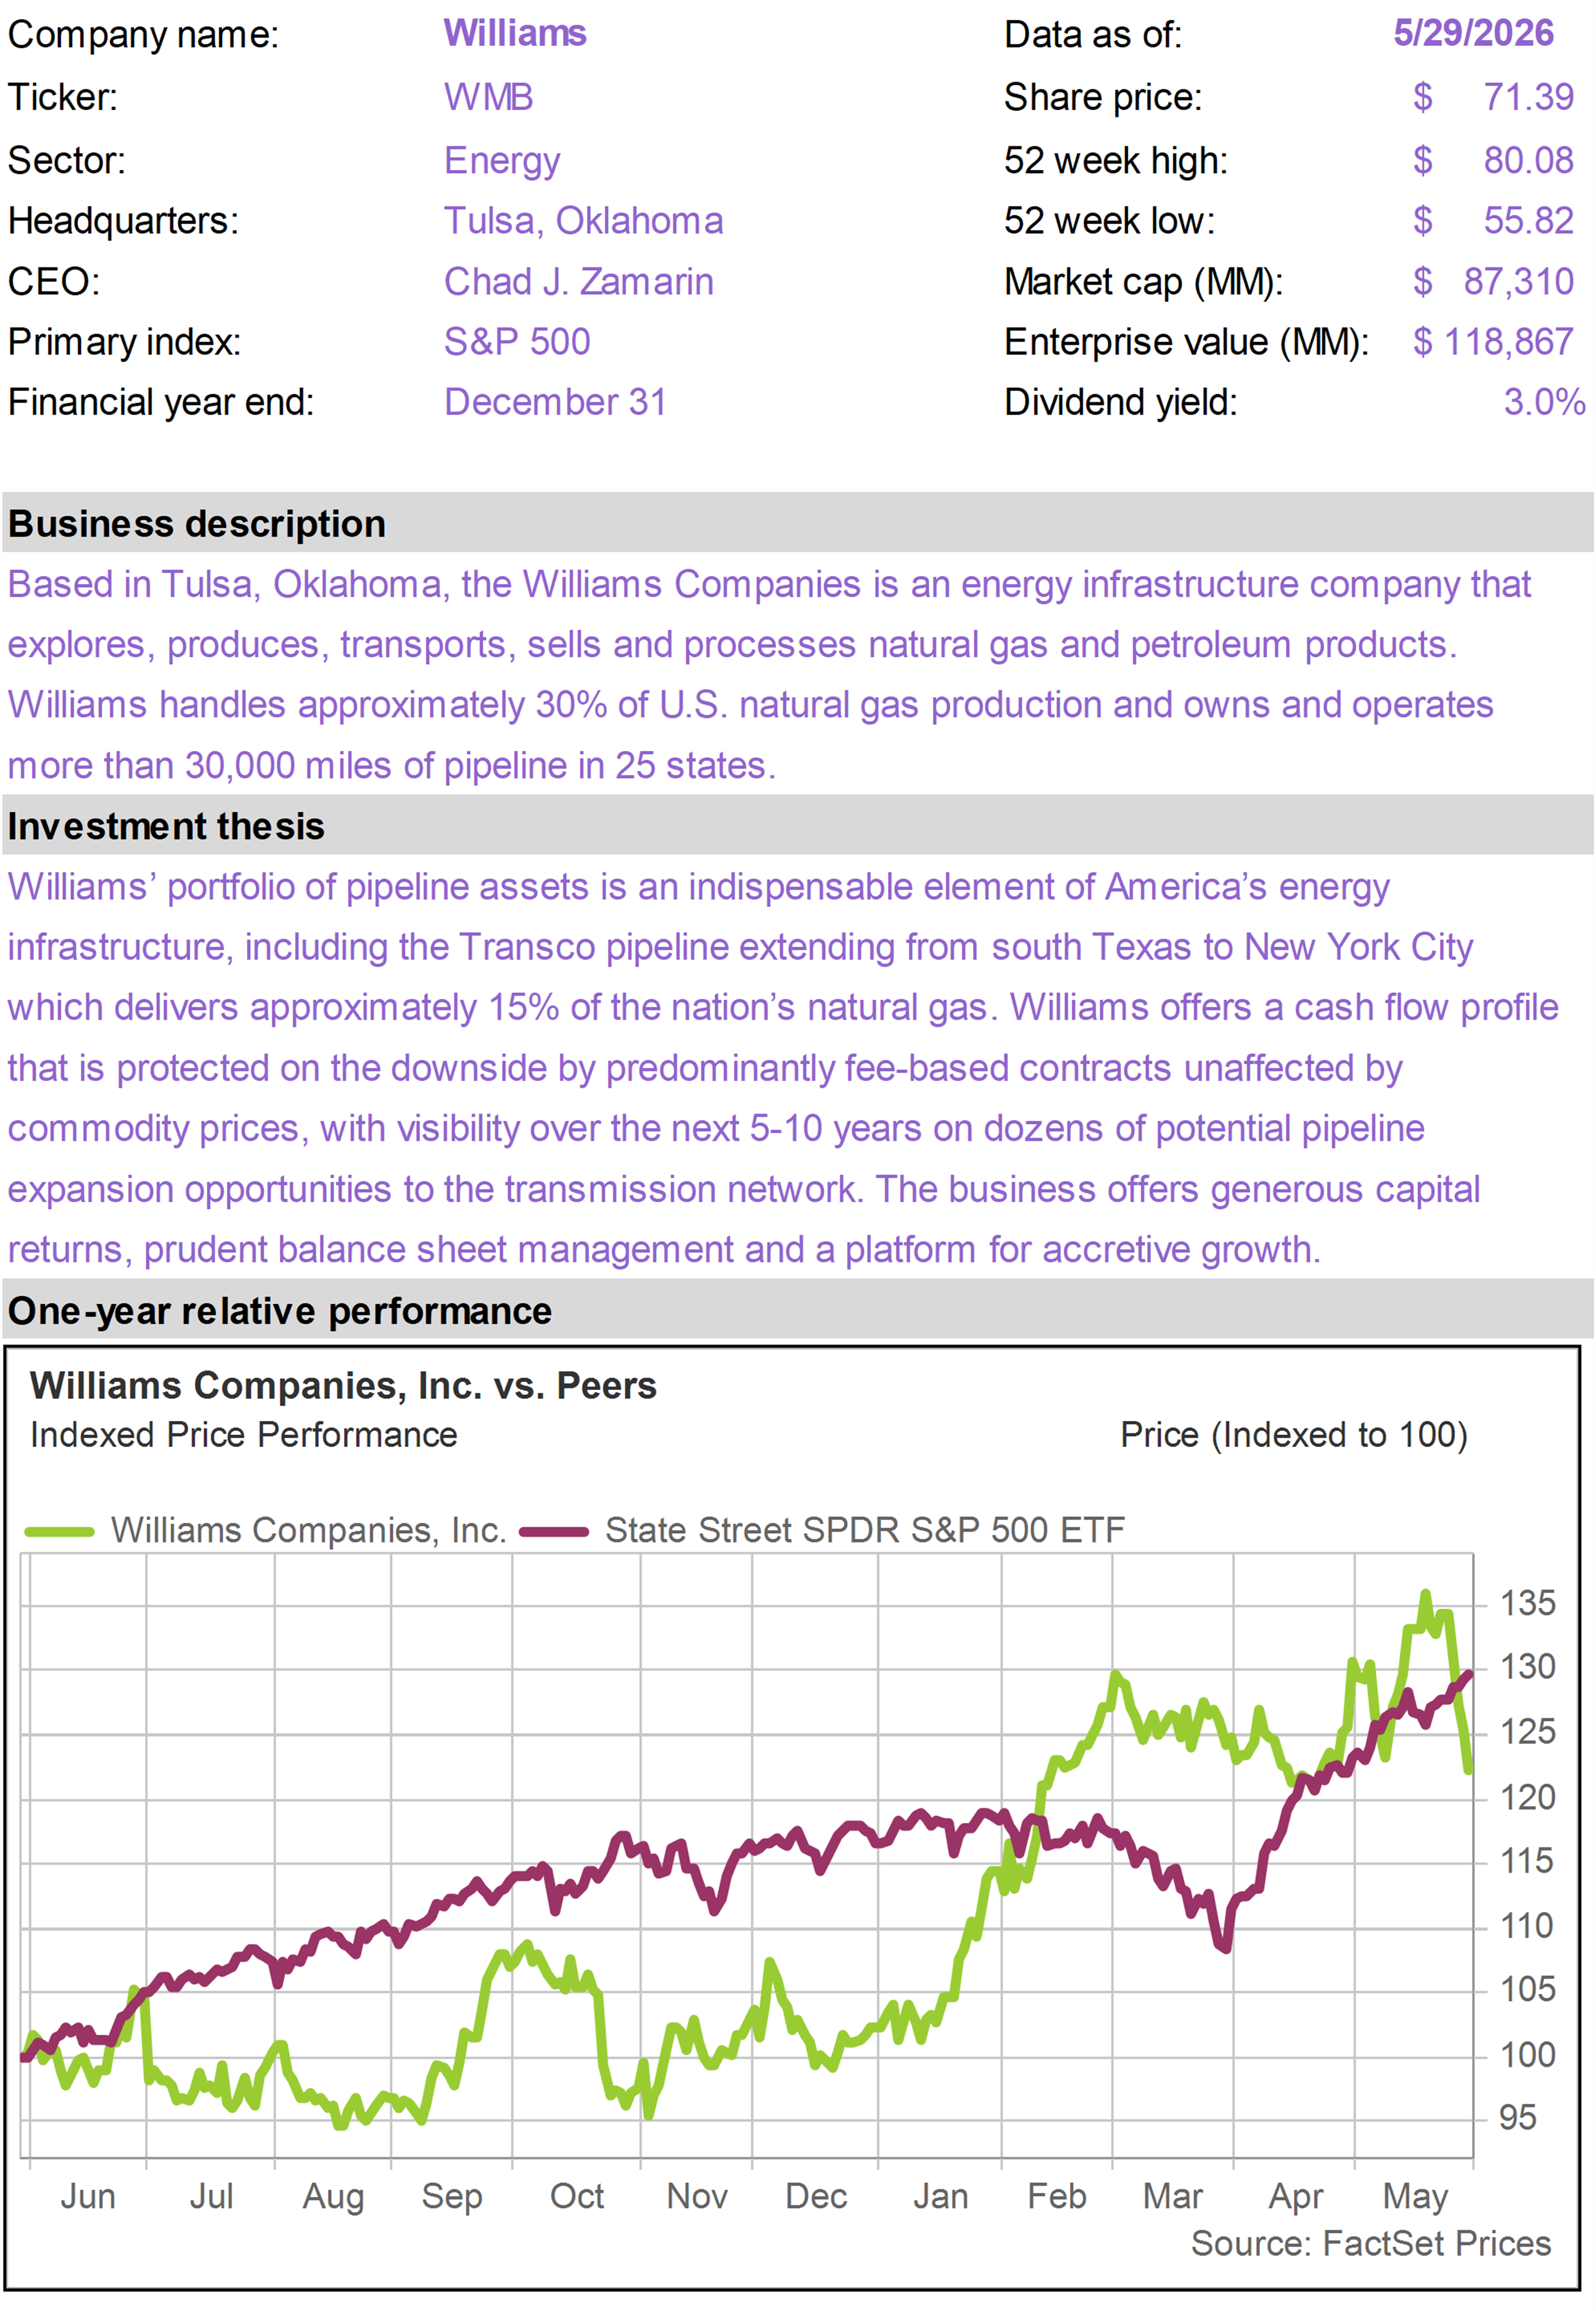
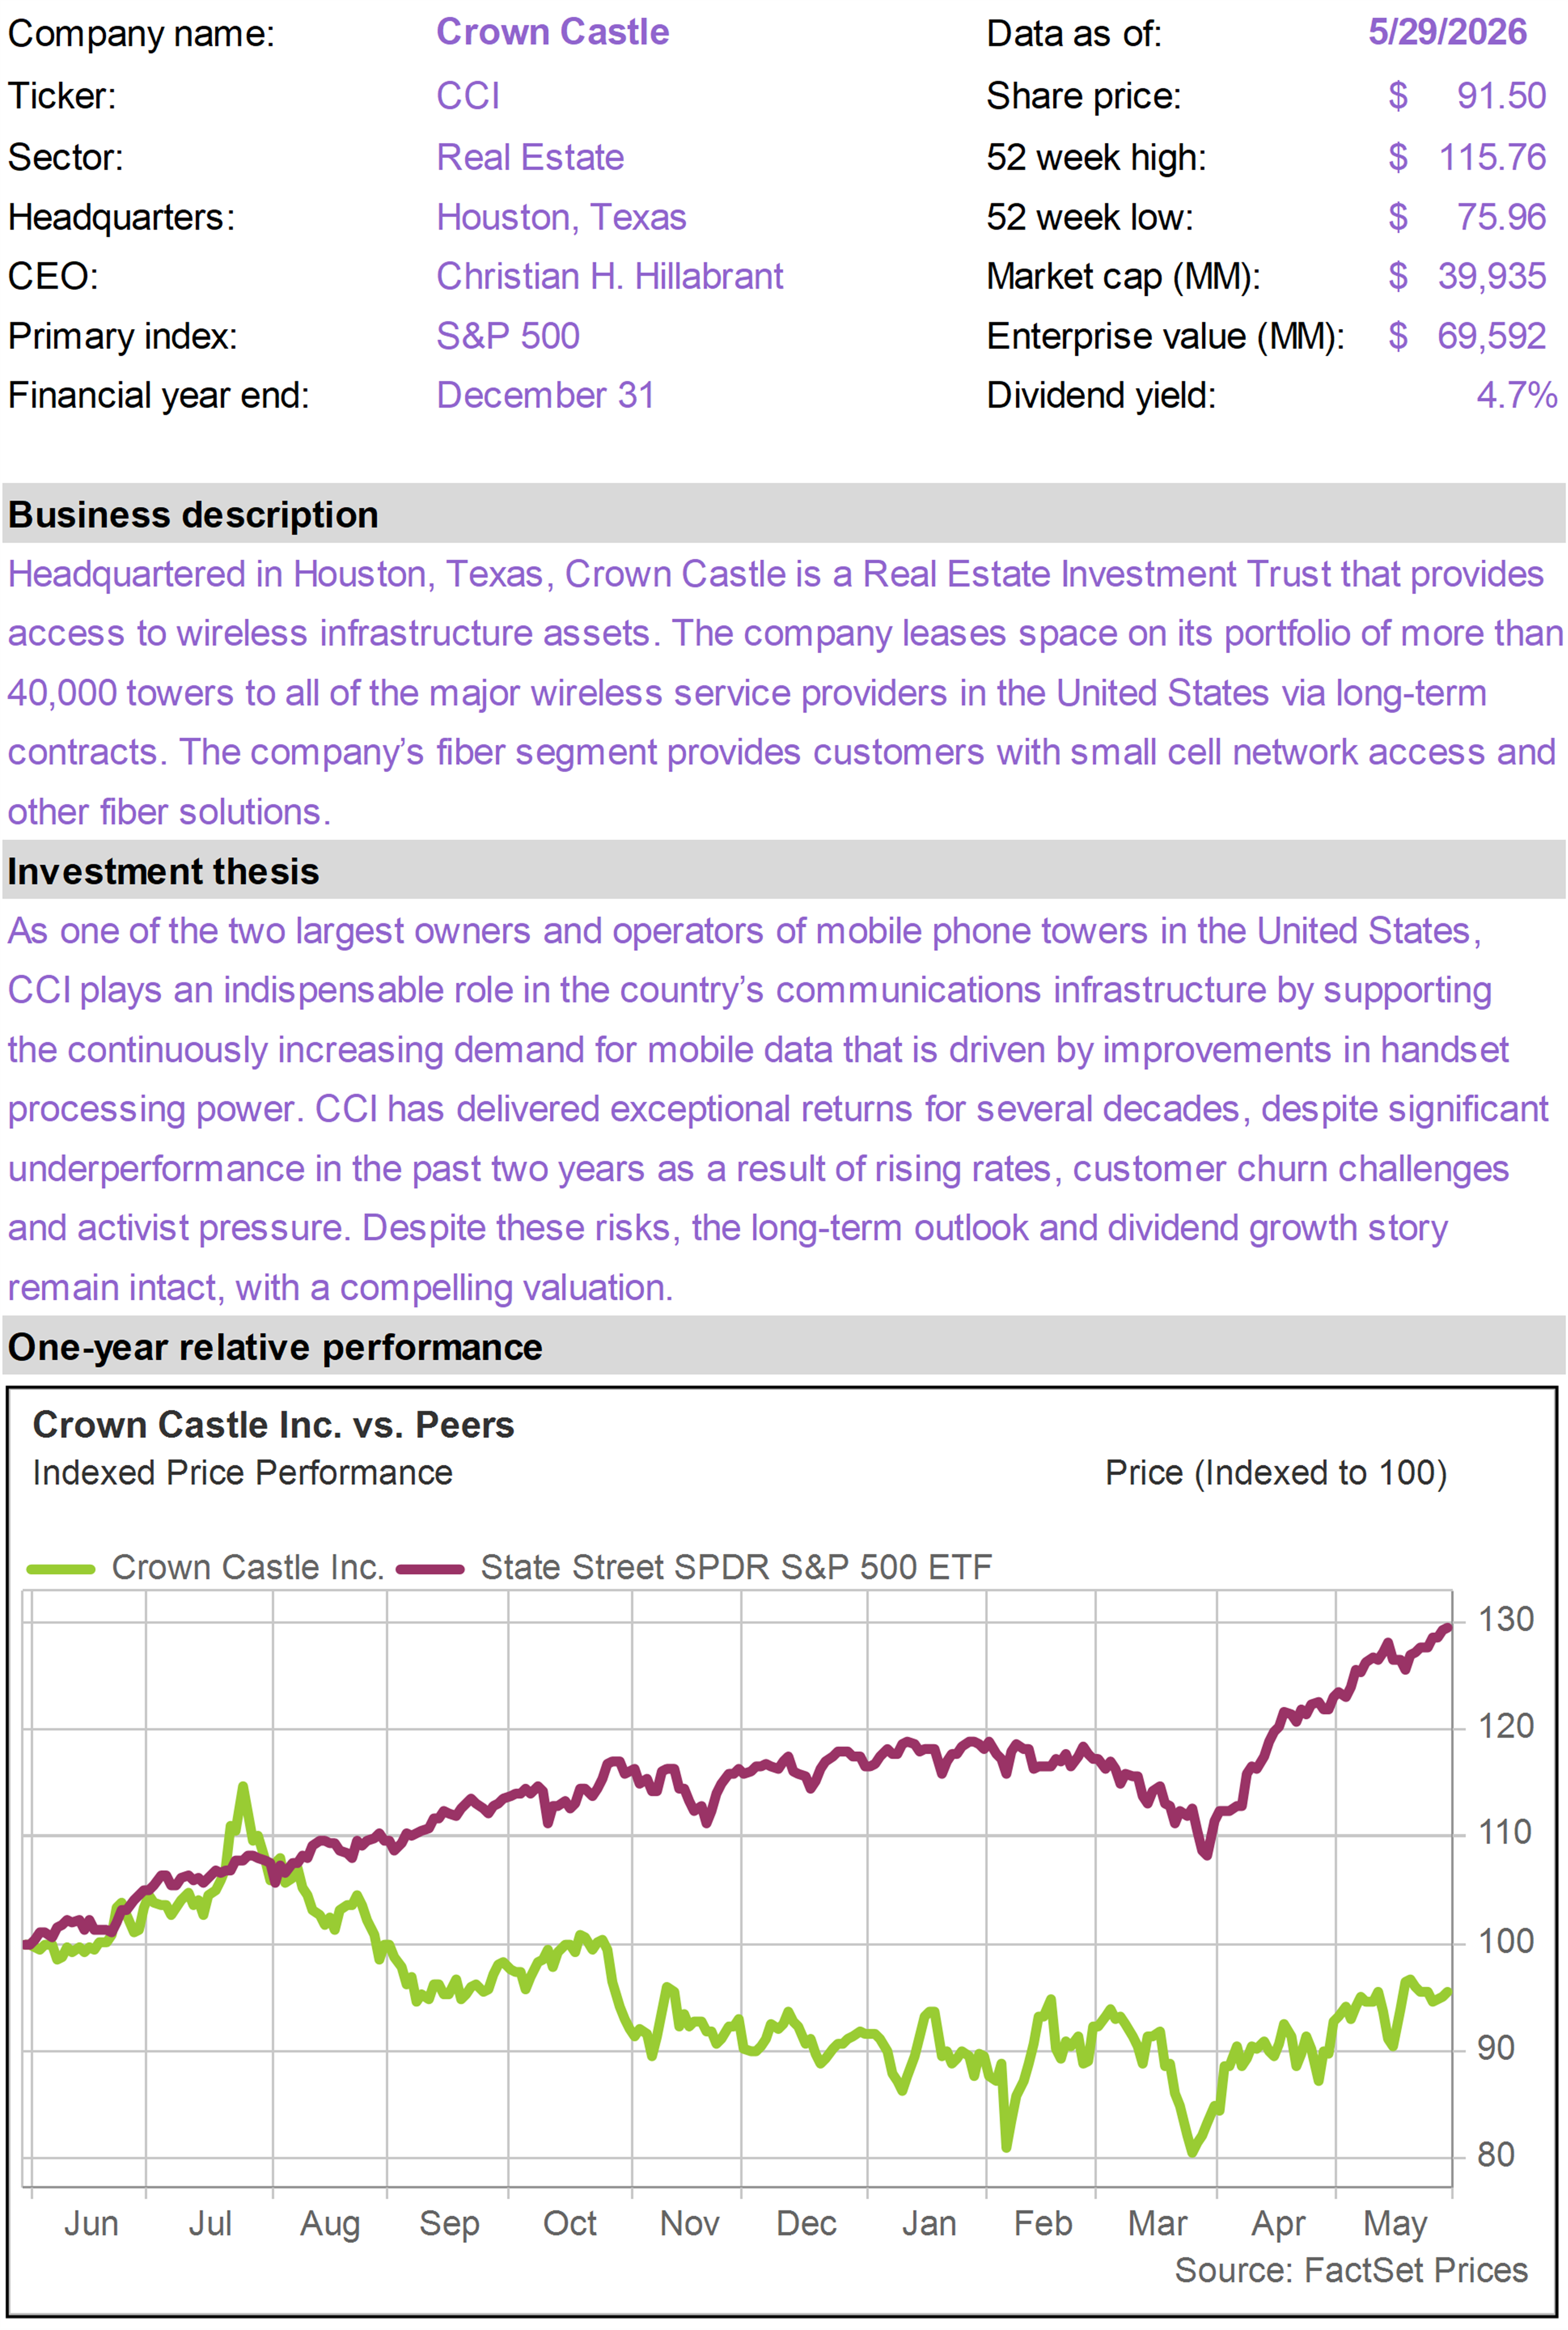
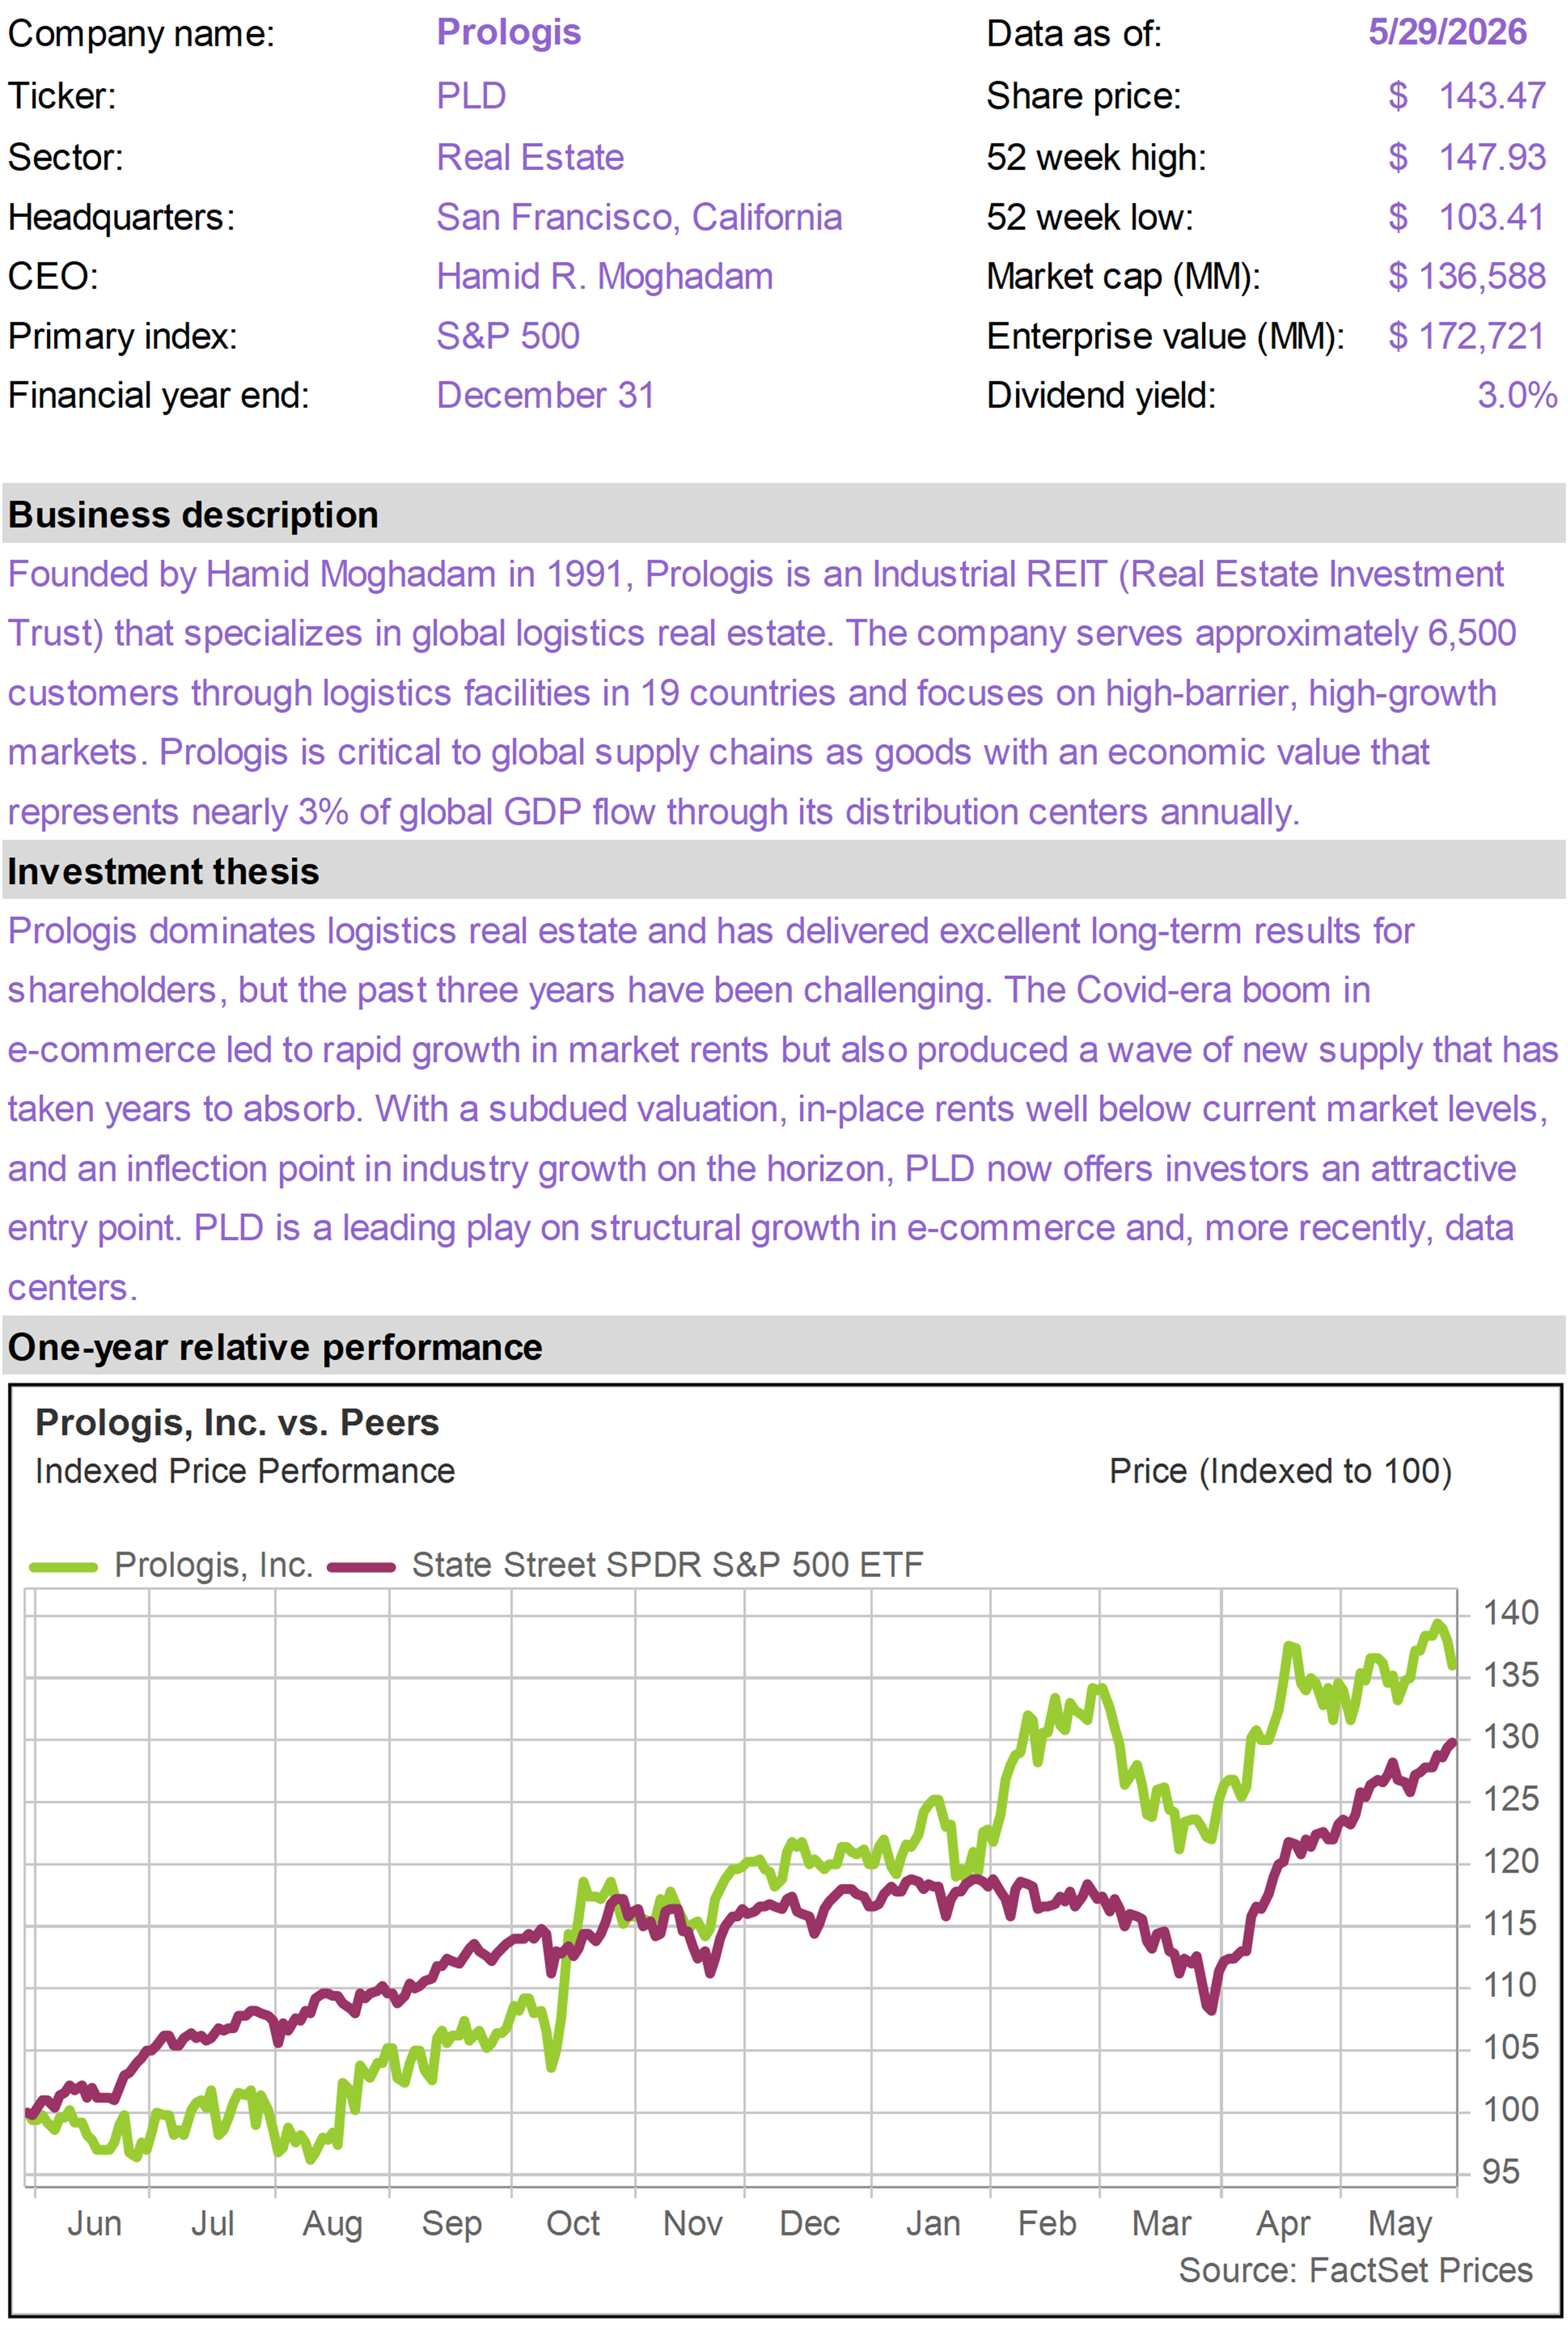
The top performing positions in the portfolio in May were Texas Instruments (TXN), which returned 9%; Crown Castle (CCI), which returned 3%; and Prologis (PLD), which returned 1%.
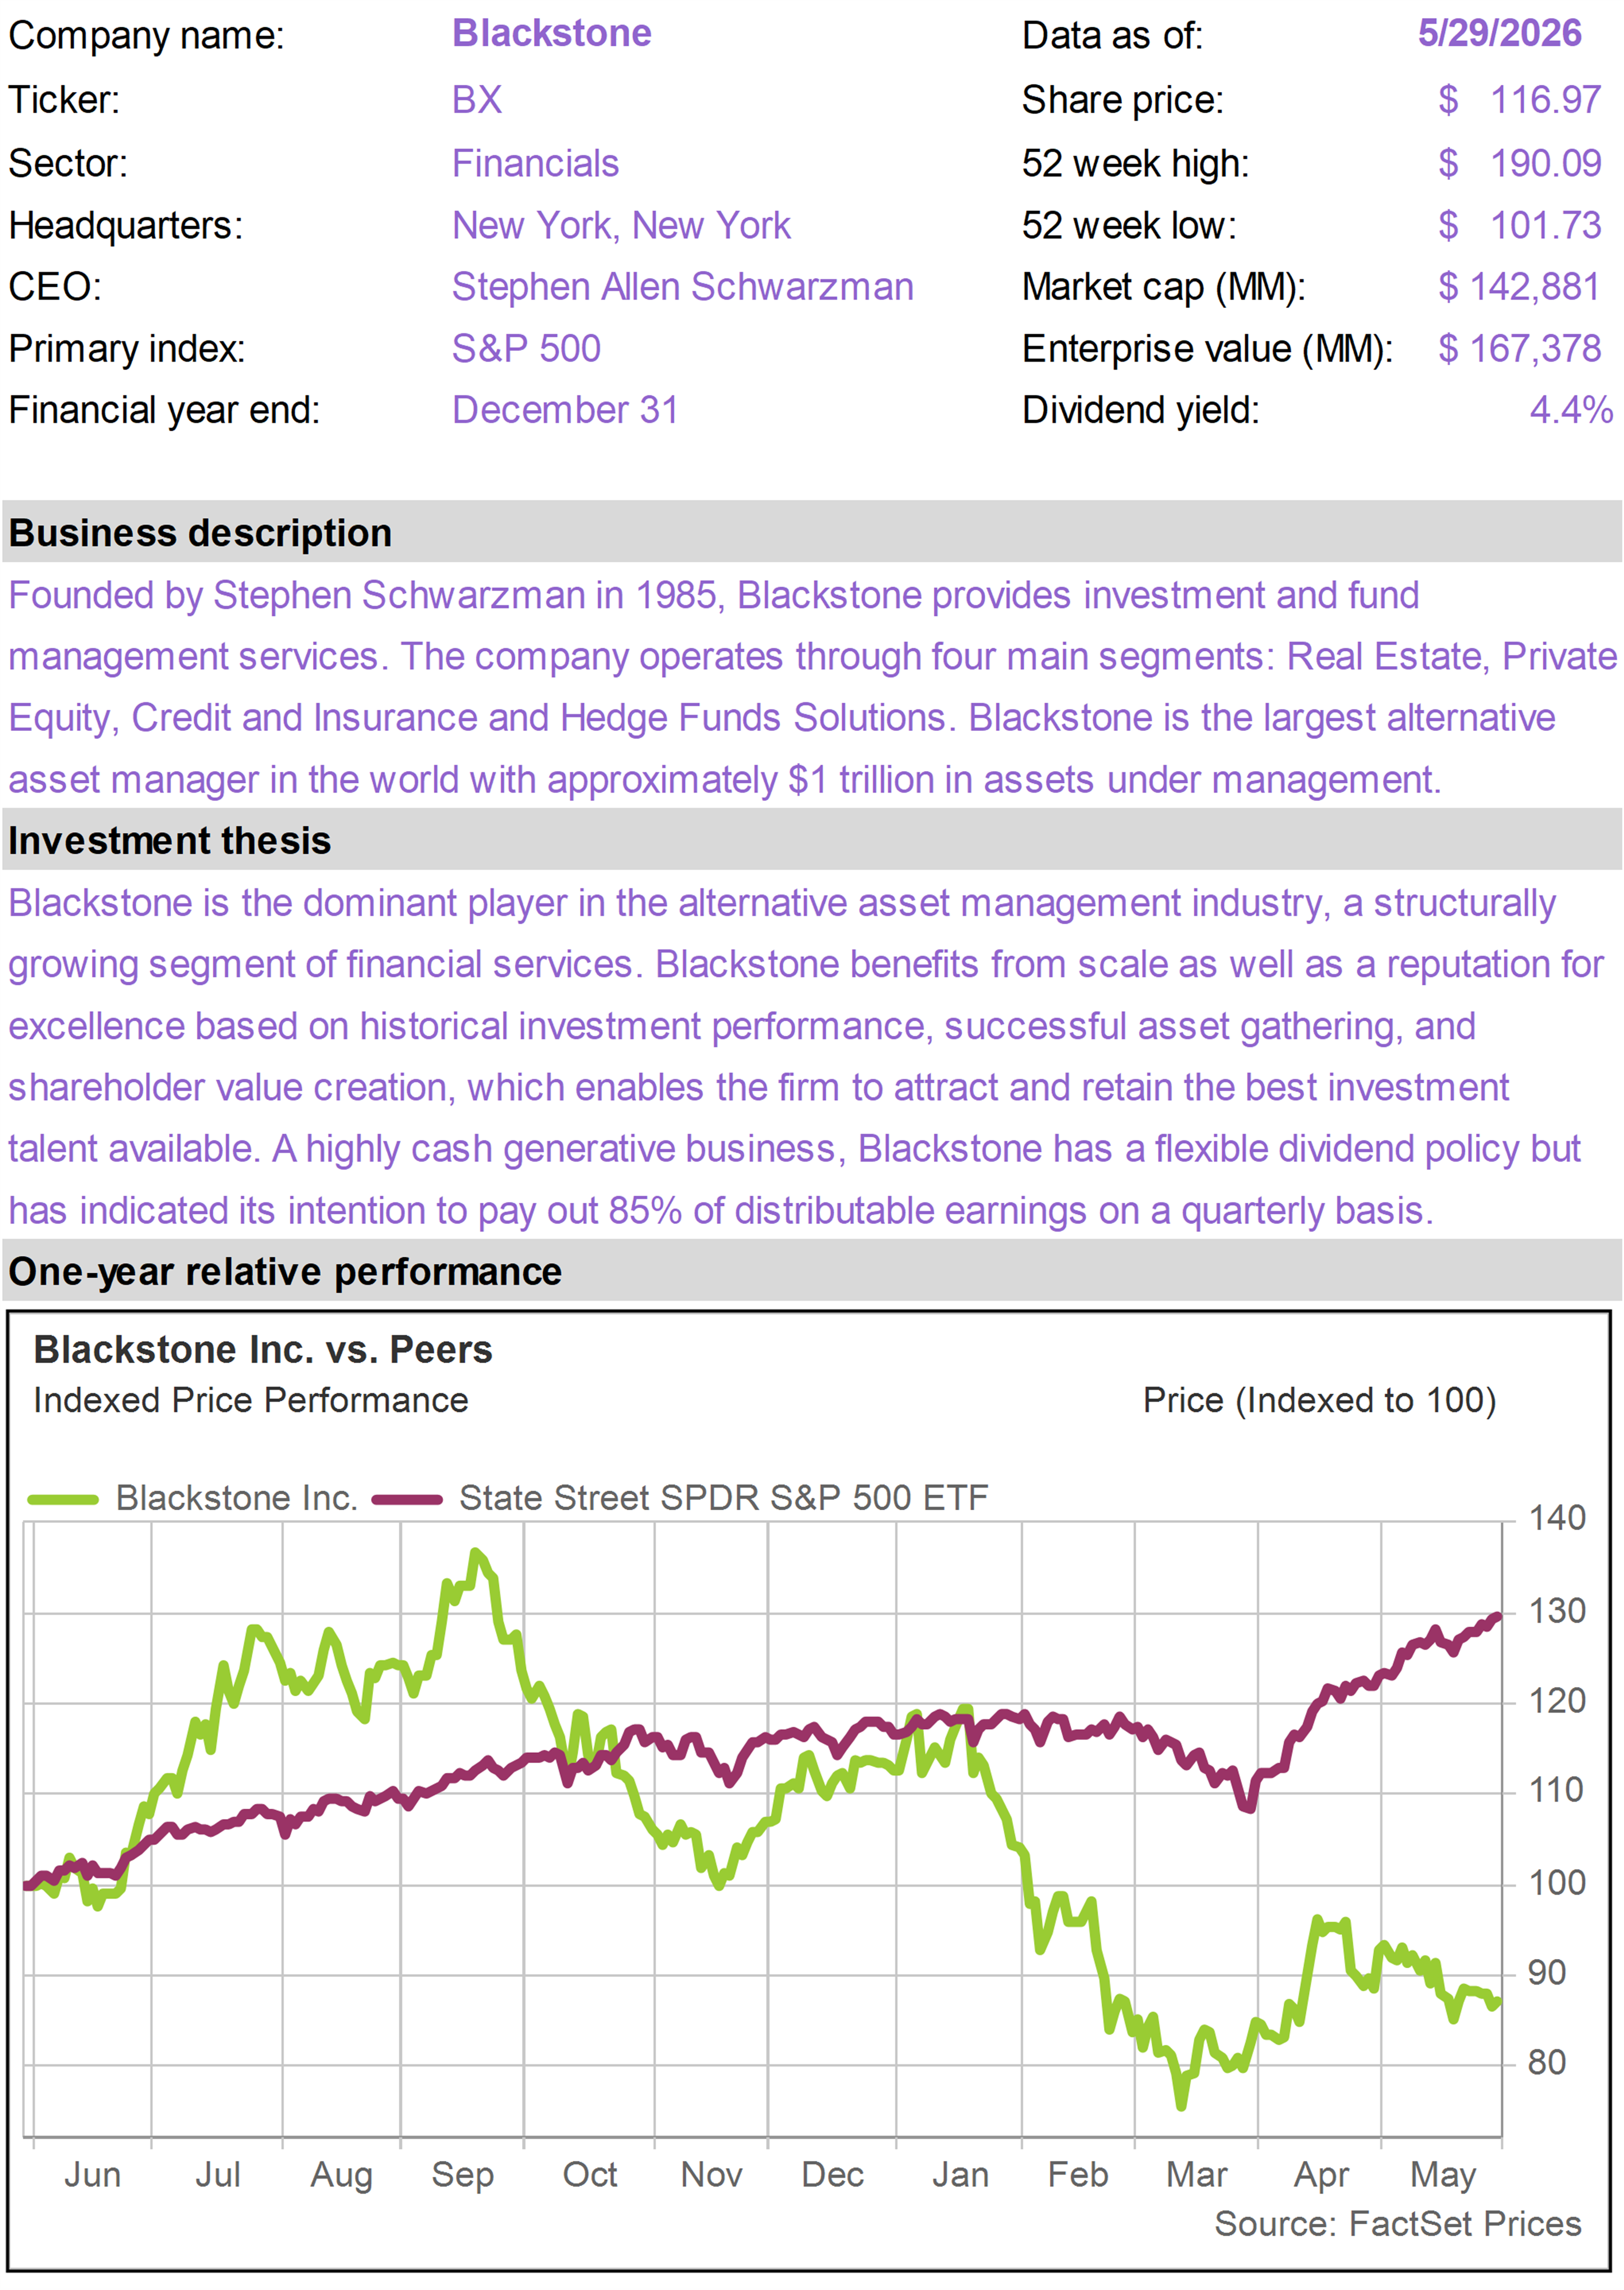
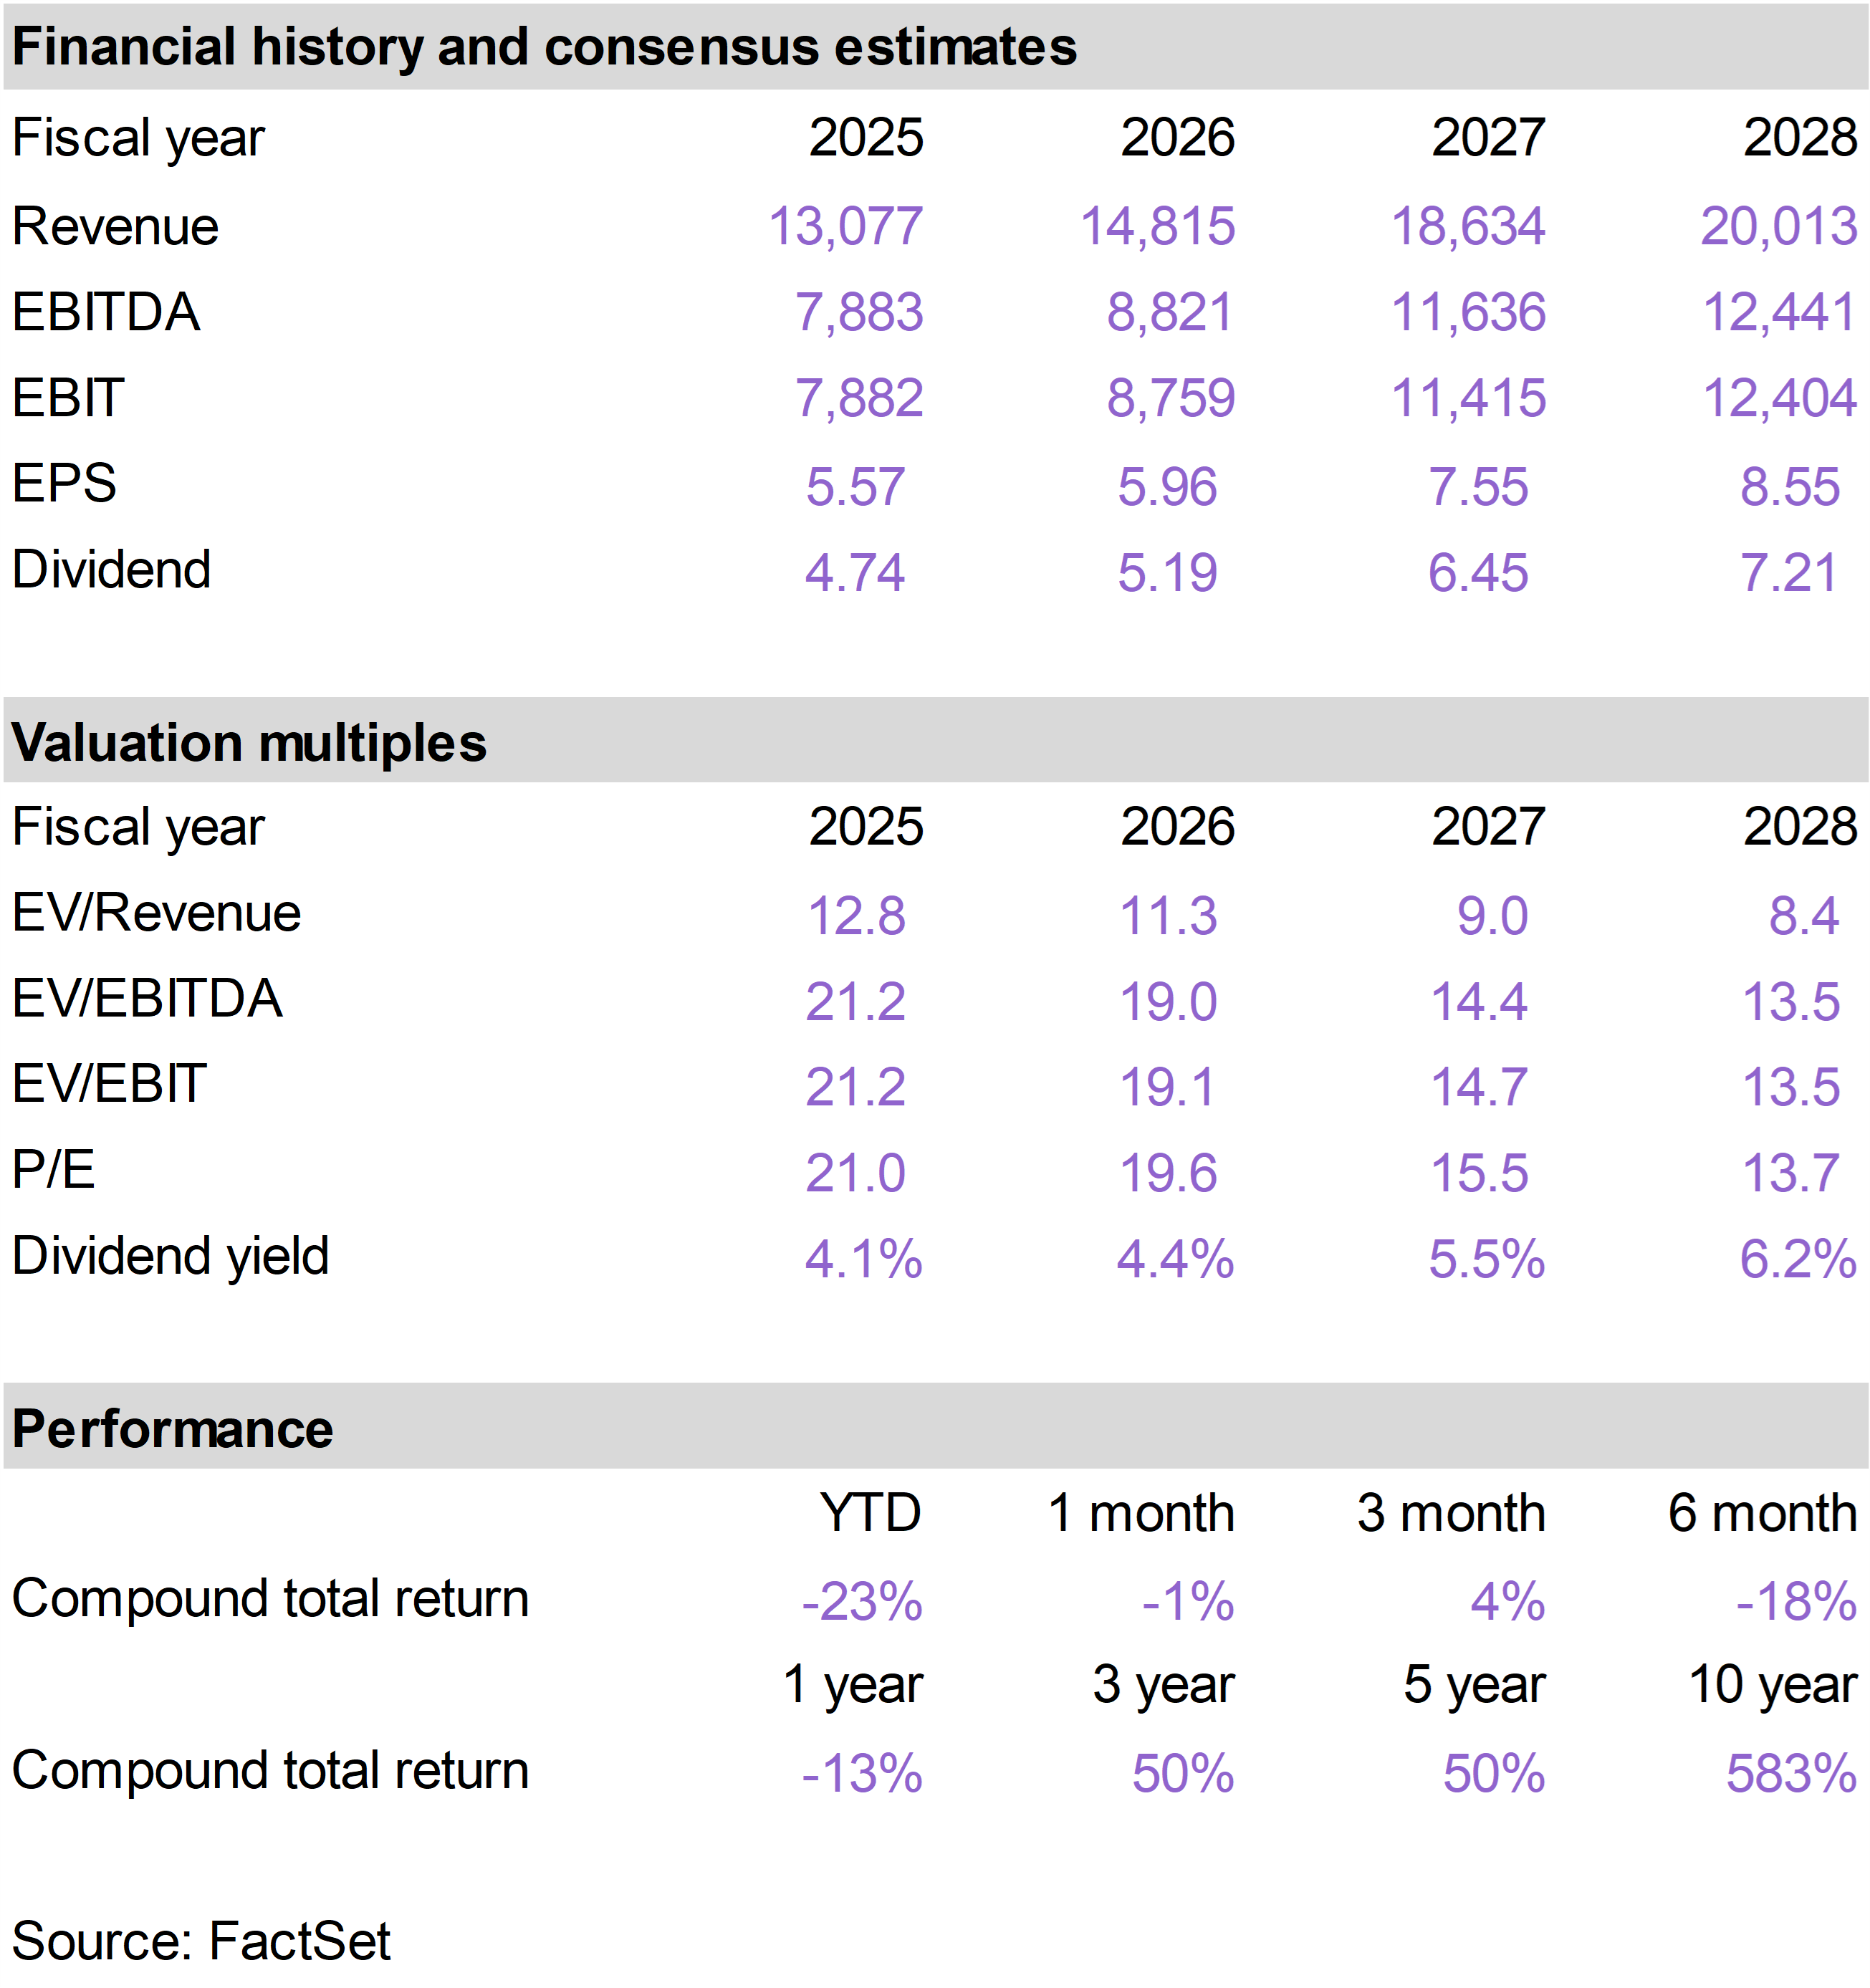
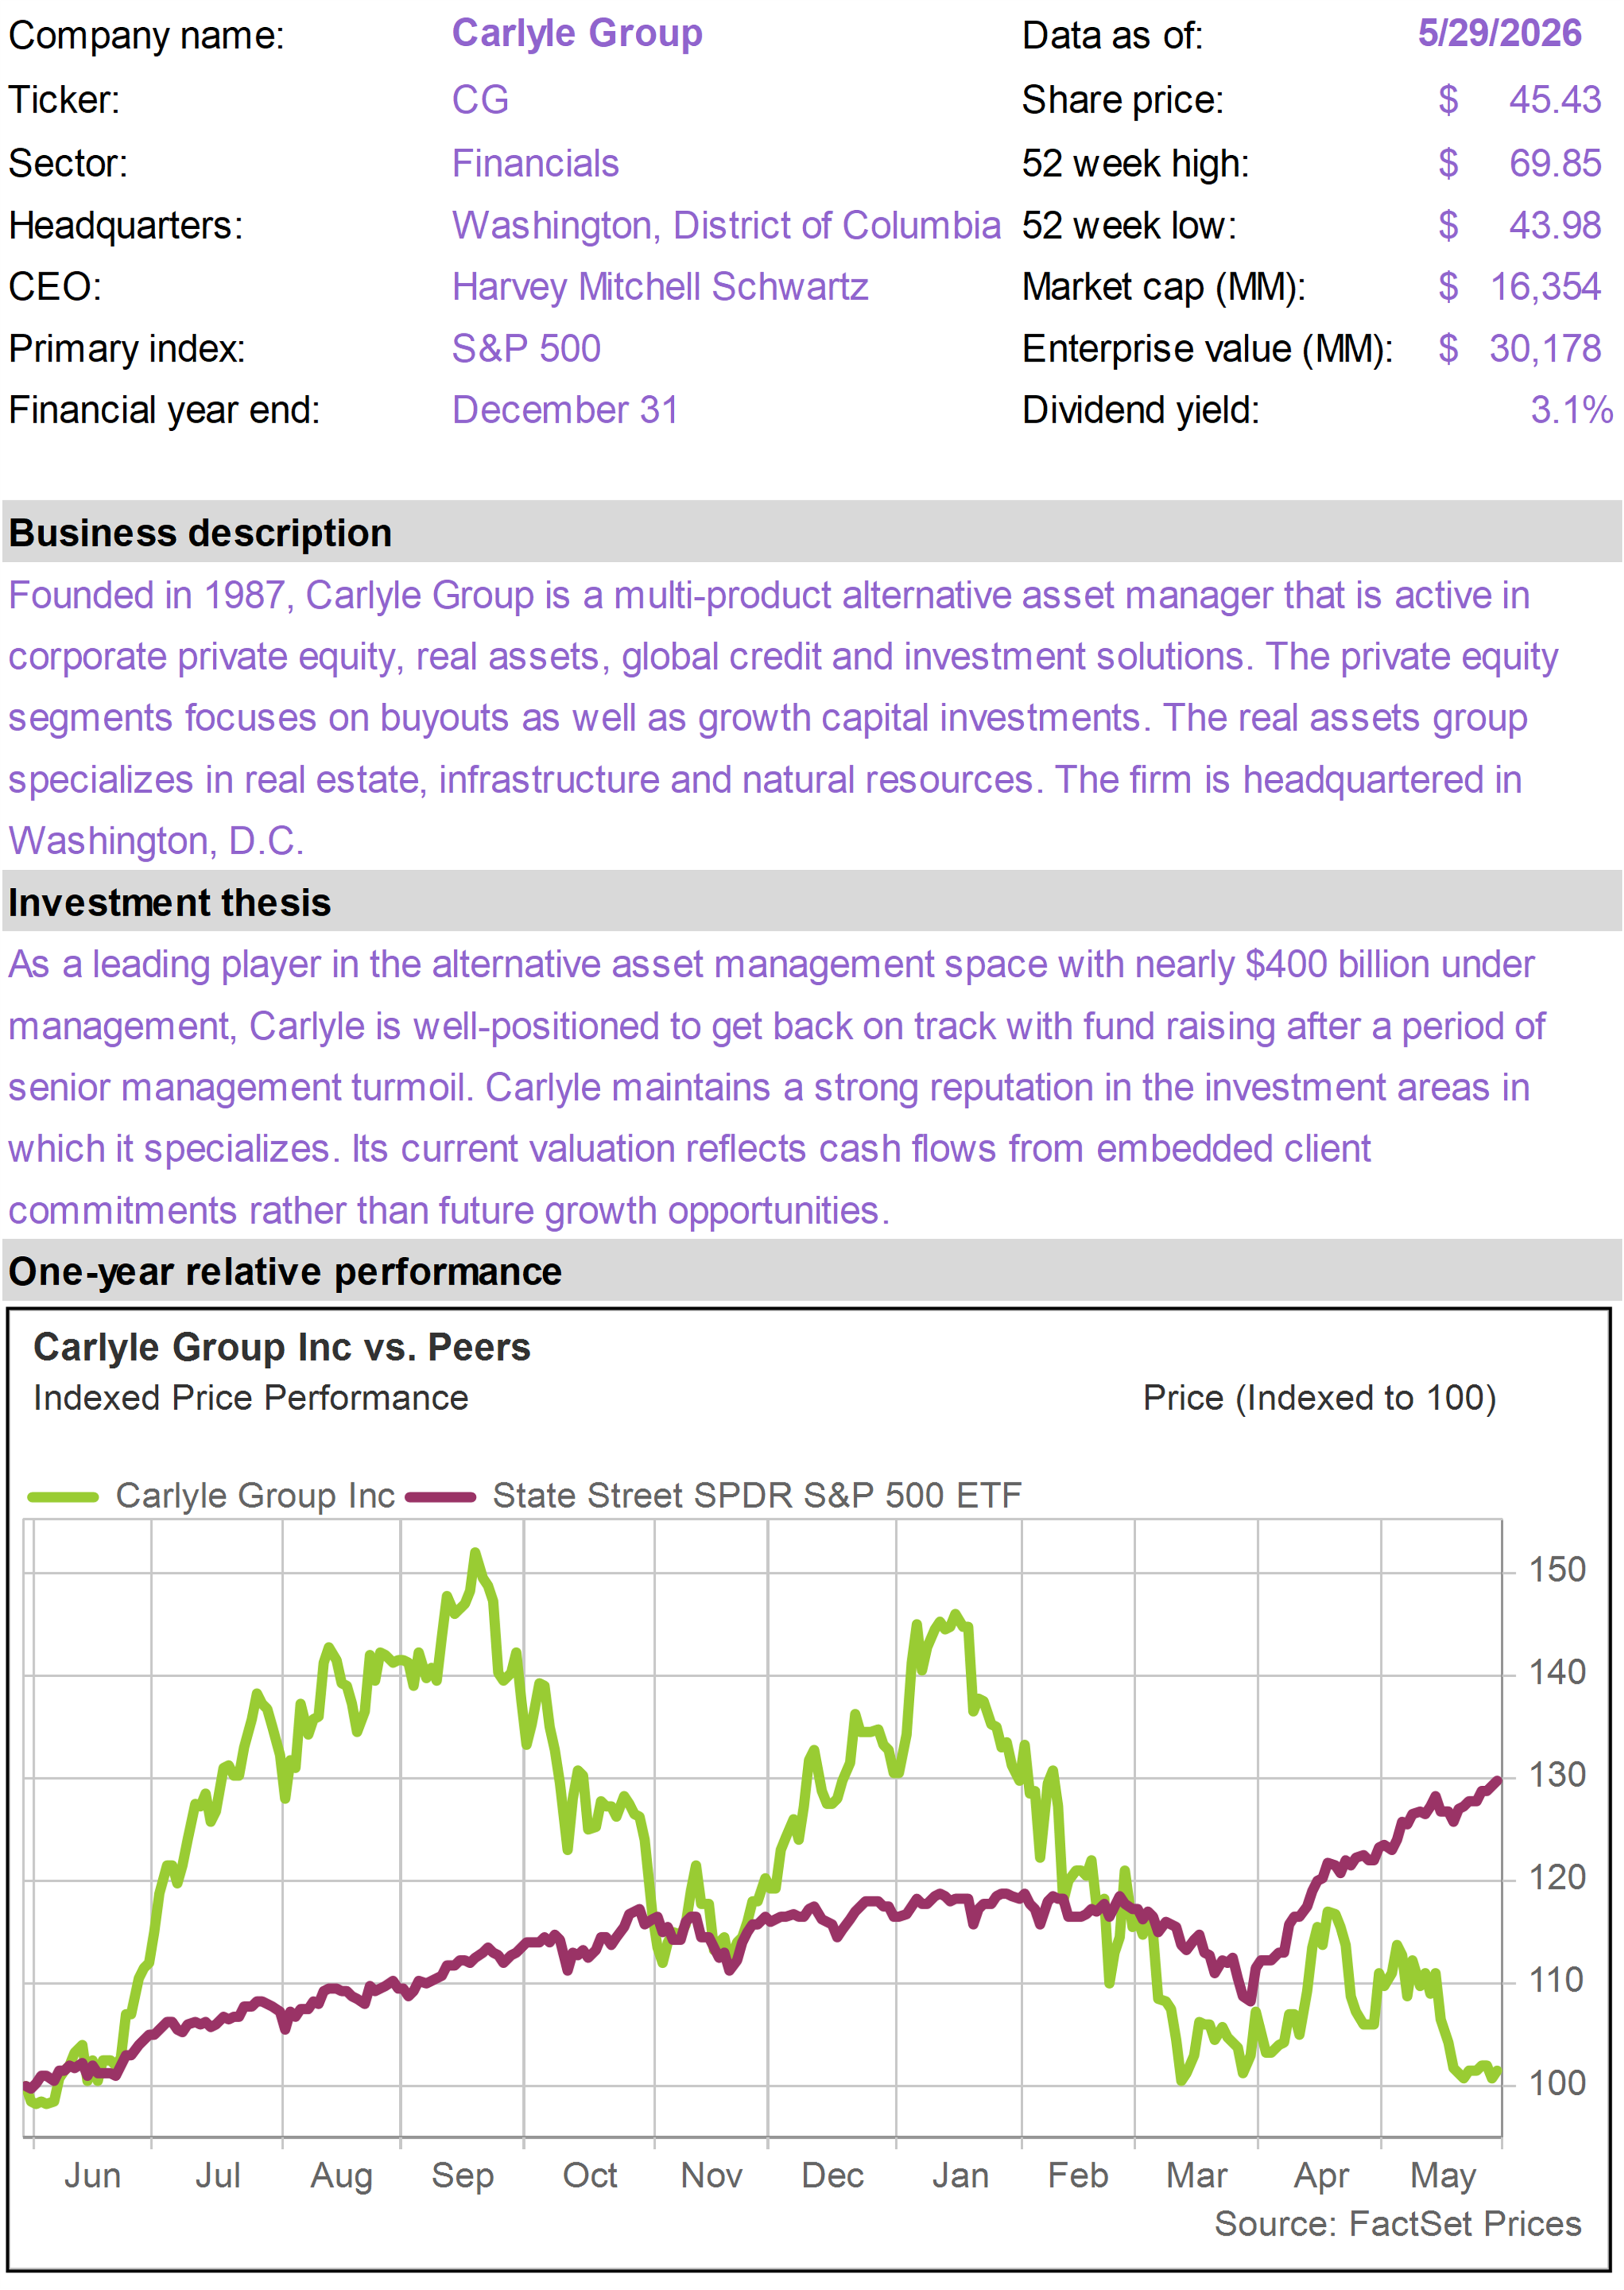
The worst performing positions in the portfolio this month were Permian Resources (PR), which returned -11%; Strategy 8% Perpetual Preferred (STRK), which returned -10%; and Carlyle Group (CG), which returned -9%. |
|
|
Tech dominates again
Investors in Technology stocks were once again the big winners in May. For the second straight month, the Tech holdings of the S&P 500 Index generated a 20% total return.
Tech, which now represents just under 39% of the entire index, effectively accounted for more than 100% of the total gain of the index this month.
All other sectors generated either marginally positive or negative performance. In fact, despite the strong overall performance of the index, most industry sectors (8 out of 11) actually delivered a negative result. |
|
|
|
Tech performance was extremely strong, but it was driven by a small group of stocks. Notably, among large-cap tech stocks with greater than 0.5% representation in the S&P 500, Micron (MU) returned of 88%, Advanced Micro Devices (AMD) returned 46%, and Oracle (ORCL) returned 40%.
All three companies benefited from growing investor confidence in AI-related demand, especially in certain areas that may have been previously underestimated.
MU broke one trillion dollars in market cap as demand for High-Bandwidth Memory (HBM)—a critical component used alongside AI chips—continued to outpace expectations.
AMD surged after investors became increasingly optimistic that the company could capture a larger share of the rapidly expanding AI accelerator market.
ORCL surged on growing enthusiasm for its cloud infrastructure business, reversing doubts that have surfaced in recent months over the pace of its AI data center investments.
There were a number of other, somewhat smaller tech names that also performed extremely well as a result of surprisingly strong AI-related demand.
Dell Technologies (DELL), for example, gained sharply after reporting blowout results that highlighted accelerating demand for its AI-optimized servers. DELL was the single best performer in the index, returning 101% in May.
These companies illustrate how the AI boom is expanding beyond the most obvious beneficiaries and driving up earnings expectations for companies that occupy critical niches of the broader buildout.
In many of these cases, the market was caught off-guard by the sheer strength of demand, from memory and semiconductors to cloud computing and data center capacity.
Iran coming to a close?
Stock market returns in May were largely driven by company-specific earnings surprises, but the broader macro backdrop continued to improve with apparent progress toward a resolution in Iran.
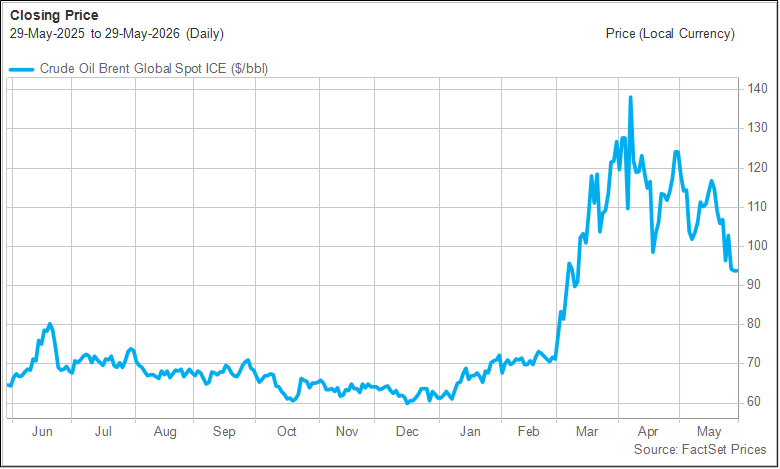
The ultimate barometer of progress in the Middle East is the price of crude oil. As markets sense an improved probability that the Strait of Hormuz will finally reopen and get back to normalized traffic levels, the price of oil drops.
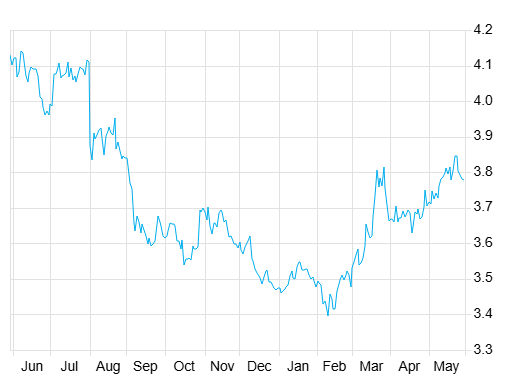
Oil started the month over $120 per barrel and ended just below $95, the lowest level since mid-March. The decline followed a series of developments that suggested the conflict was moving toward de-escalation.
Over the course of the month, fears of a prolonged disruption in the Strait of Hormuz dissipated as reports emerged of backchannel negotiations between the United States and Iran and growing diplomatic efforts by Gulf states to broker a settlement.
As progress toward a ceasefire became increasingly apparent, the geopolitical risk premium embedded in oil prices began to fade. By the end of the month, investors were increasingly pricing in a diplomatic resolution, helping drive crude oil below $95 per barrel. |
|
|
|
Brent Crude Oil($/barrel - Last 12 Months) |
|
|
Energy stocks were the worst performing sector in May, declining 6%. The decline reflects lower oil prices and likely some unwind of hedge positions in the sector that investors established over the course of the conflict.
While the normalization of the situation in the Persian Gulf has taken longer than most investors would have liked, we remain optimistic that the Trump administration is committed to bringing the disruption to an end.
Rate volatility
Strong tech earnings ultimately led to a positive result for the stock market as a whole in May, but investor sentiment was negatively affected by bond market volatility.
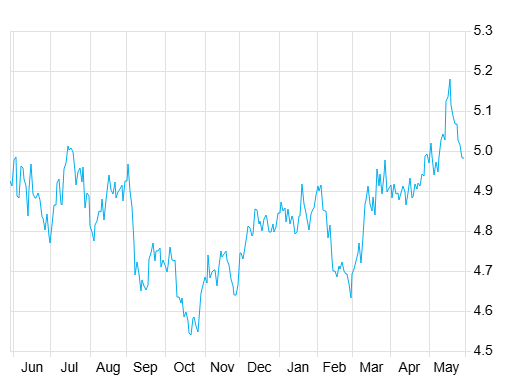
Long-term bond yields spiked in the middle of the month, feeding concerns that higher interest rates could eventually weigh on economic growth and stock valuations.
The yield on the 30-Year Treasury bond broke through 5% in May, almost getting as high as 5.2% in the middle of the month, levels not seen in years. |
|
|
|
30-Year Treasury Yields—Last 12 Months(Source: FactSet) |
|
|
The primary catalyst was the sharp rise in oil prices towards the middle of the month as negotiations with Iran appeared to break down. Bond investors were also responding to the April Consumer Price Index (CPI) report, which showed inflation rising to 3.8%, its highest level in roughly three years.
The inflation report primarily reflected the direct impact of the spike in oil prices on gasoline prices and other energy expenses, which accounted for the vast majority of the increase.
As oil prices later receded, Treasury yields stabilized, removing an important headwind for equities.
The sharp decline in oil prices has also had an impact on perceptions on future rate cuts. The higher than expected inflation report fueled speculation that rather than continuing on the rate-cutting path, the Federal Reserve may even have to hike rates.
Following the pattern of the 30-Year, short-term interest rates rose slightly in the middle of the month before retreating.
One-Year Treasury yields still remain about a quarter-point higher than where they were before the war in Iran started.
With the Fed funds rate currently set within the 3.5% to 3.75% band, and One-Year Treasury yields just below 3.8%, the bond market is signaling that there is at least the potential for an additional rate hike in the next 12 months. |
|
|
|
One-Year Treasury Yields—Last 12 Months(Source: FactSet) |
|
|
A positive inflation surprise?
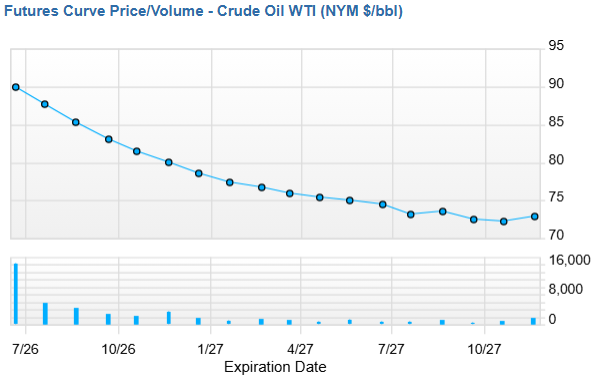
With oil prices still elevated relative to pre-war levels, and heavy spending on AI leading to some supply constraints (for example, in memory), the market remains focused on inflation risk.
While the mood toward inflation is currently cautious, there are reasons to be optimistic.
Futures markets price in significantly lower oil prices going forward, suggesting we are on a path toward lower energy costs. As spot oil prices come down, it is possible that forward pricing could come down even further. |
|
|
|
Crude Oil Futures Curve(Source: FactSet) |
|
|
From a more long-term perspective, the energy crisis we have experienced over the past several months is likely to produce a significant supply response.
Higher oil prices will encourage greater oil production and, over a multi-year period, the creation of new pipelines that bypass the Strait of Hormuz.
On the other hand, heavy spending on AI infrastructure is injecting demand into the economy for labor, commodities, and equipment. All of this is ultimately positive and pro-growth but likely contributes to short-term inflationary pressure.
But as Kevin Warsh begins his tenture as Fed Chair, we should not lose sight of one of his most important messages—that AI, as it gets deployed throughout the economy, has enormous potential to deliver increased productivity and thereby serve as a disinflationary force.
While the stock market has performed well on the back of strong earnings growth, rising inflation risk, manifesting as rising long-term interest rates, has been a headwind.
Any sign that inflation risk is receding over the course of the year could allow the new Warsh Fed to get back on the rate-cutting path. This in turn could serve as a meaningful source of support for the market, particularly sectors outside of technology that stand to benefit from relief on interest rates. |
|
| | | The top performing positions within the portfolio in May were Texas Instruments (TXN), which returned 9%; Crown Castle (CCI), which returned 3%; and Prologis (PLD), which returned 1%.
The worst performing positions were Permian Resources (PR), which returned -11%; Strategy 8% Perpetual Preferred (STRK), which returned -10%; and Carlyle Group (CG), which returned -9%. |
|
| |
TXN continued to advance this month and is enjoying a breakout year, up nearly 80% on a year to date basis through the end of May.
For years, investors viewed TXN primarily as an industrial and automotive semiconductor company. The market is increasingly recognizing the relevance of analog chips (where TXN benefits from an enormous market share and cost leadership position) to the broader AI story, from data centers to physical AI.
Tangible evidence of surging data center demand for TXN chips is perhaps the most notable shift in TXN's growth outlook this year. During the company's most recent quarter, management disclosed that data center revenue increased approximately 90% year-over-year and 25% sequentially, marking the eighth consecutive quarter of growth.
As hyperscalers continue investing hundreds of billions of dollars into AI infrastructure, demand is rising for the analog and power management chips that help regulate electricity, monitor performance, and keep power-hungry AI systems operating efficiently. TXN is one of the leading suppliers of these components.
Perhaps most importantly, the recent surge in demand is validating management's long-term strategy. TXN spent years investing heavily in new manufacturing capacity despite a weak semiconductor cycle, a decision that was unpopular with many investors at the time because it pressured free cash flow.
Today, as industrial markets recover and AI infrastructure spending accelerates, that capacity is becoming a major competitive advantage. What looked like excess spending a few years ago now looks like one of the smartest decisions management has made.
TXN has ample excess capacity in its new semiconductor fabs to meet all of this growing demand. This excess capacity means incremental revenue comes with high profit margins, setting TXN up for record levels of free cash flow in the years ahead. |
|
| |
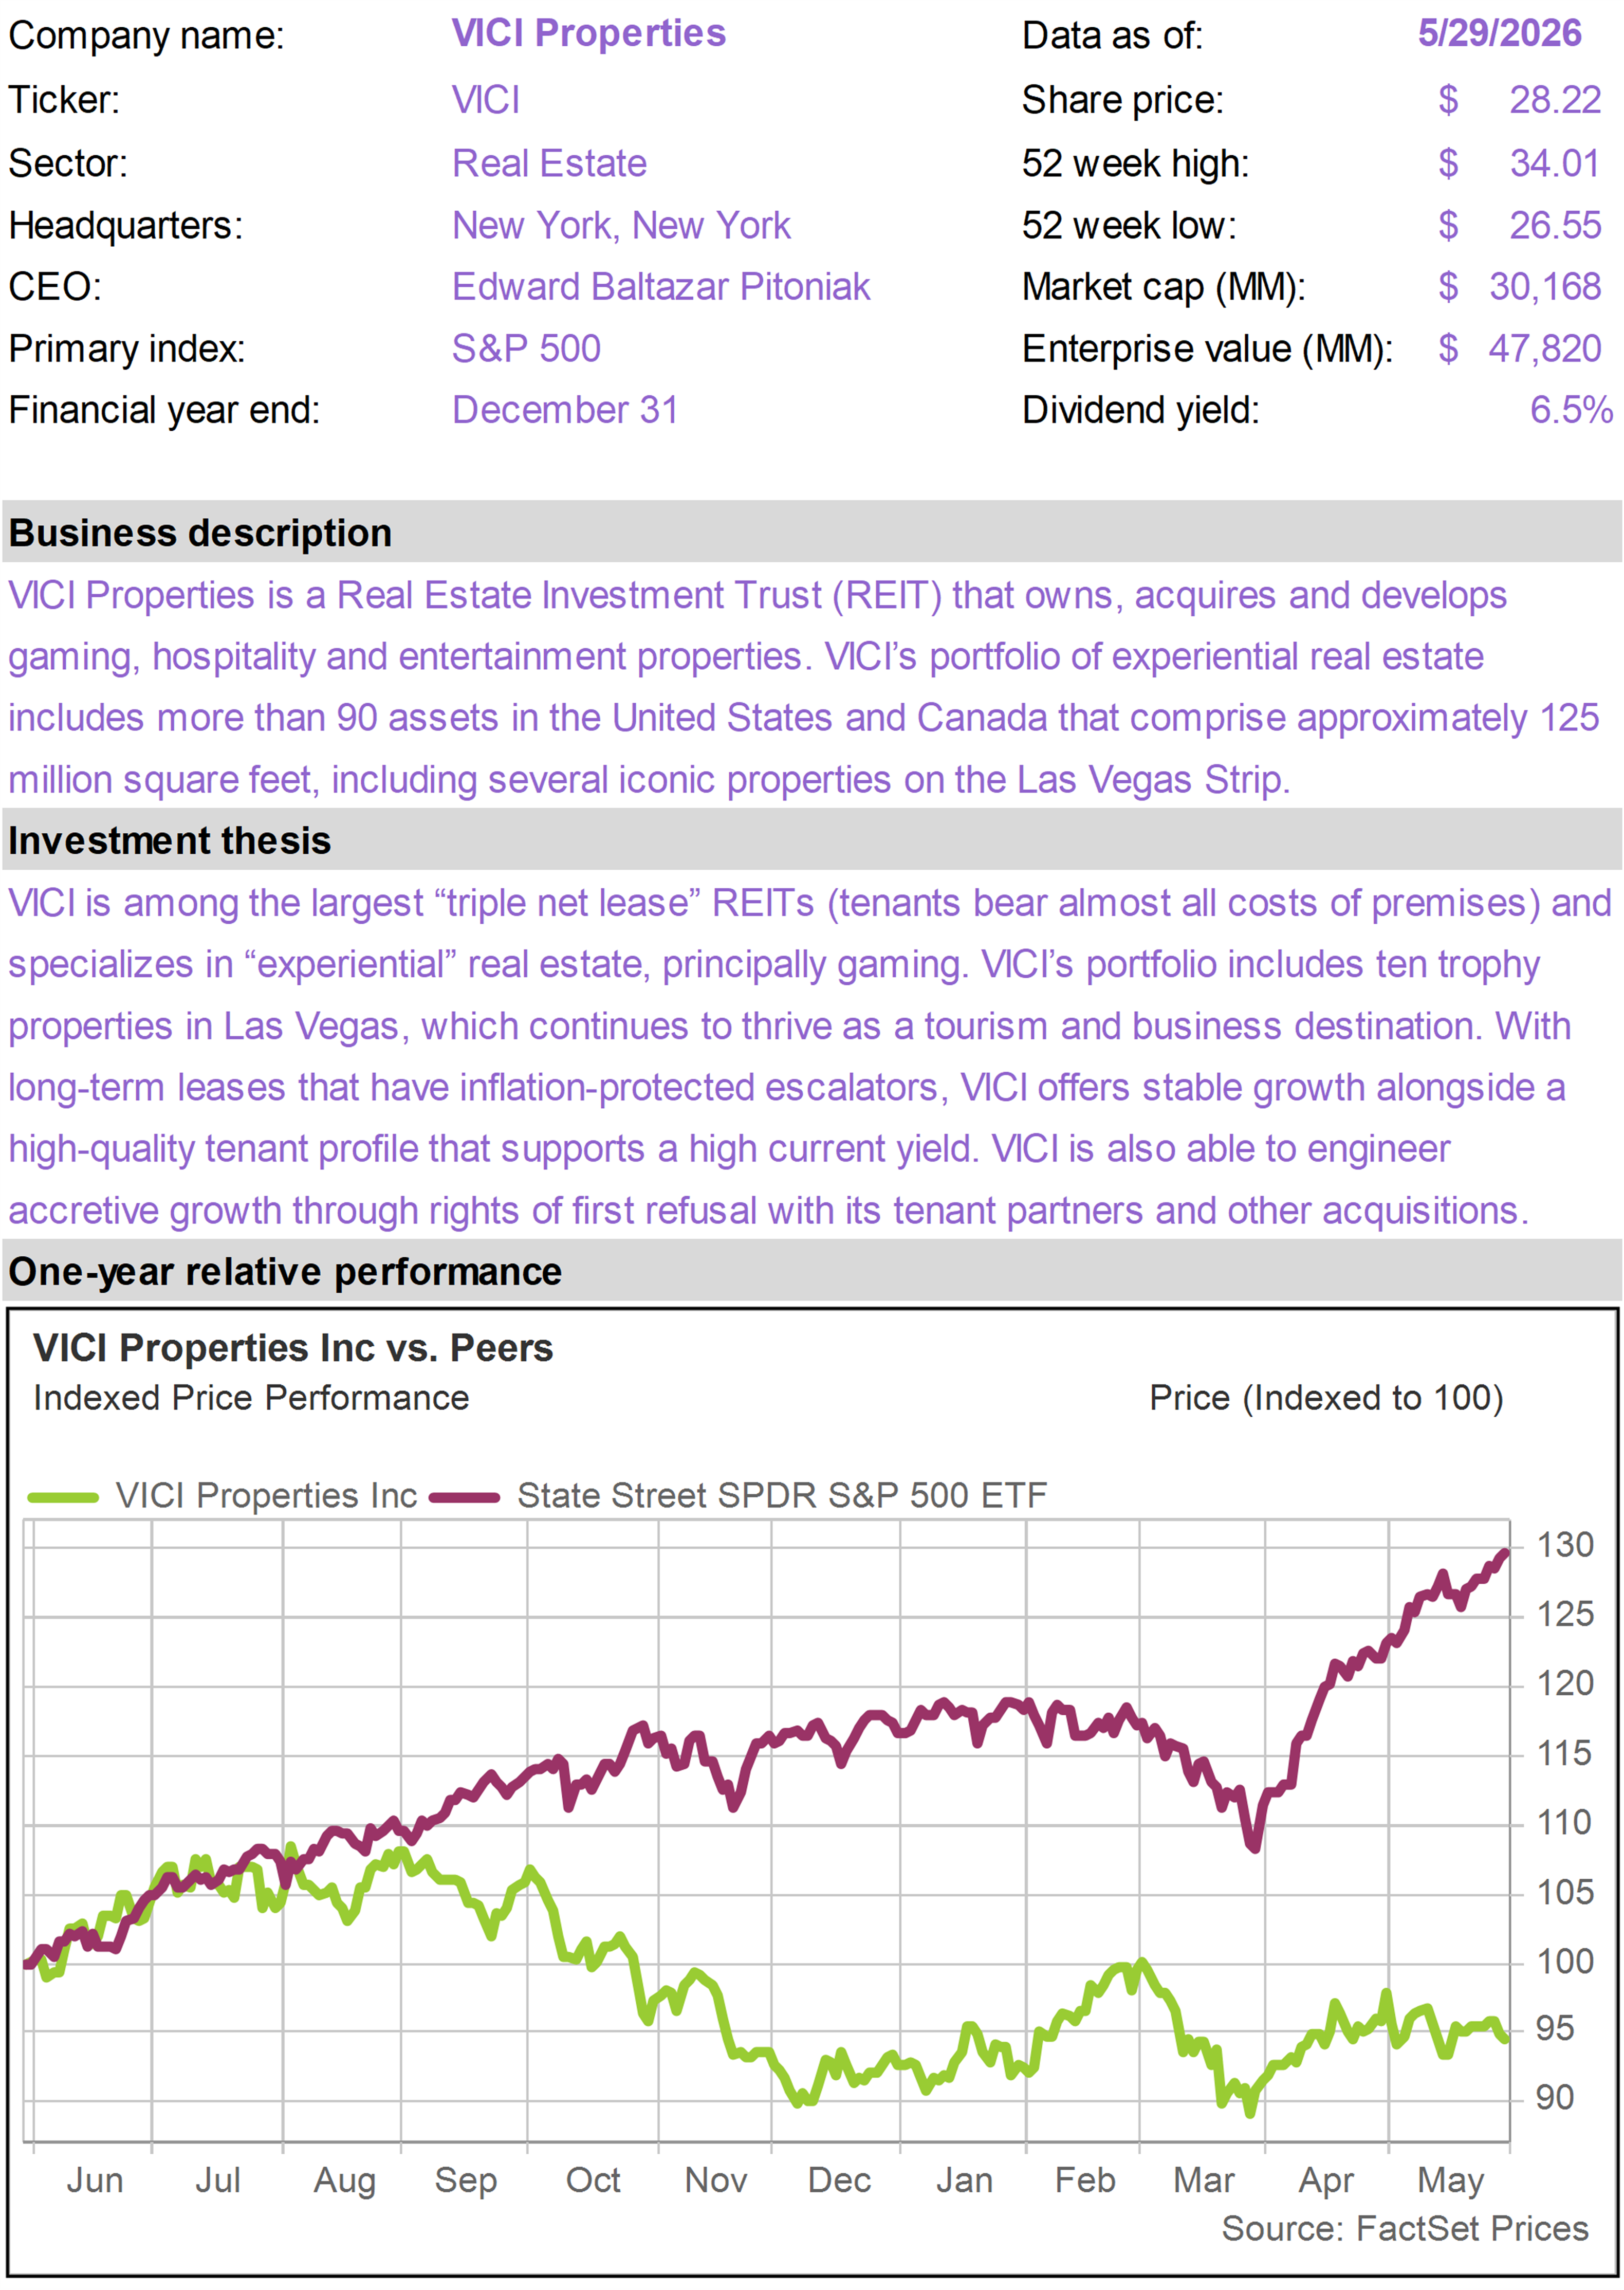
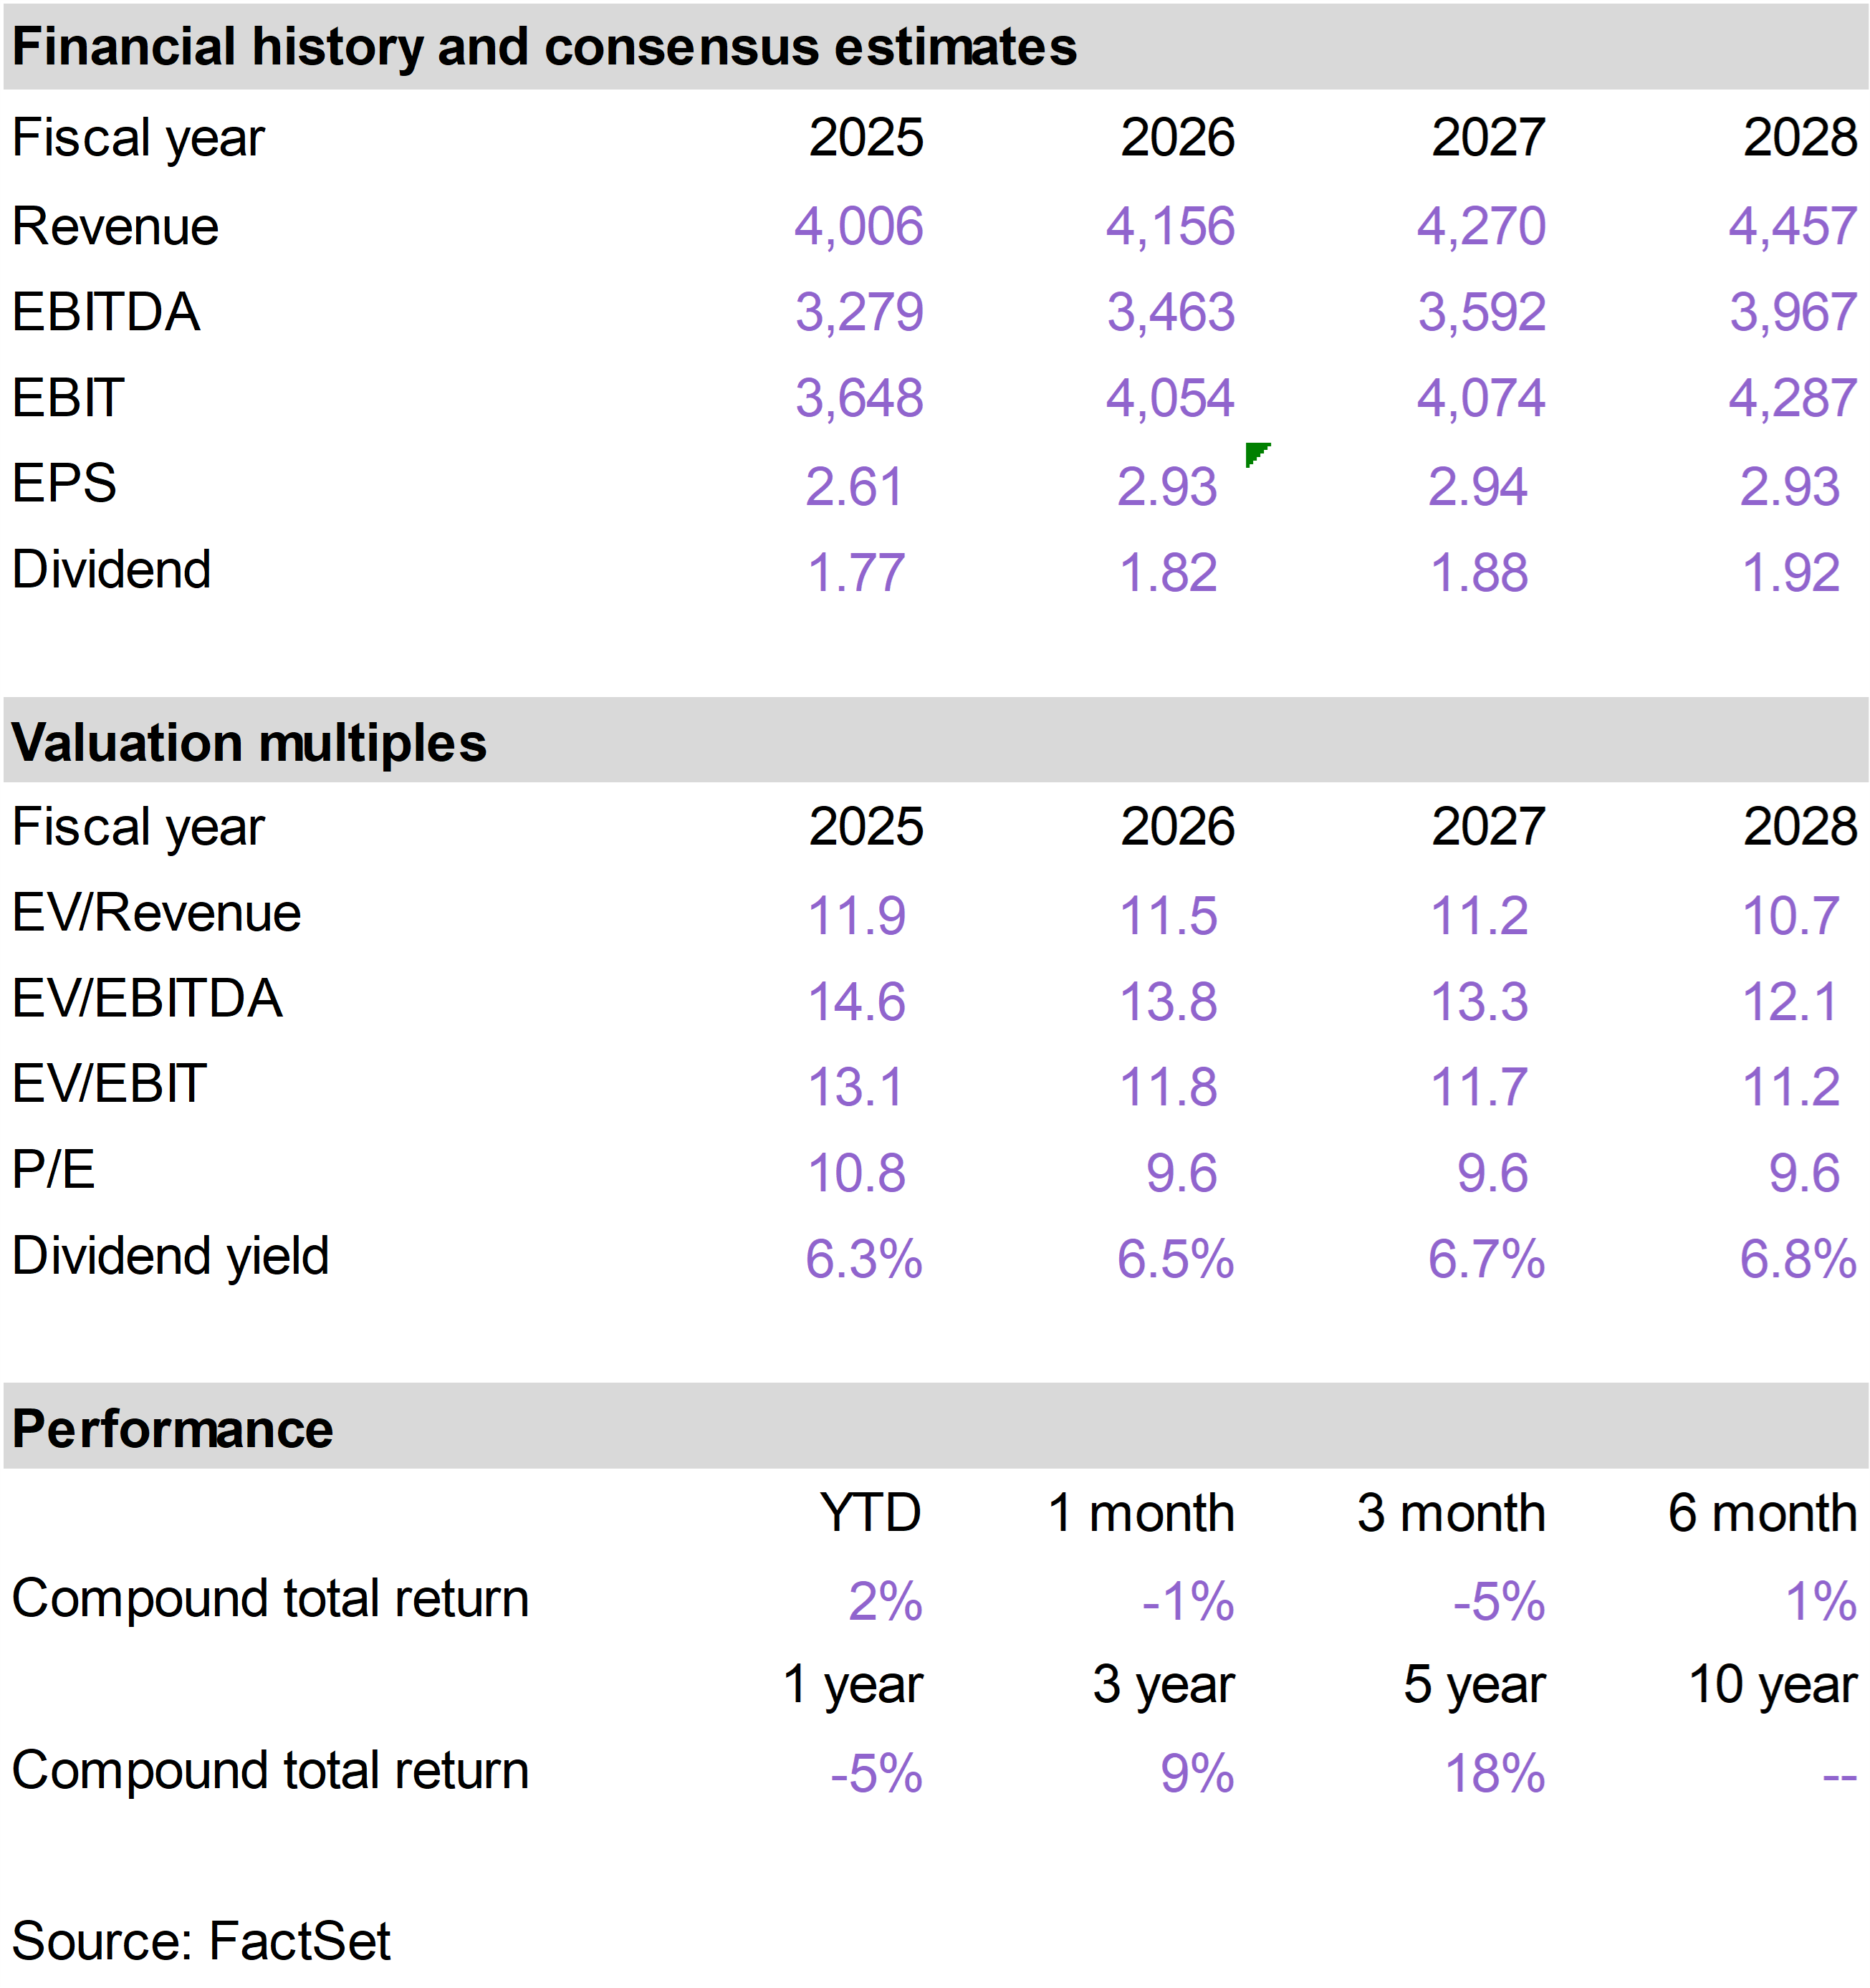
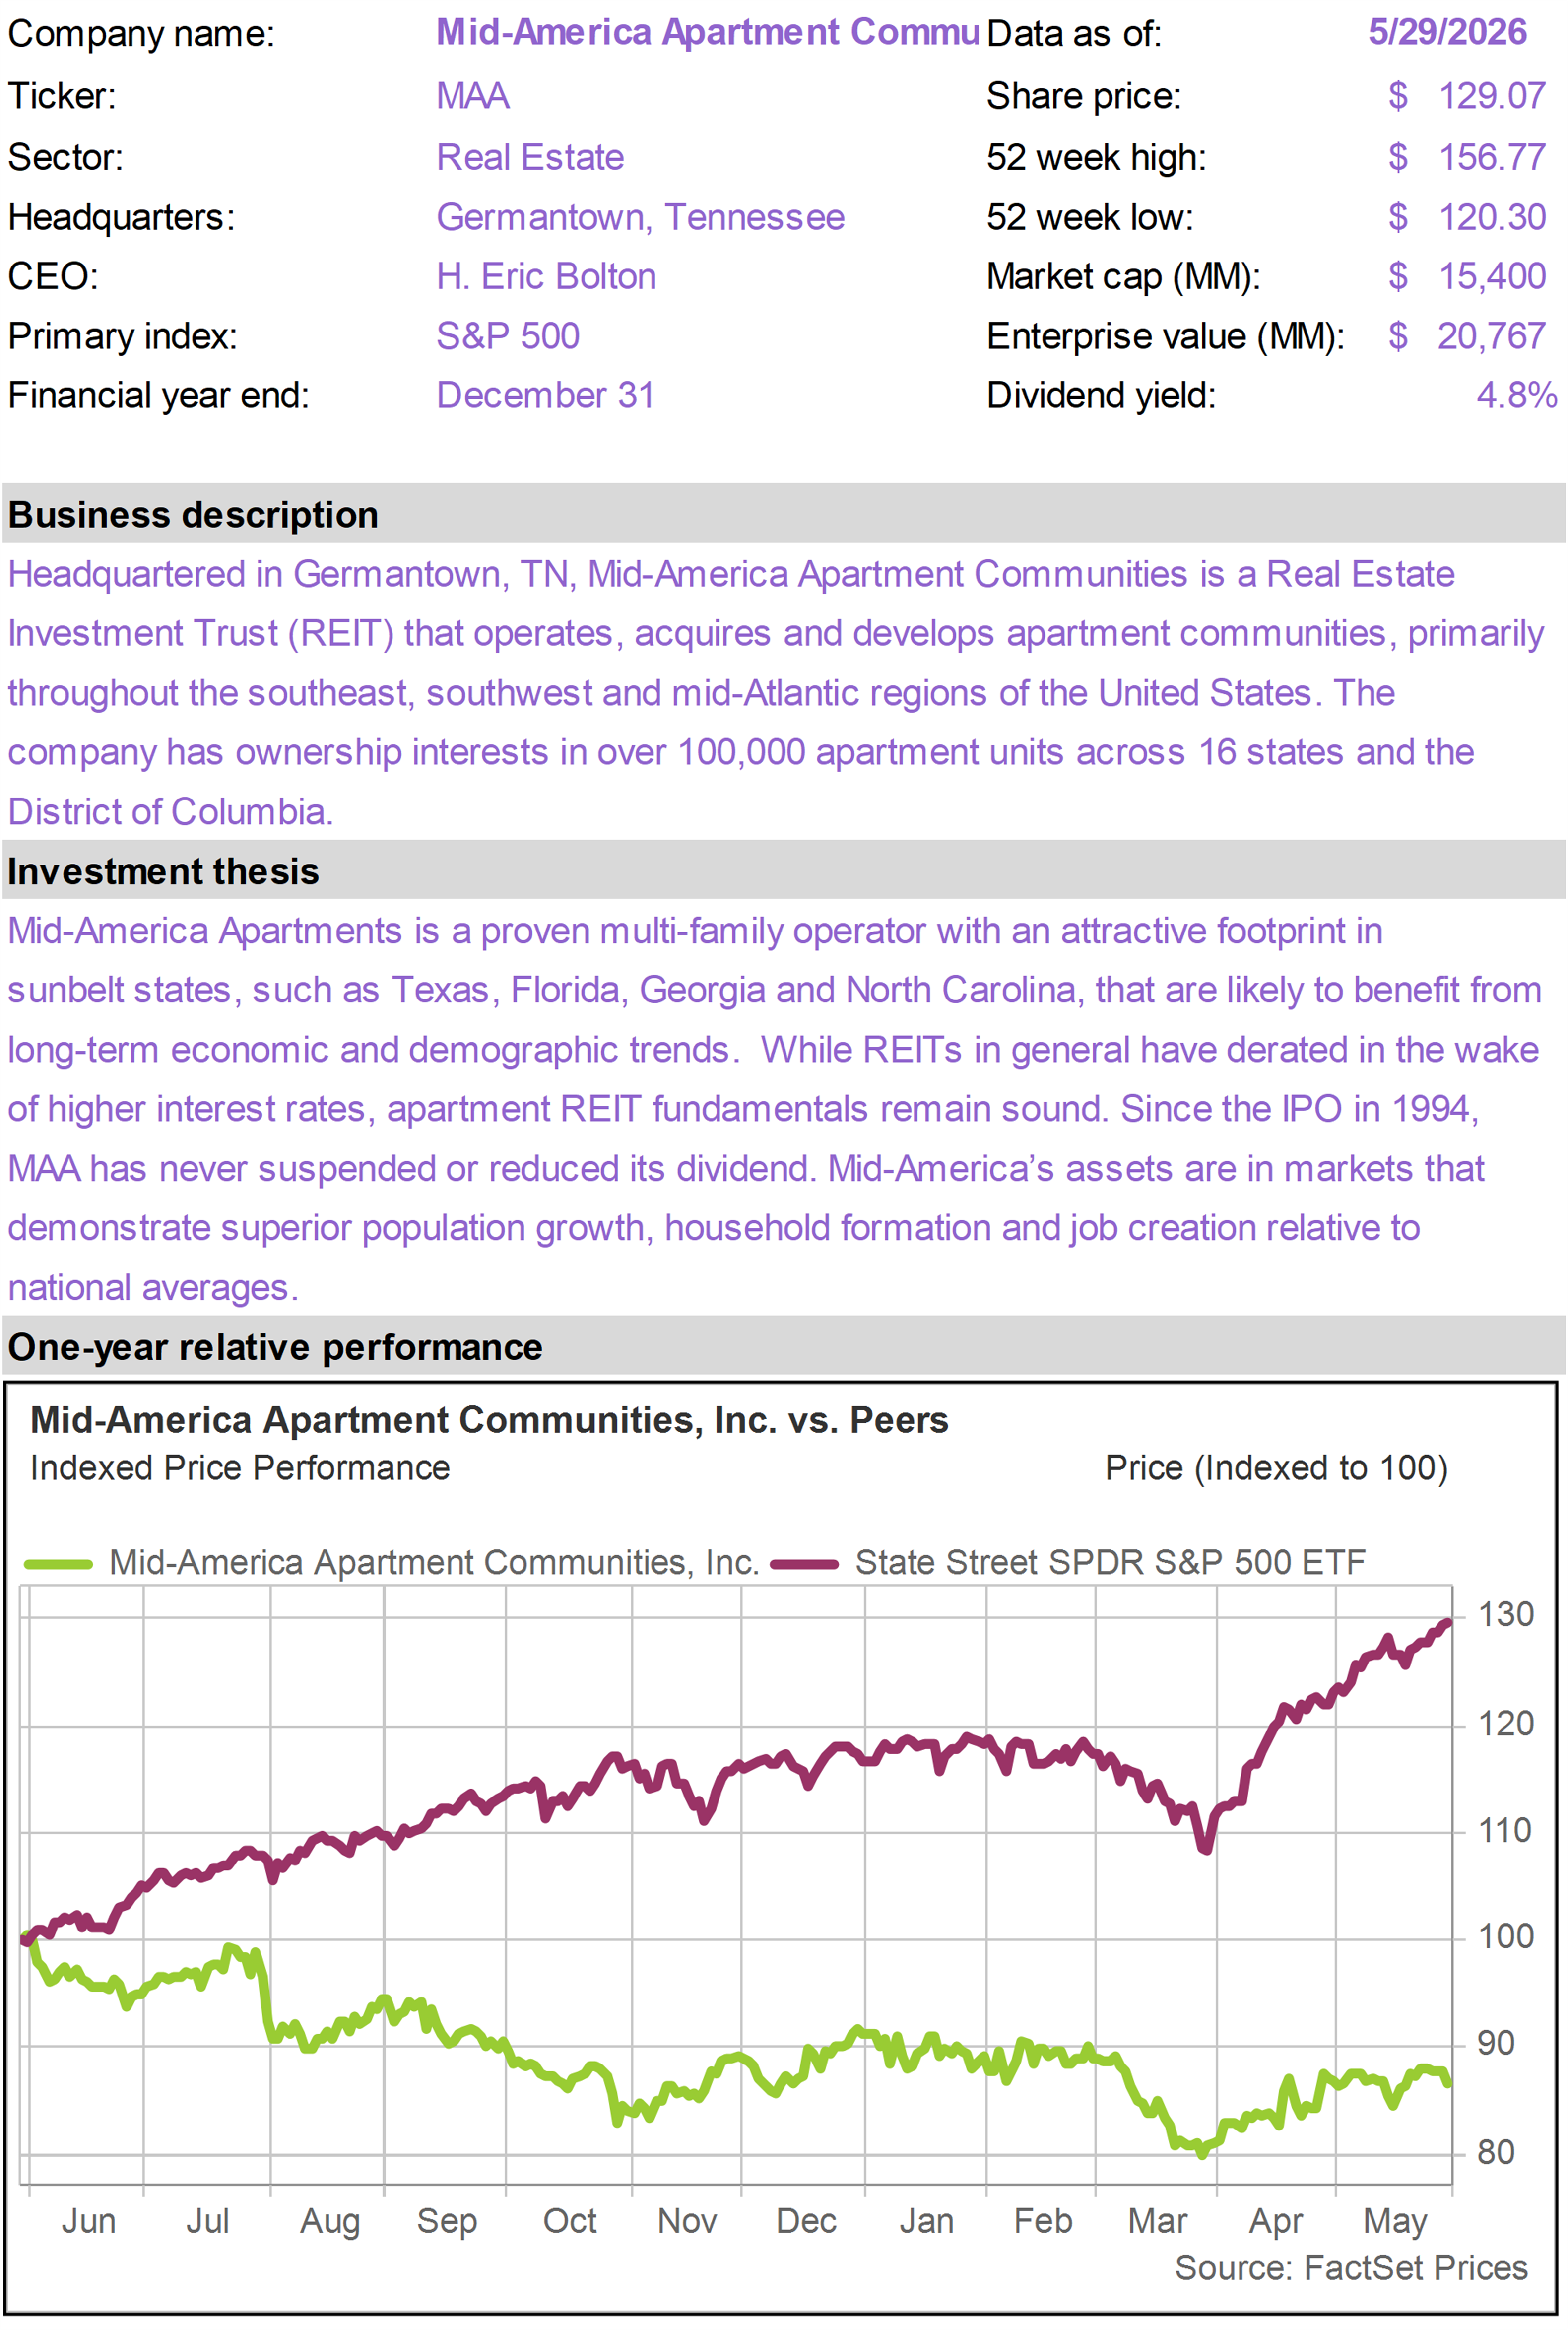
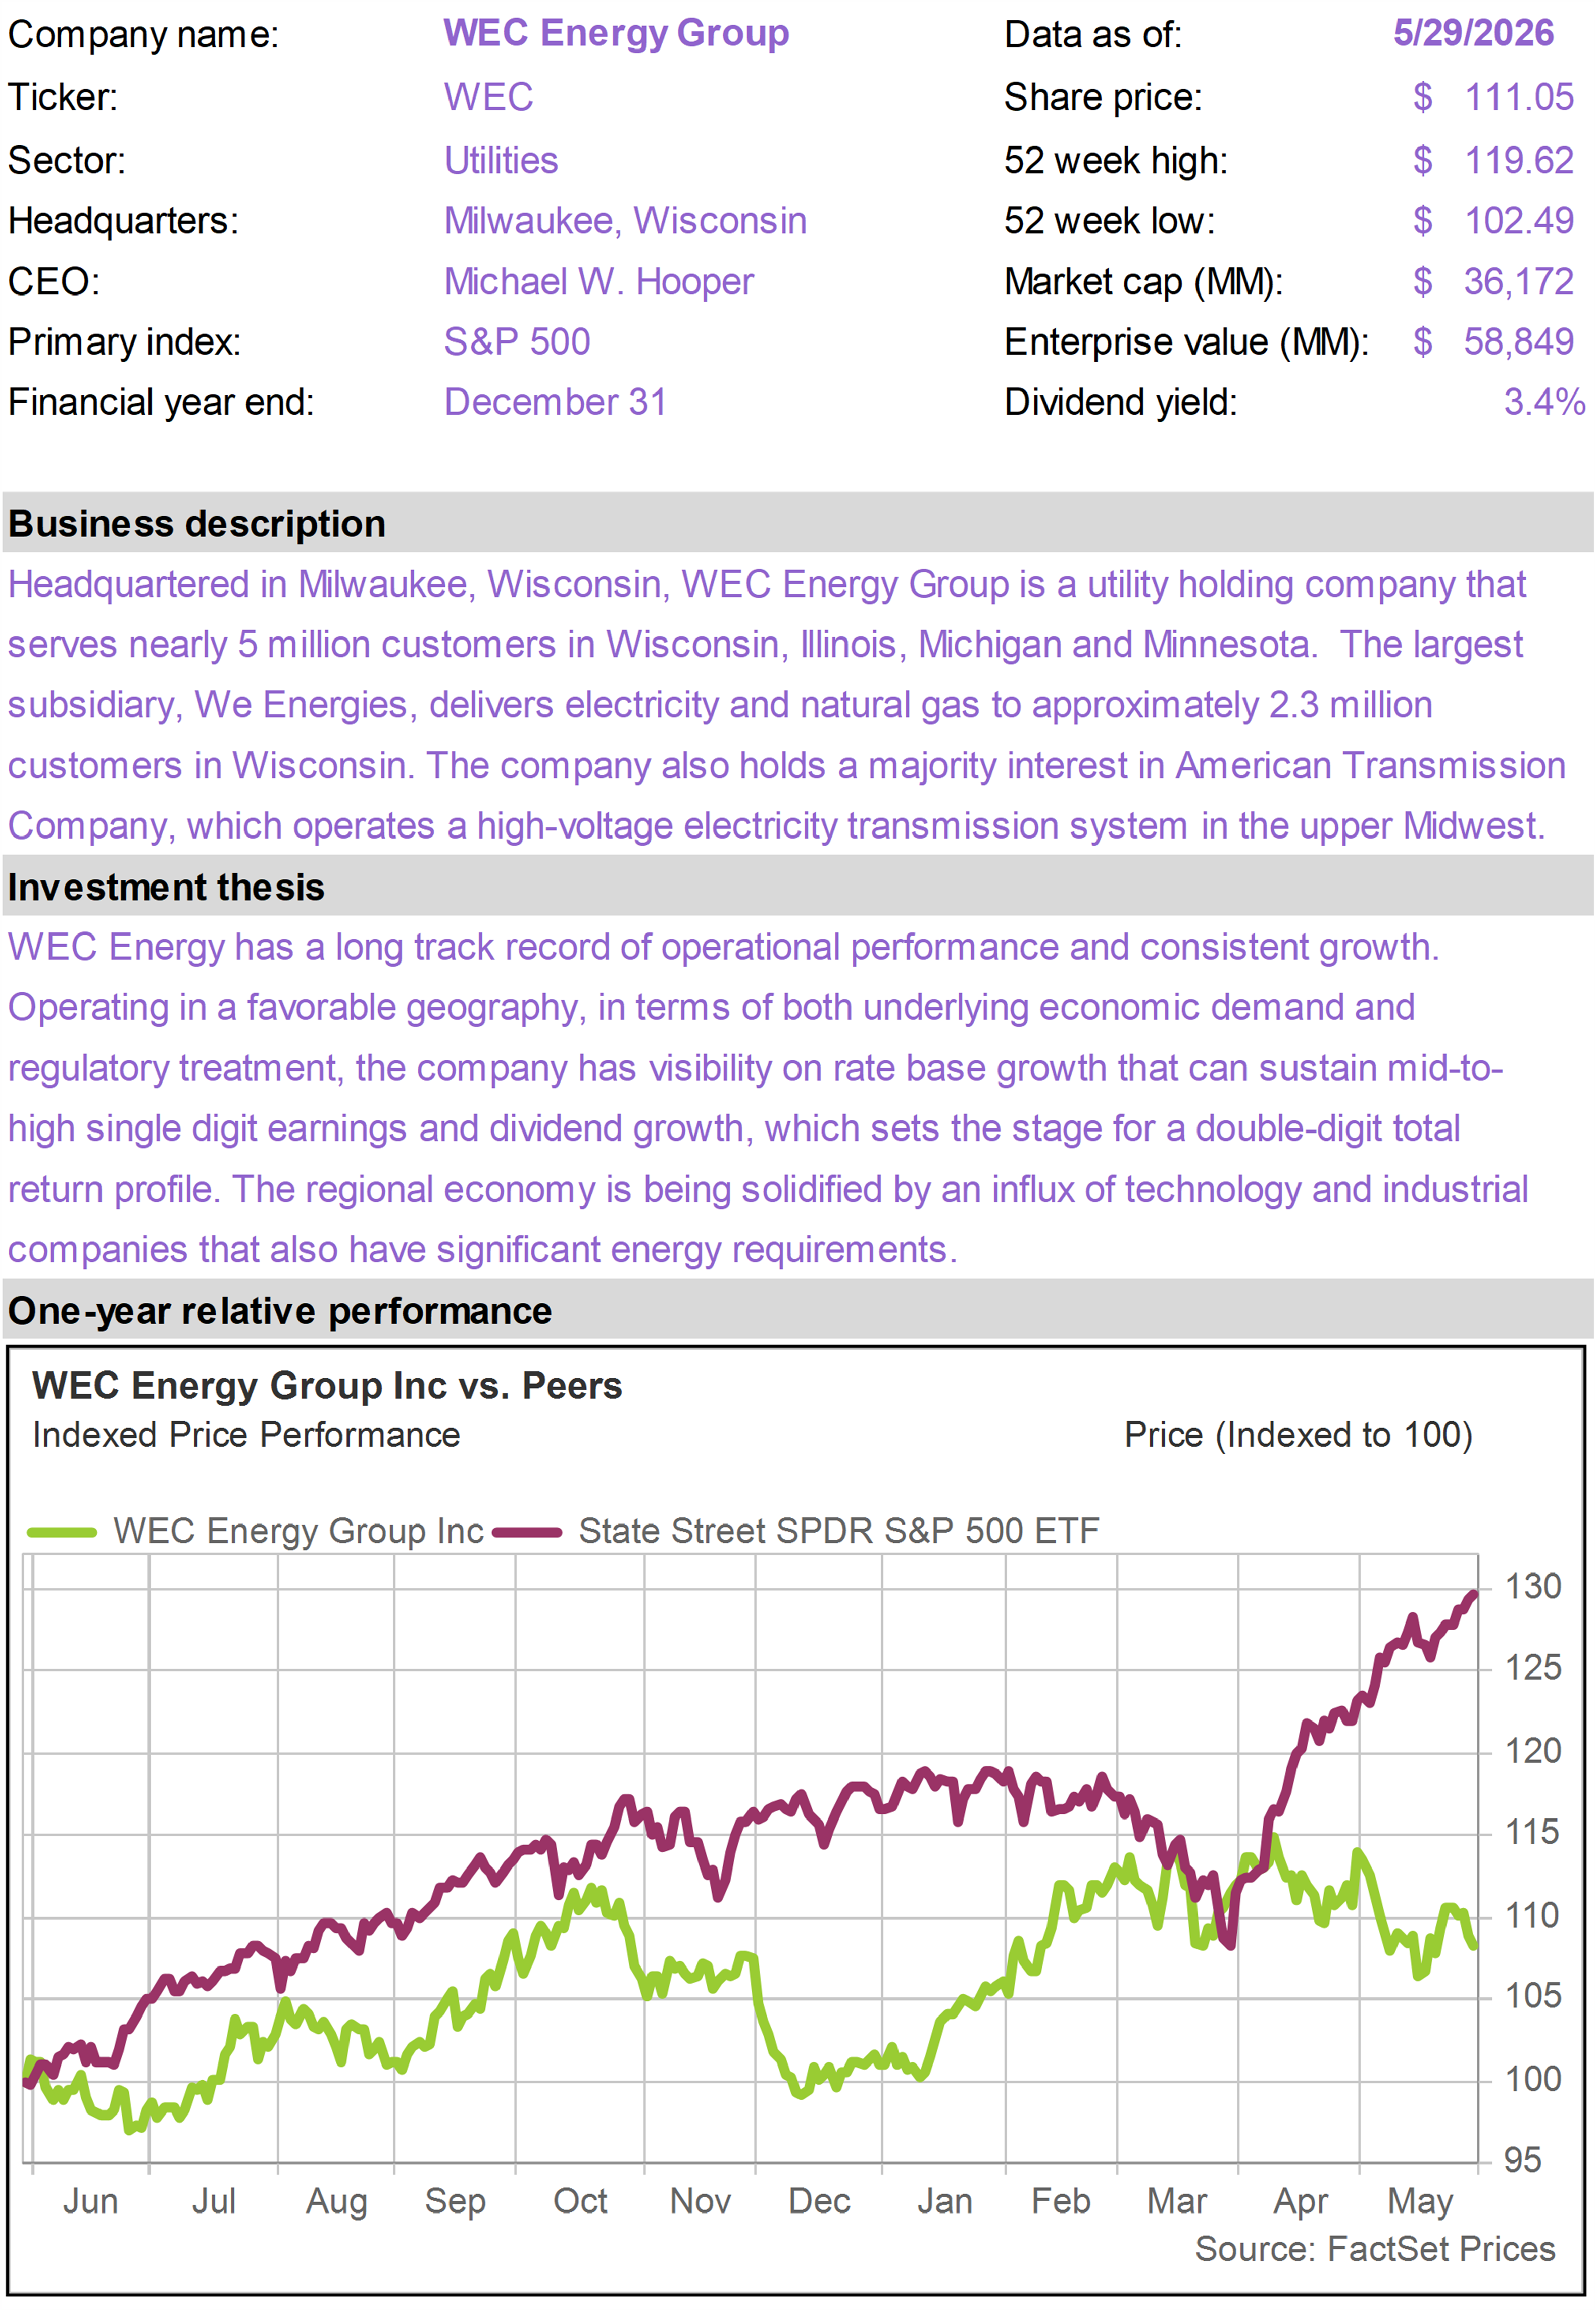
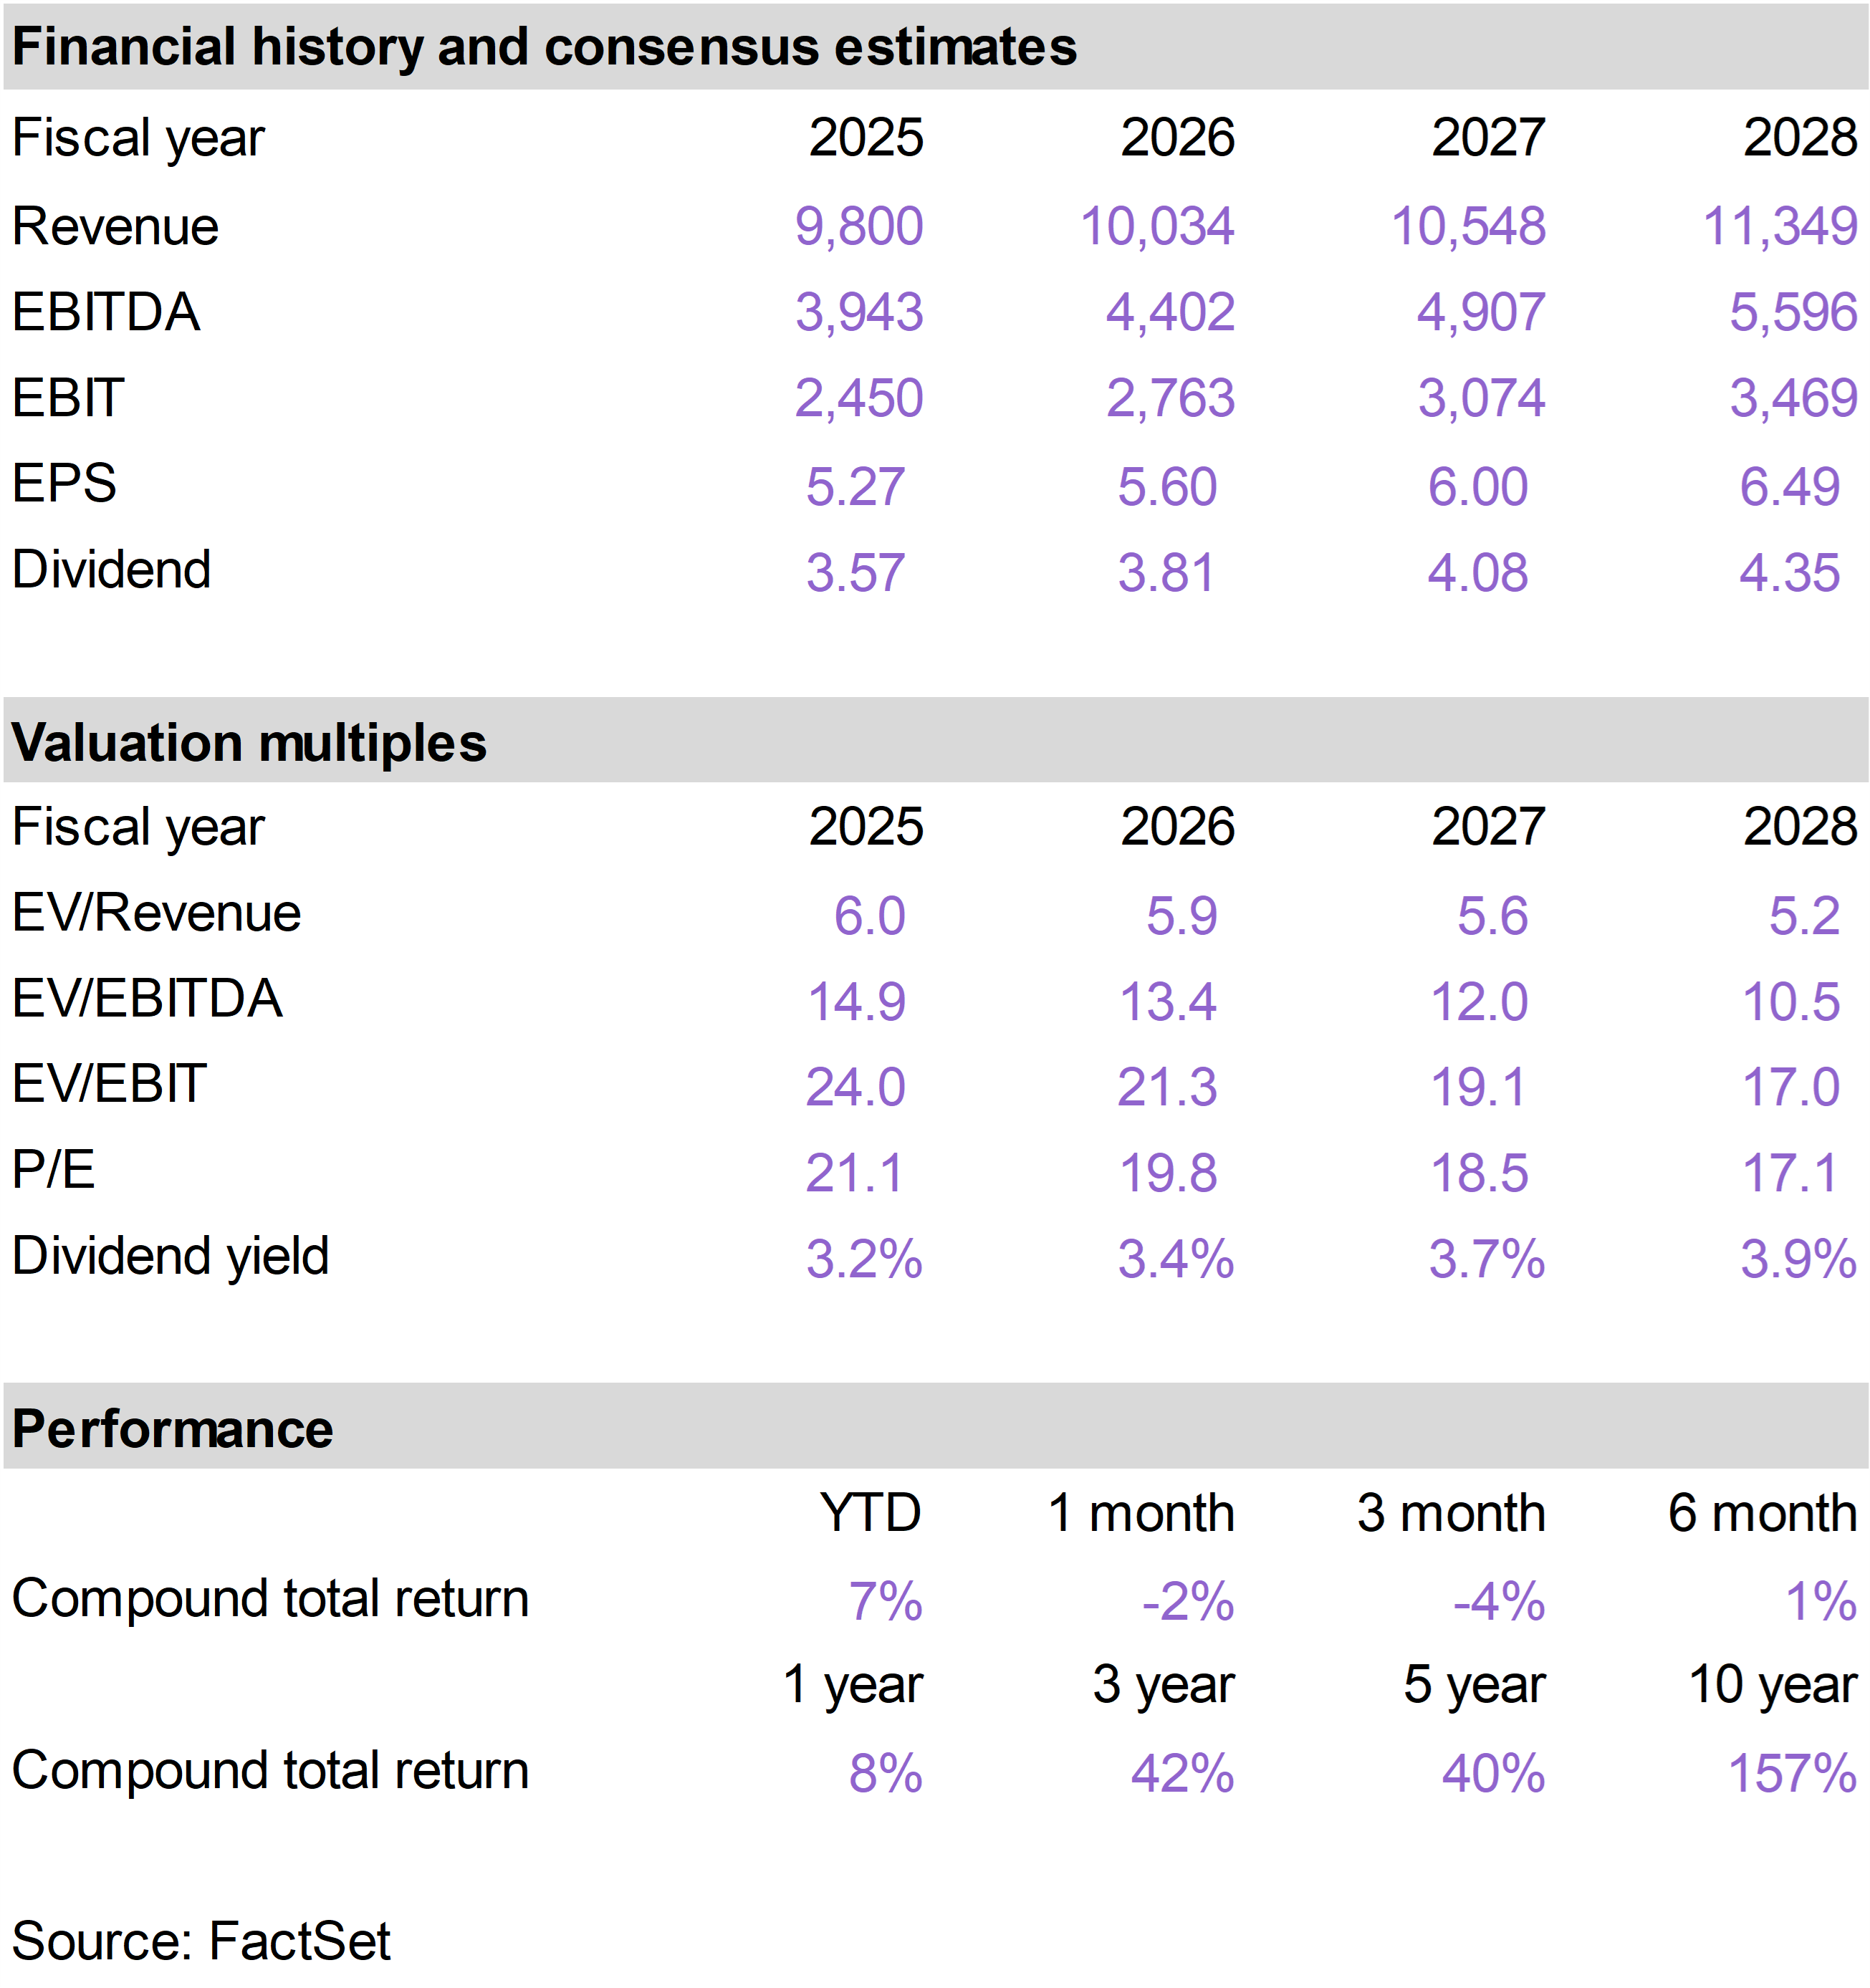
May was a challenging month for the Real Estate sector, given the upward pressure on long-term interest rates, yet two REIT holdings within the portfolio generated positive returns: CCI and PLD.
An emerging development related to both of these companies is their potential relevance to the rollout of AI inference capacity across the United States.
While much of the market's attention has focused on massive AI training clusters located in hyperscale data centers, the next phase of AI adoption will require computing power to be distributed much closer to end users.
Applications such as autonomous systems, robotics, industrial automation, real-time analytics, and AI-powered software require low-latency infrastructure that can process information near where it is generated.
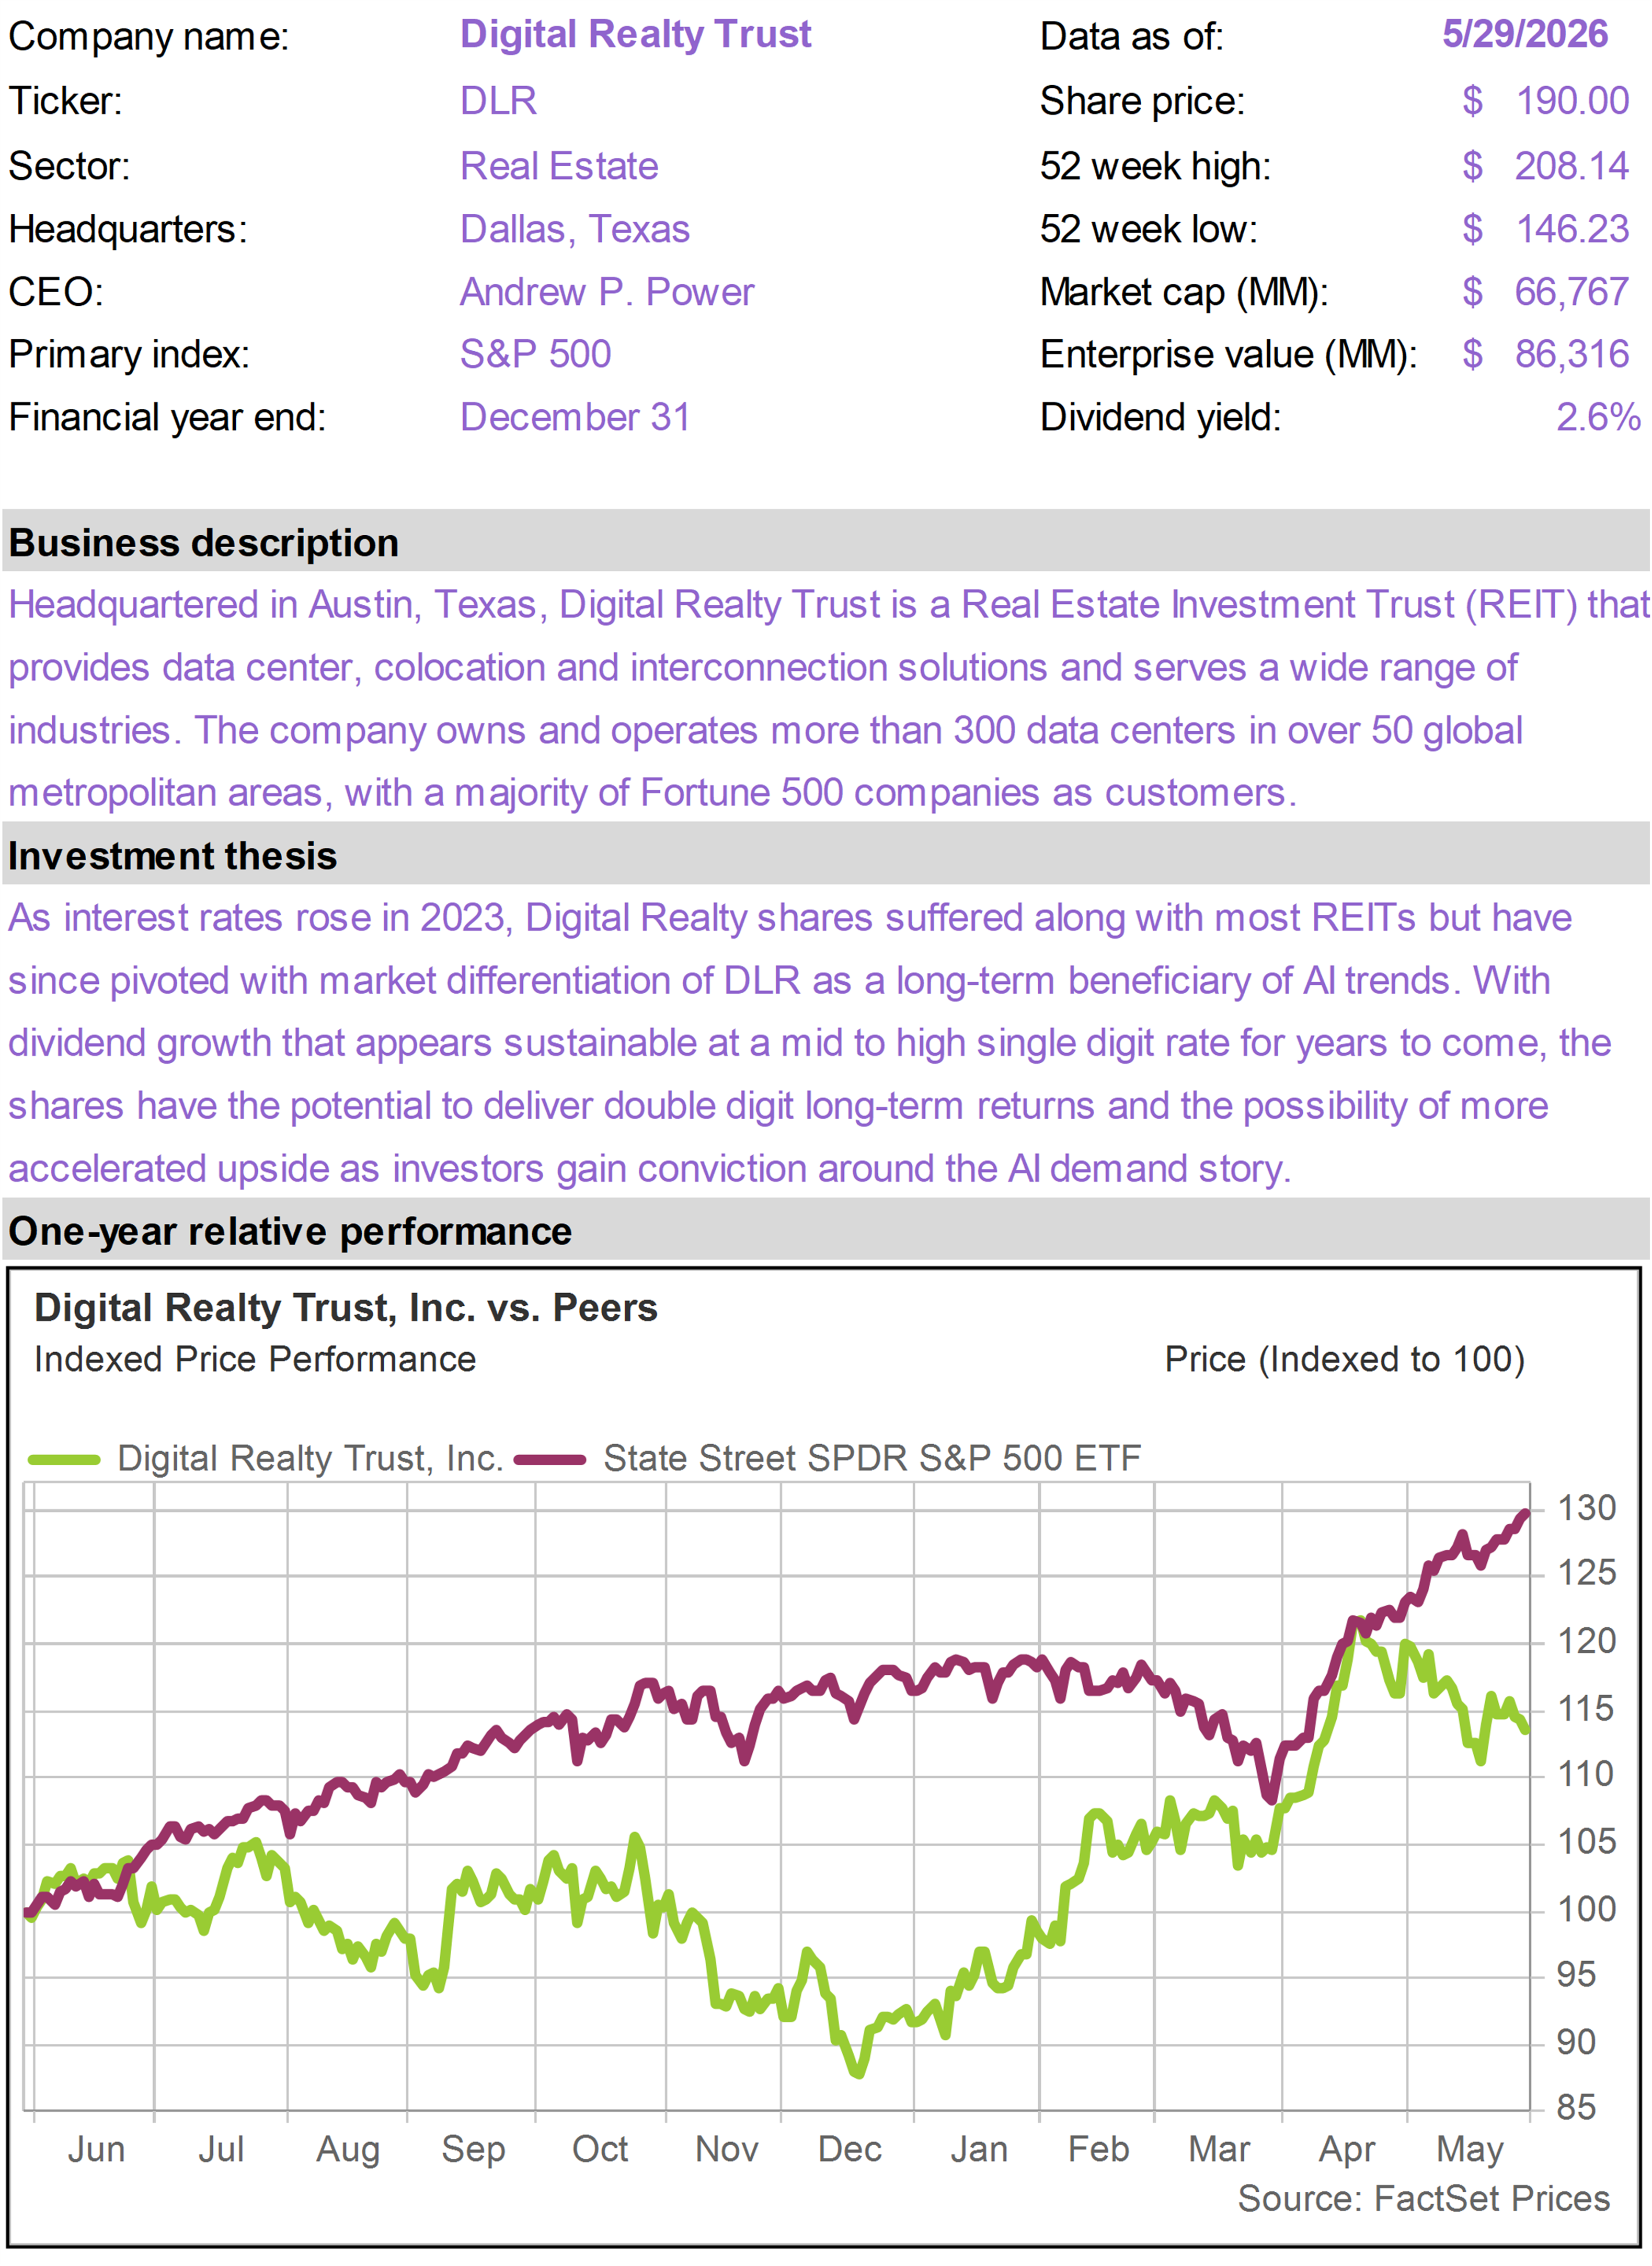
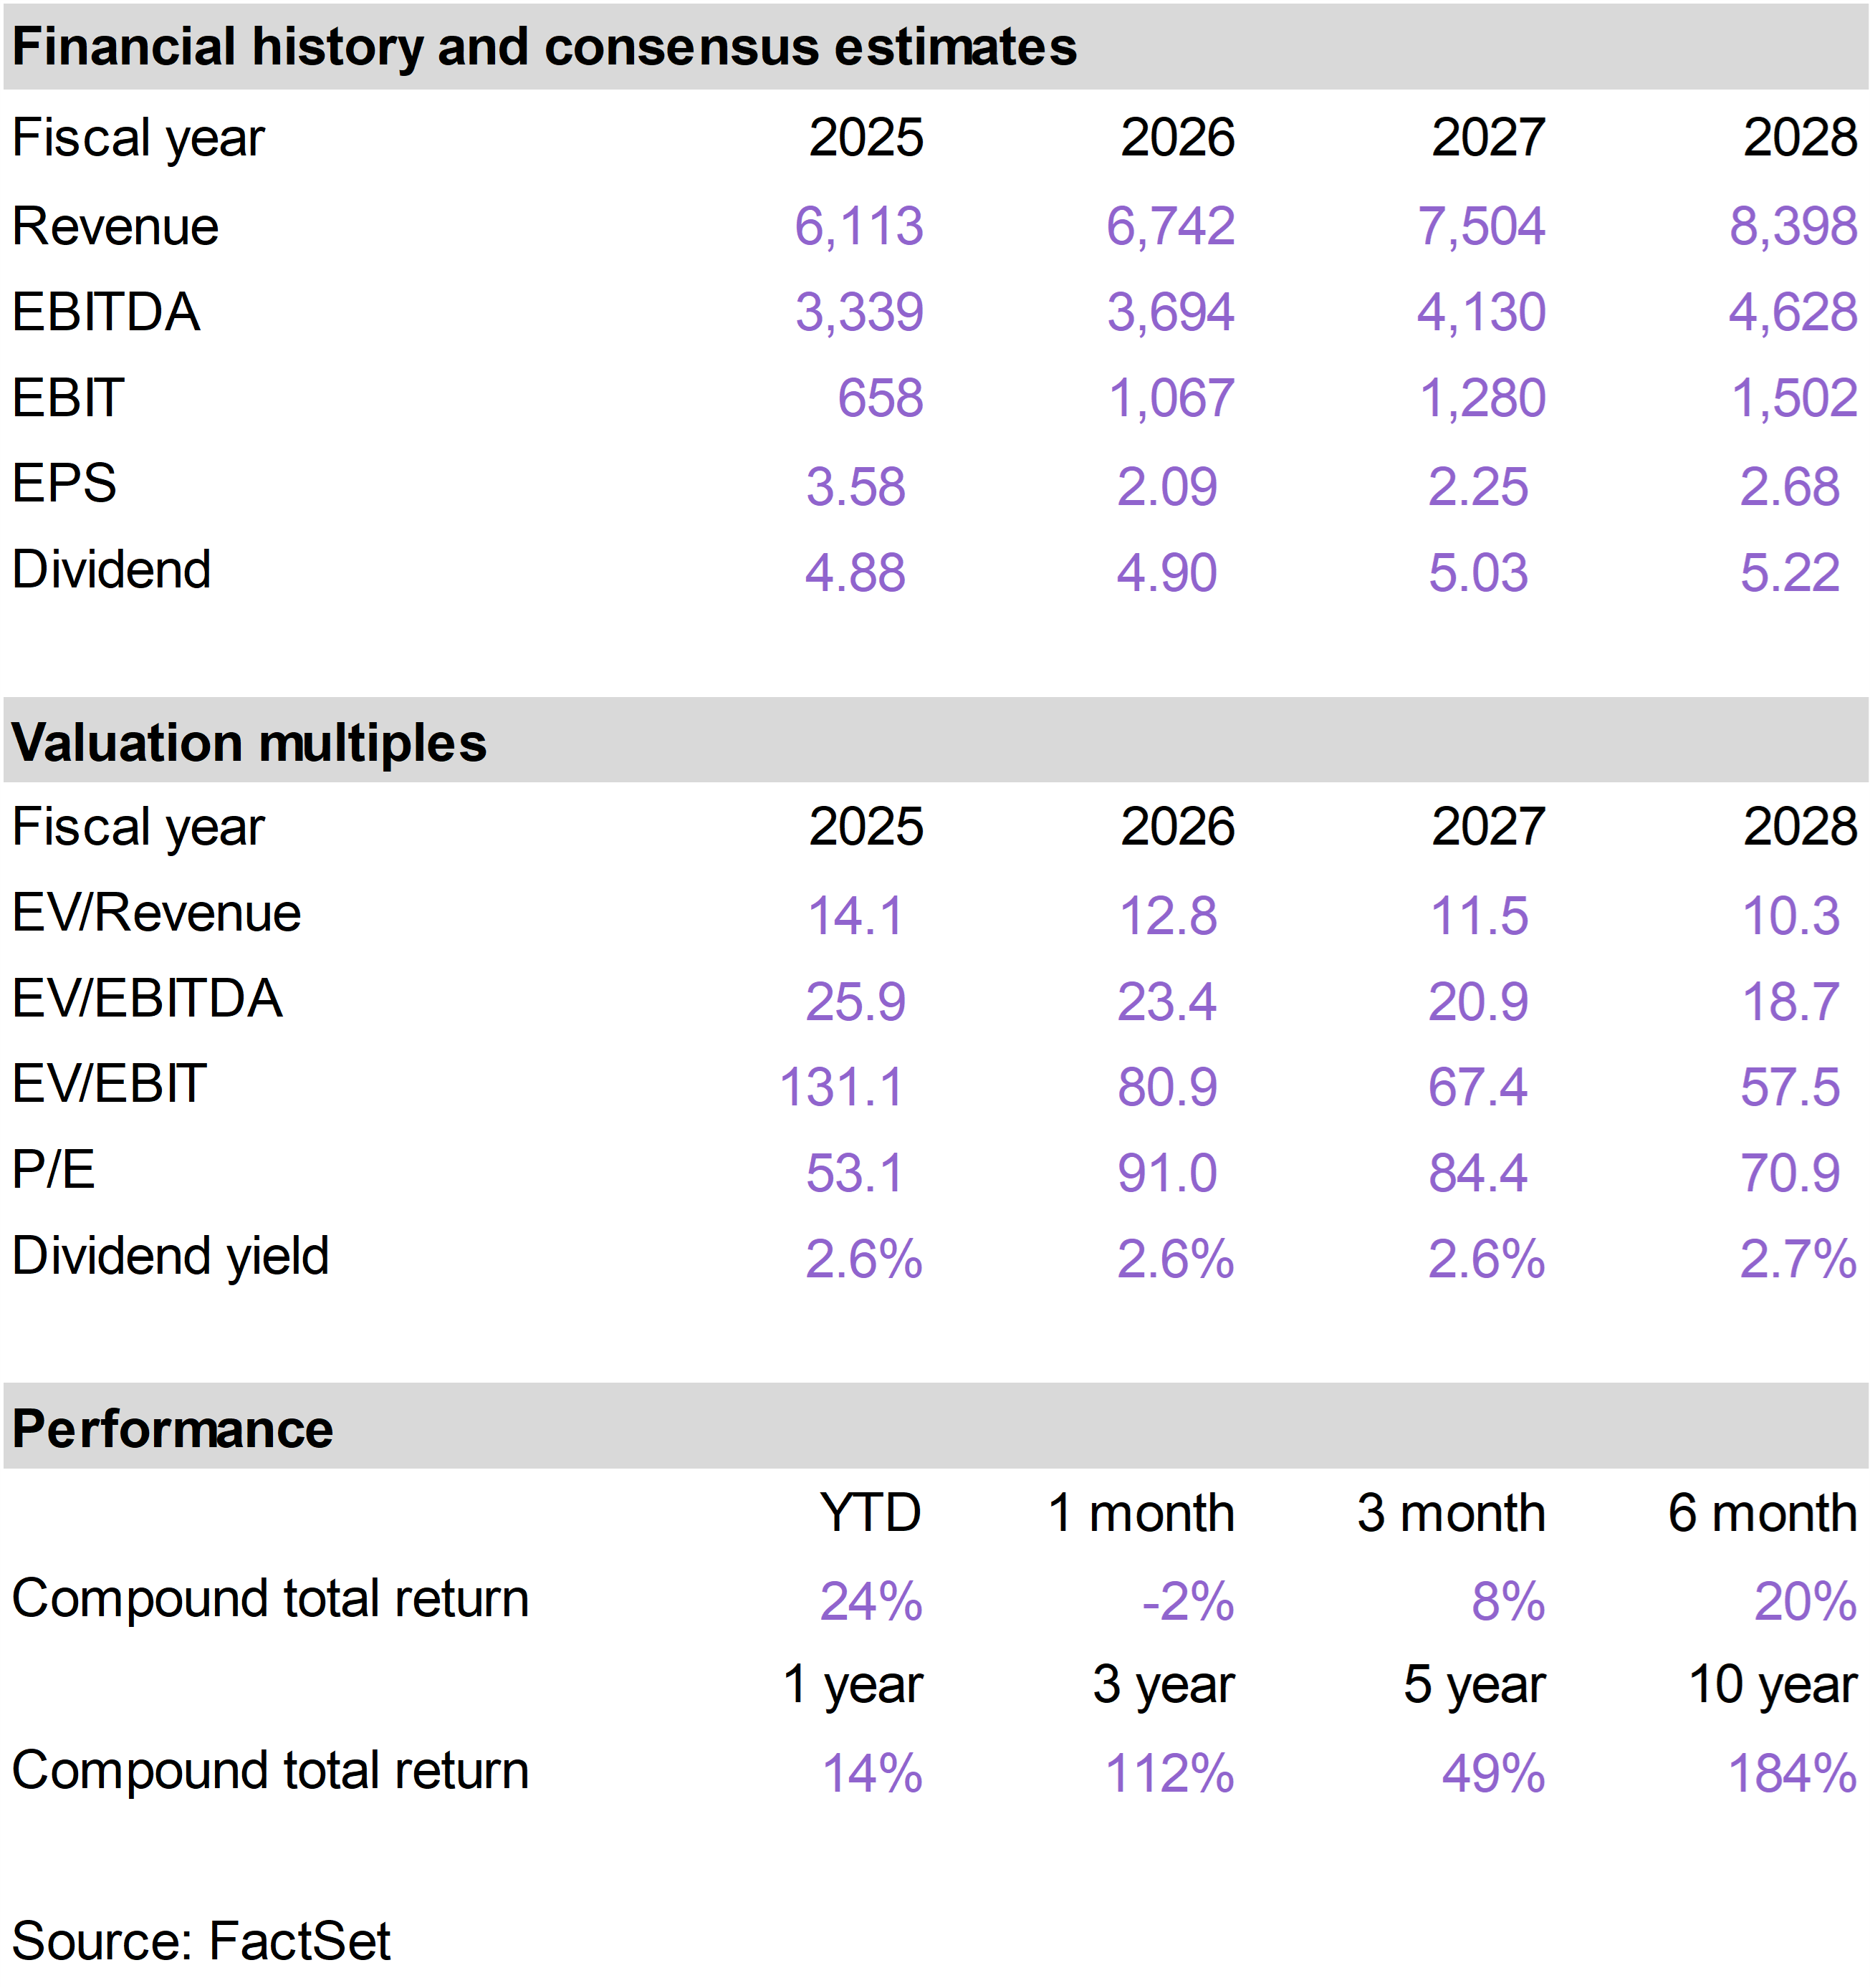
We highlighted the ongoing transition from training to inference in our recent discussion of Digital Realty Trust (DLR) in the 76report (Why NVIDIA’s Bold Move Into CPUs Is Bullish for This Income Builder Stock).
DLR is the pure-play on this trend, owning hundreds of data centers across the country that represent the physical backbone of AI inference infrastructure.
But AI inference is unlikely to be confined to traditional data centers. As AI becomes embedded in vehicles, factories, mobile devices, and industrial equipment, compute capacity will increasingly need to move closer to where information is generated and consumed.
This creates a potentially compelling opportunity for both CCI and PLD, in different ways.
CCI's extensive portfolio of cell towers and fiber assets serve as ideal locations for edge computing deployments, allowing AI applications to process information with lower latency and greater efficiency.
Meanwhile, PLD is actively pursuing the conversion and redevelopment of portions of its vast industrial footprint into data center infrastructure.
As AI inference becomes more distributed throughout the economy, PLD's strategically located real estate portfolio is becoming increasingly valuable not only for logistics operations, but also for housing the computing infrastructure that supports AI-enabled commerce and automation. |
|
| |
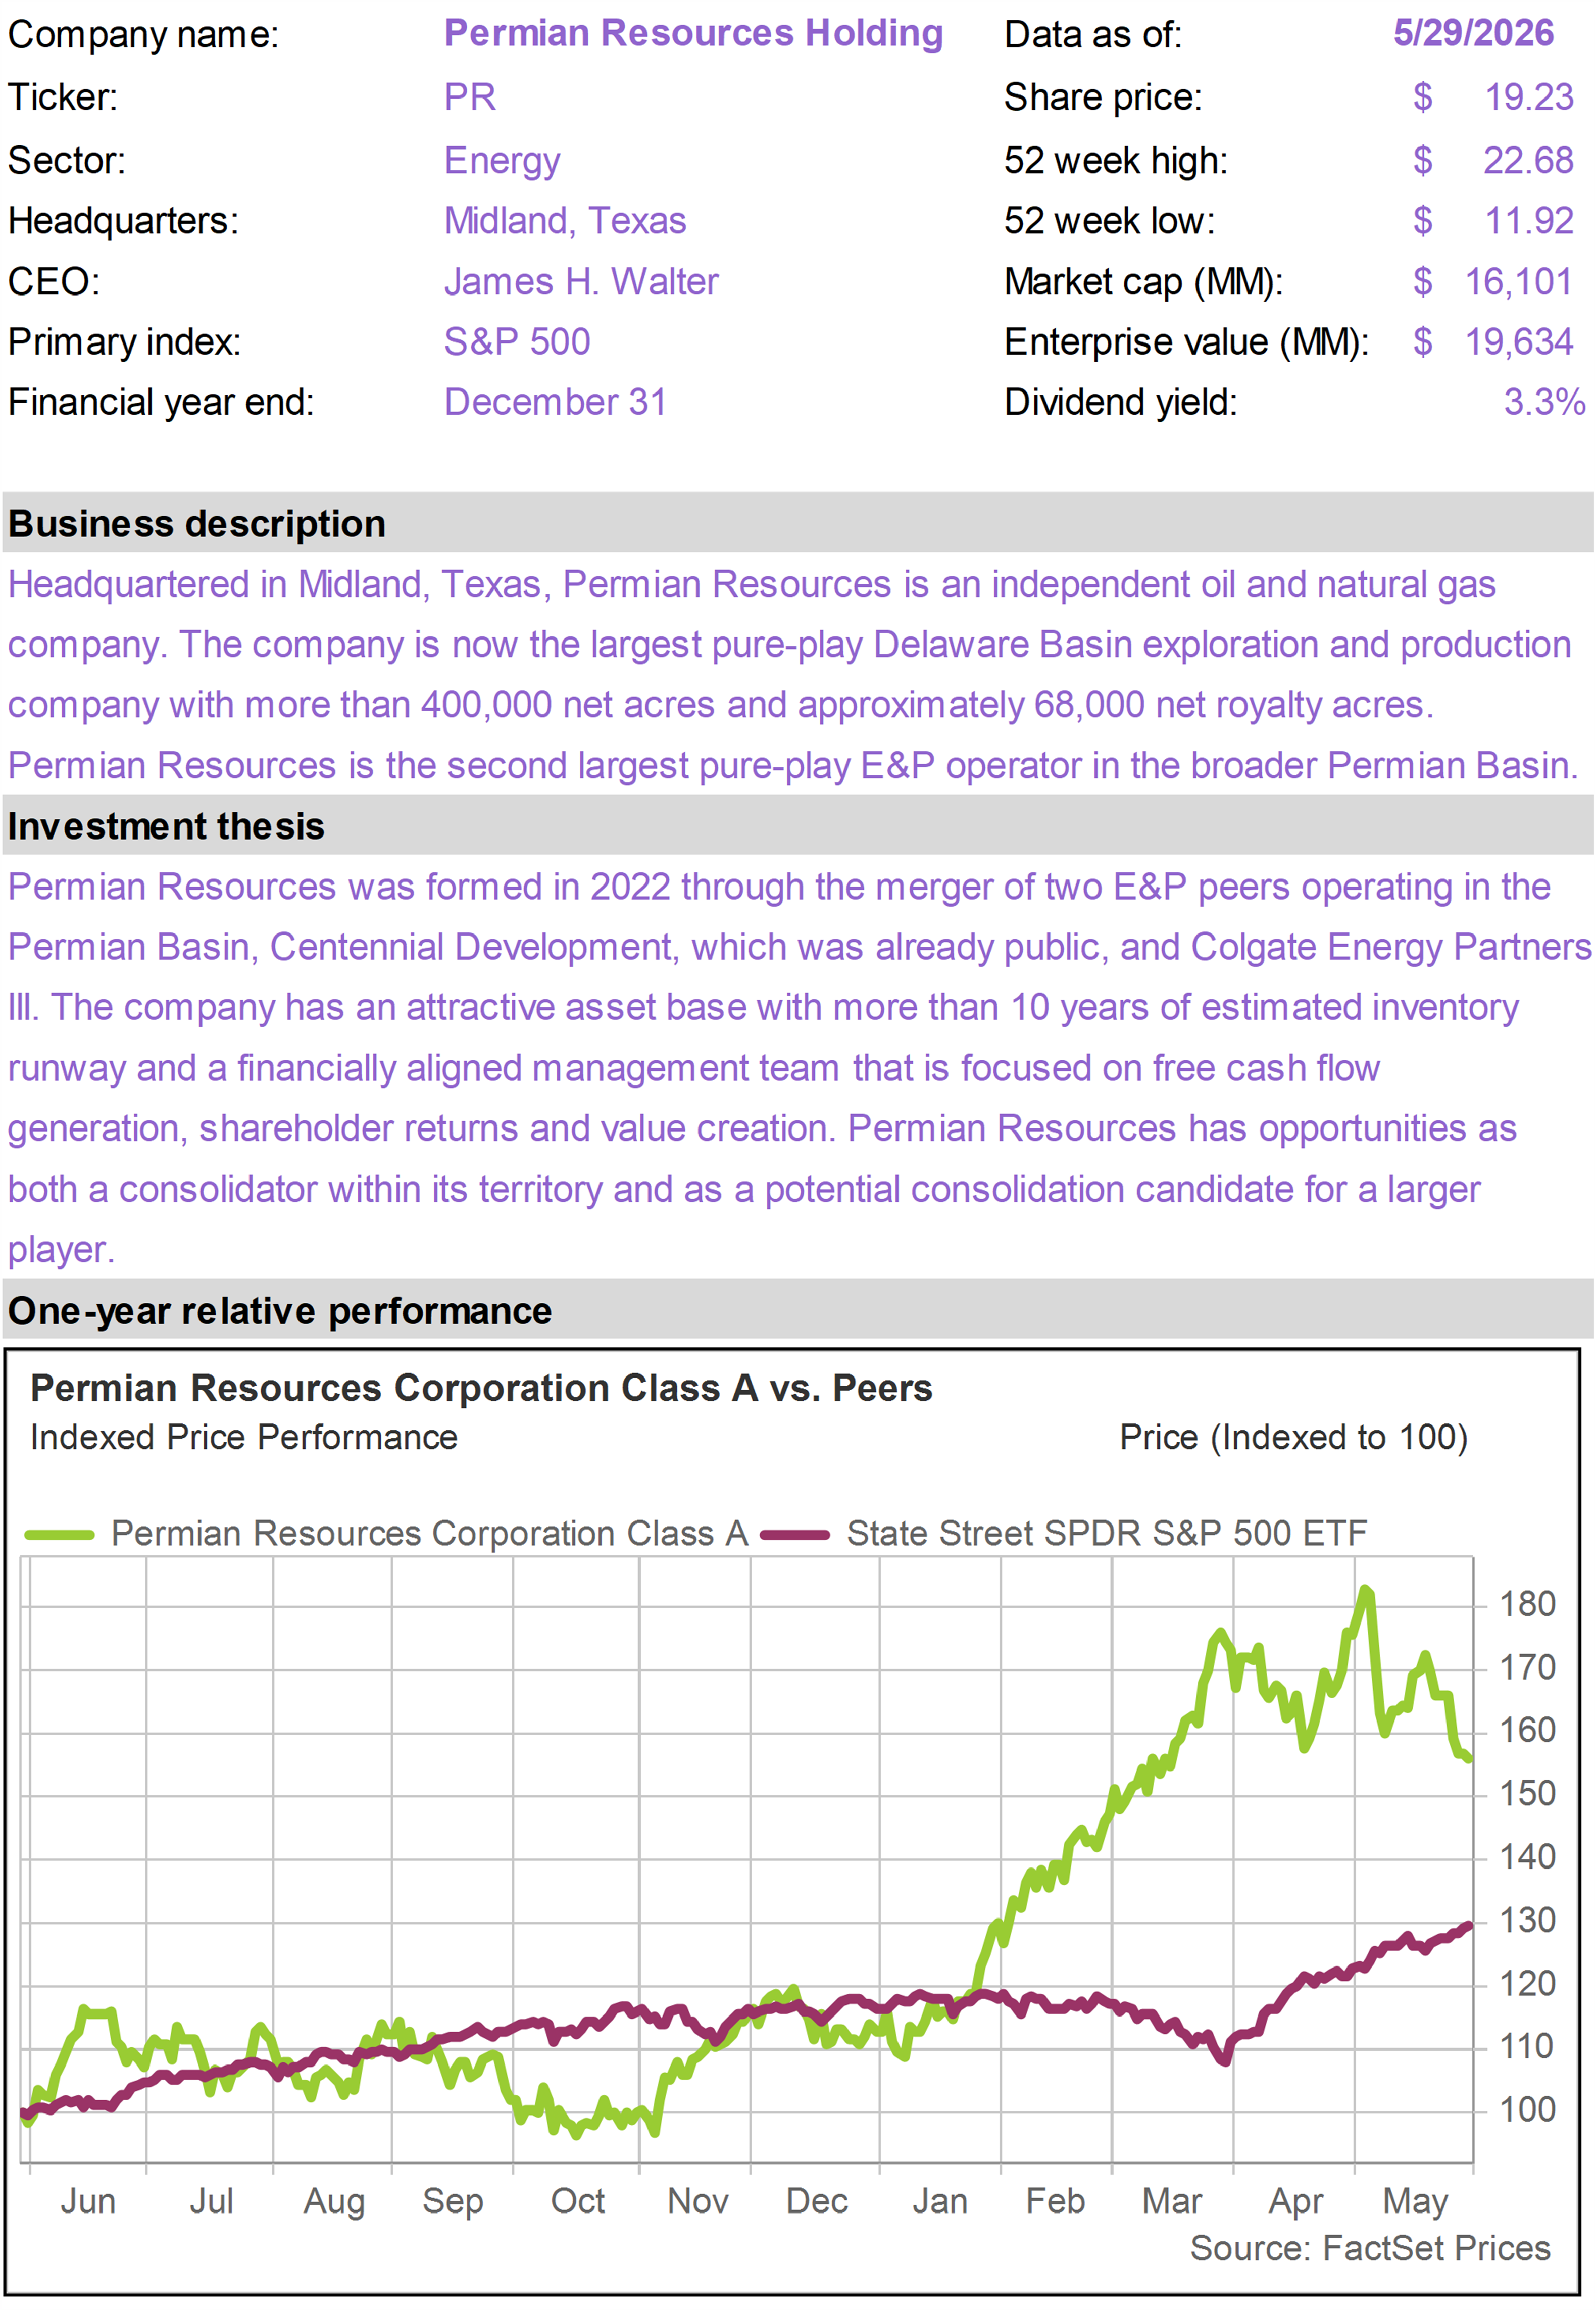
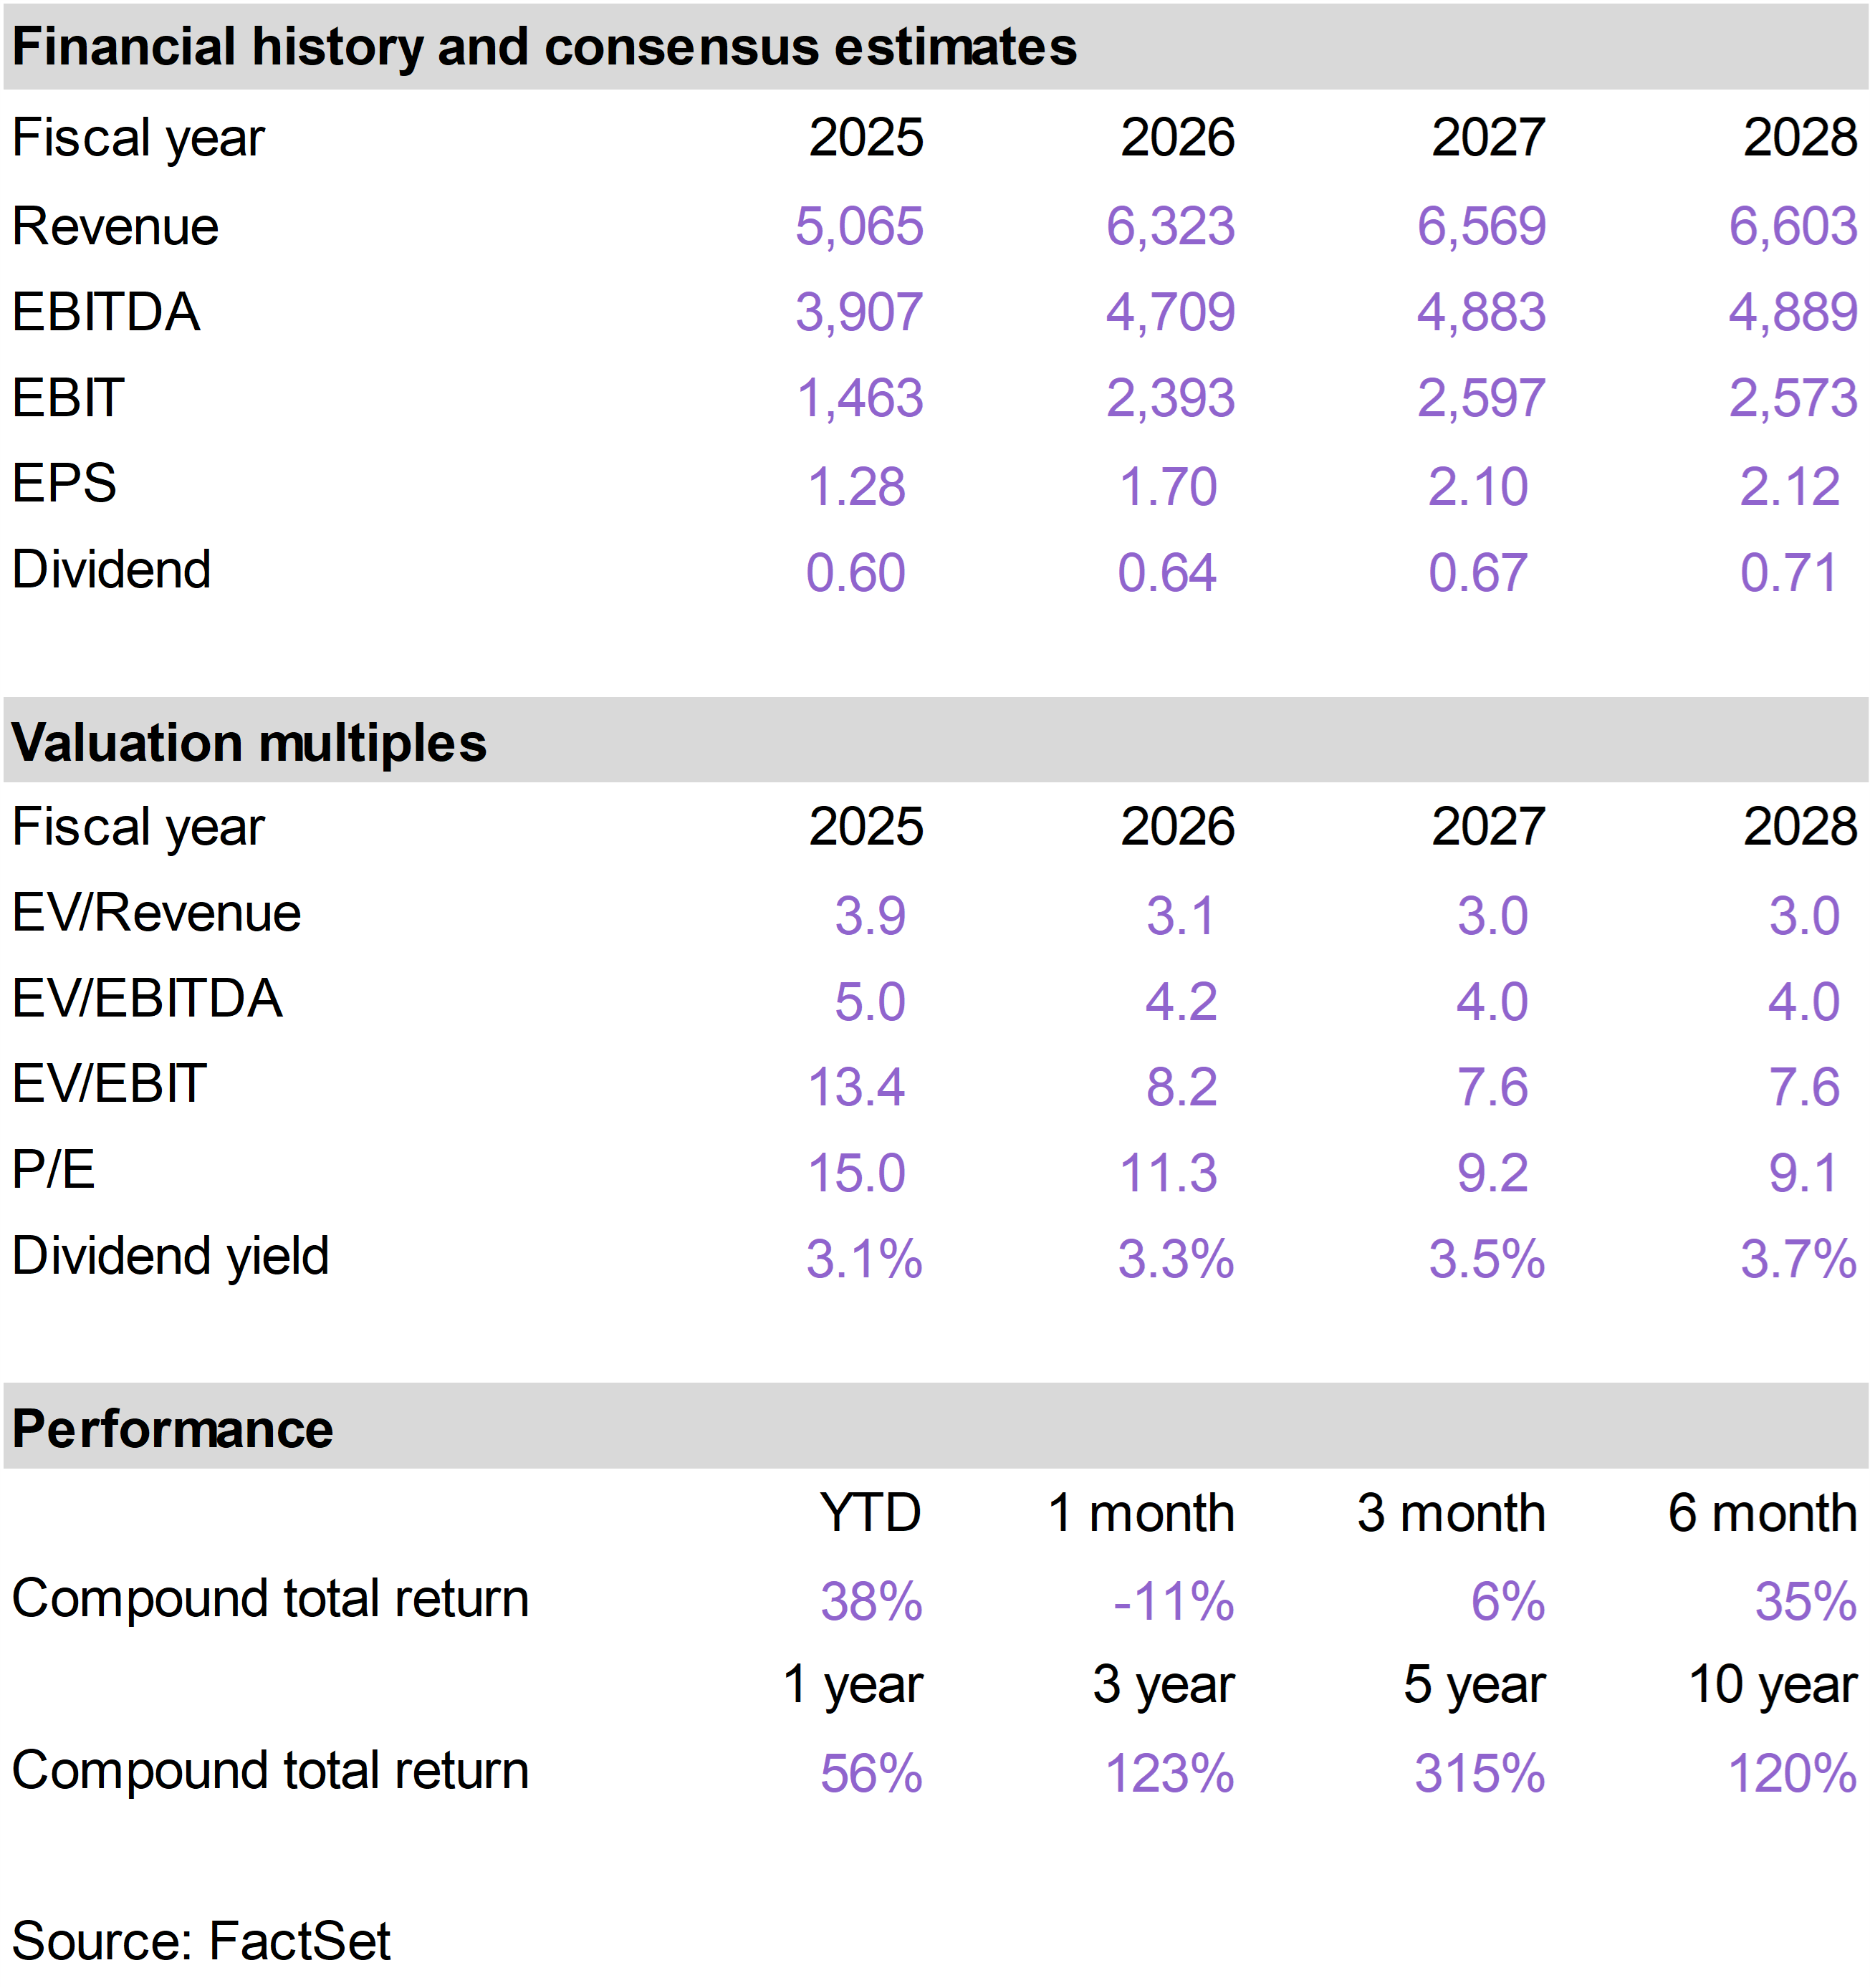
PR retreated this month as oil prices declined and the energy sector lagged, following an extended period of outperformance. On a year to date basis, PR has returned 38%, despite this month’s pullback.
While oil prices are inherently volatile, we continue to view PR as a long-term beneficiary of U.S. energy dominance, supported by attractive assets, a strong balance sheet, and significant free cash flow generation.
PR reported a strong first quarter in May, increasing its full-year oil production outlook while maintaining spending discipline. Management highlighted continued improvements in drilling efficiency and indicated that the company has the flexibility to grow production further if market conditions remain favorable.
PR continues to generate substantial cash flow while carefully managing the balance sheet to preserve flexibility for future acquisitions. |
|
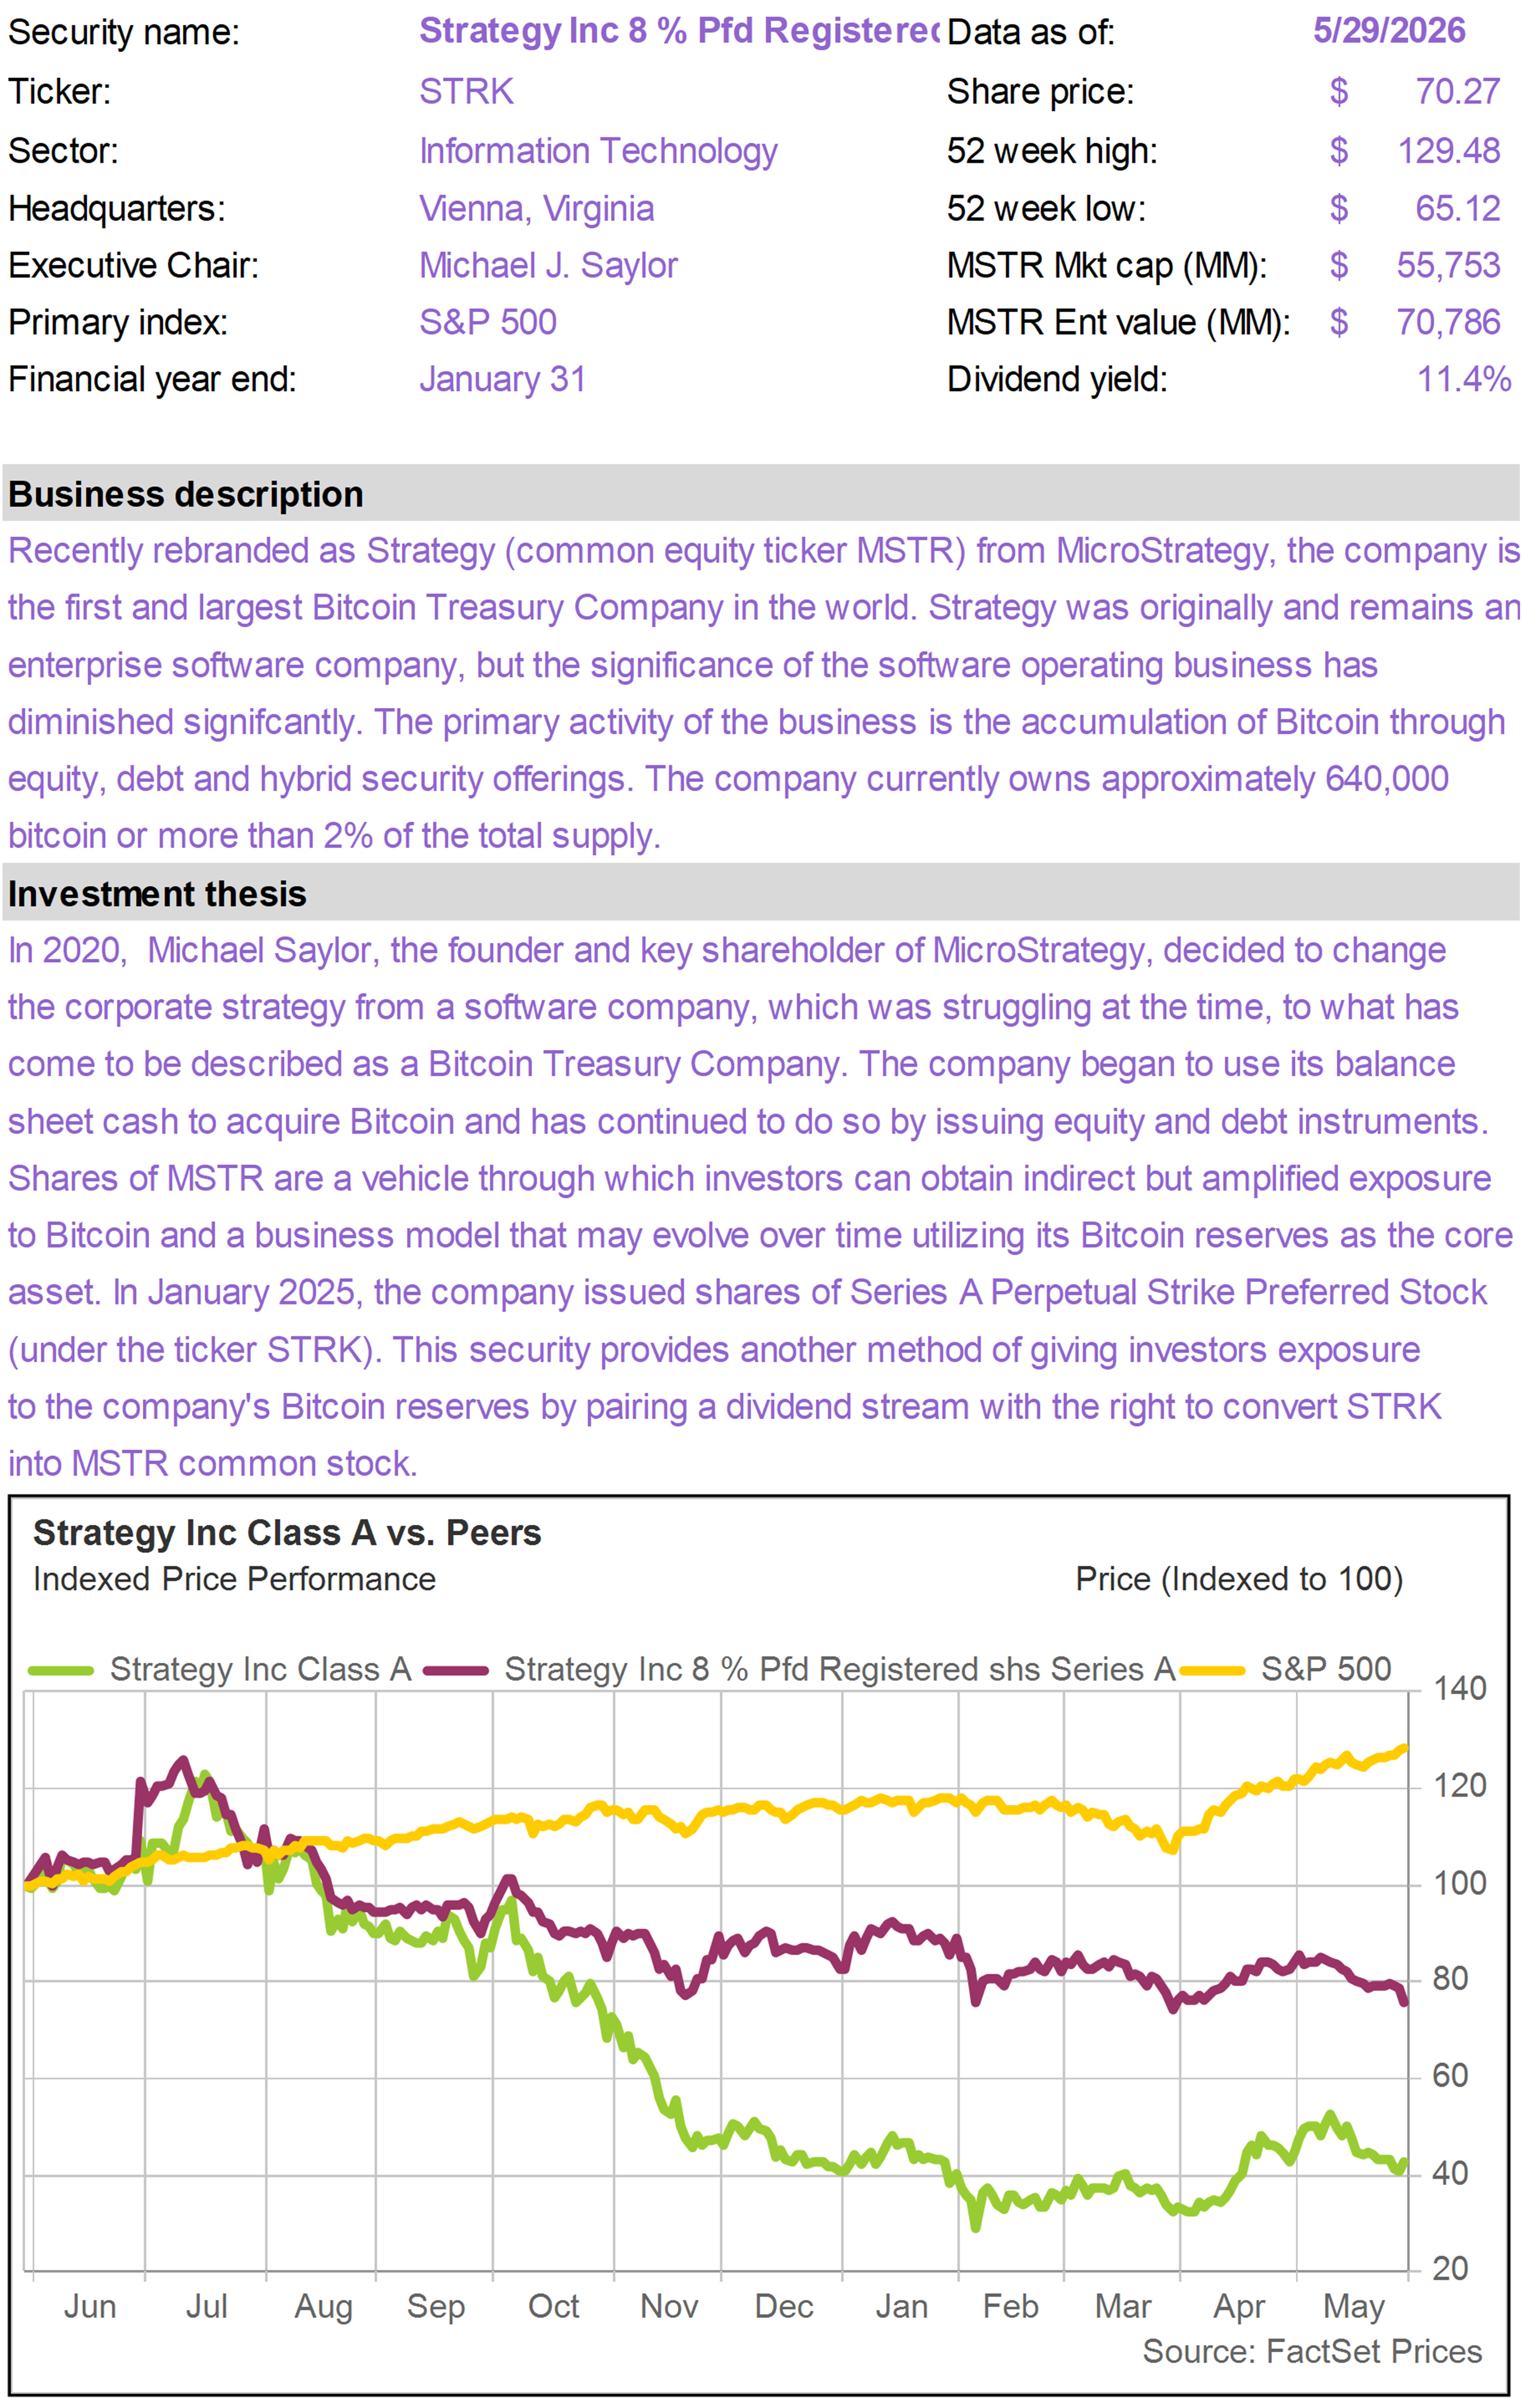
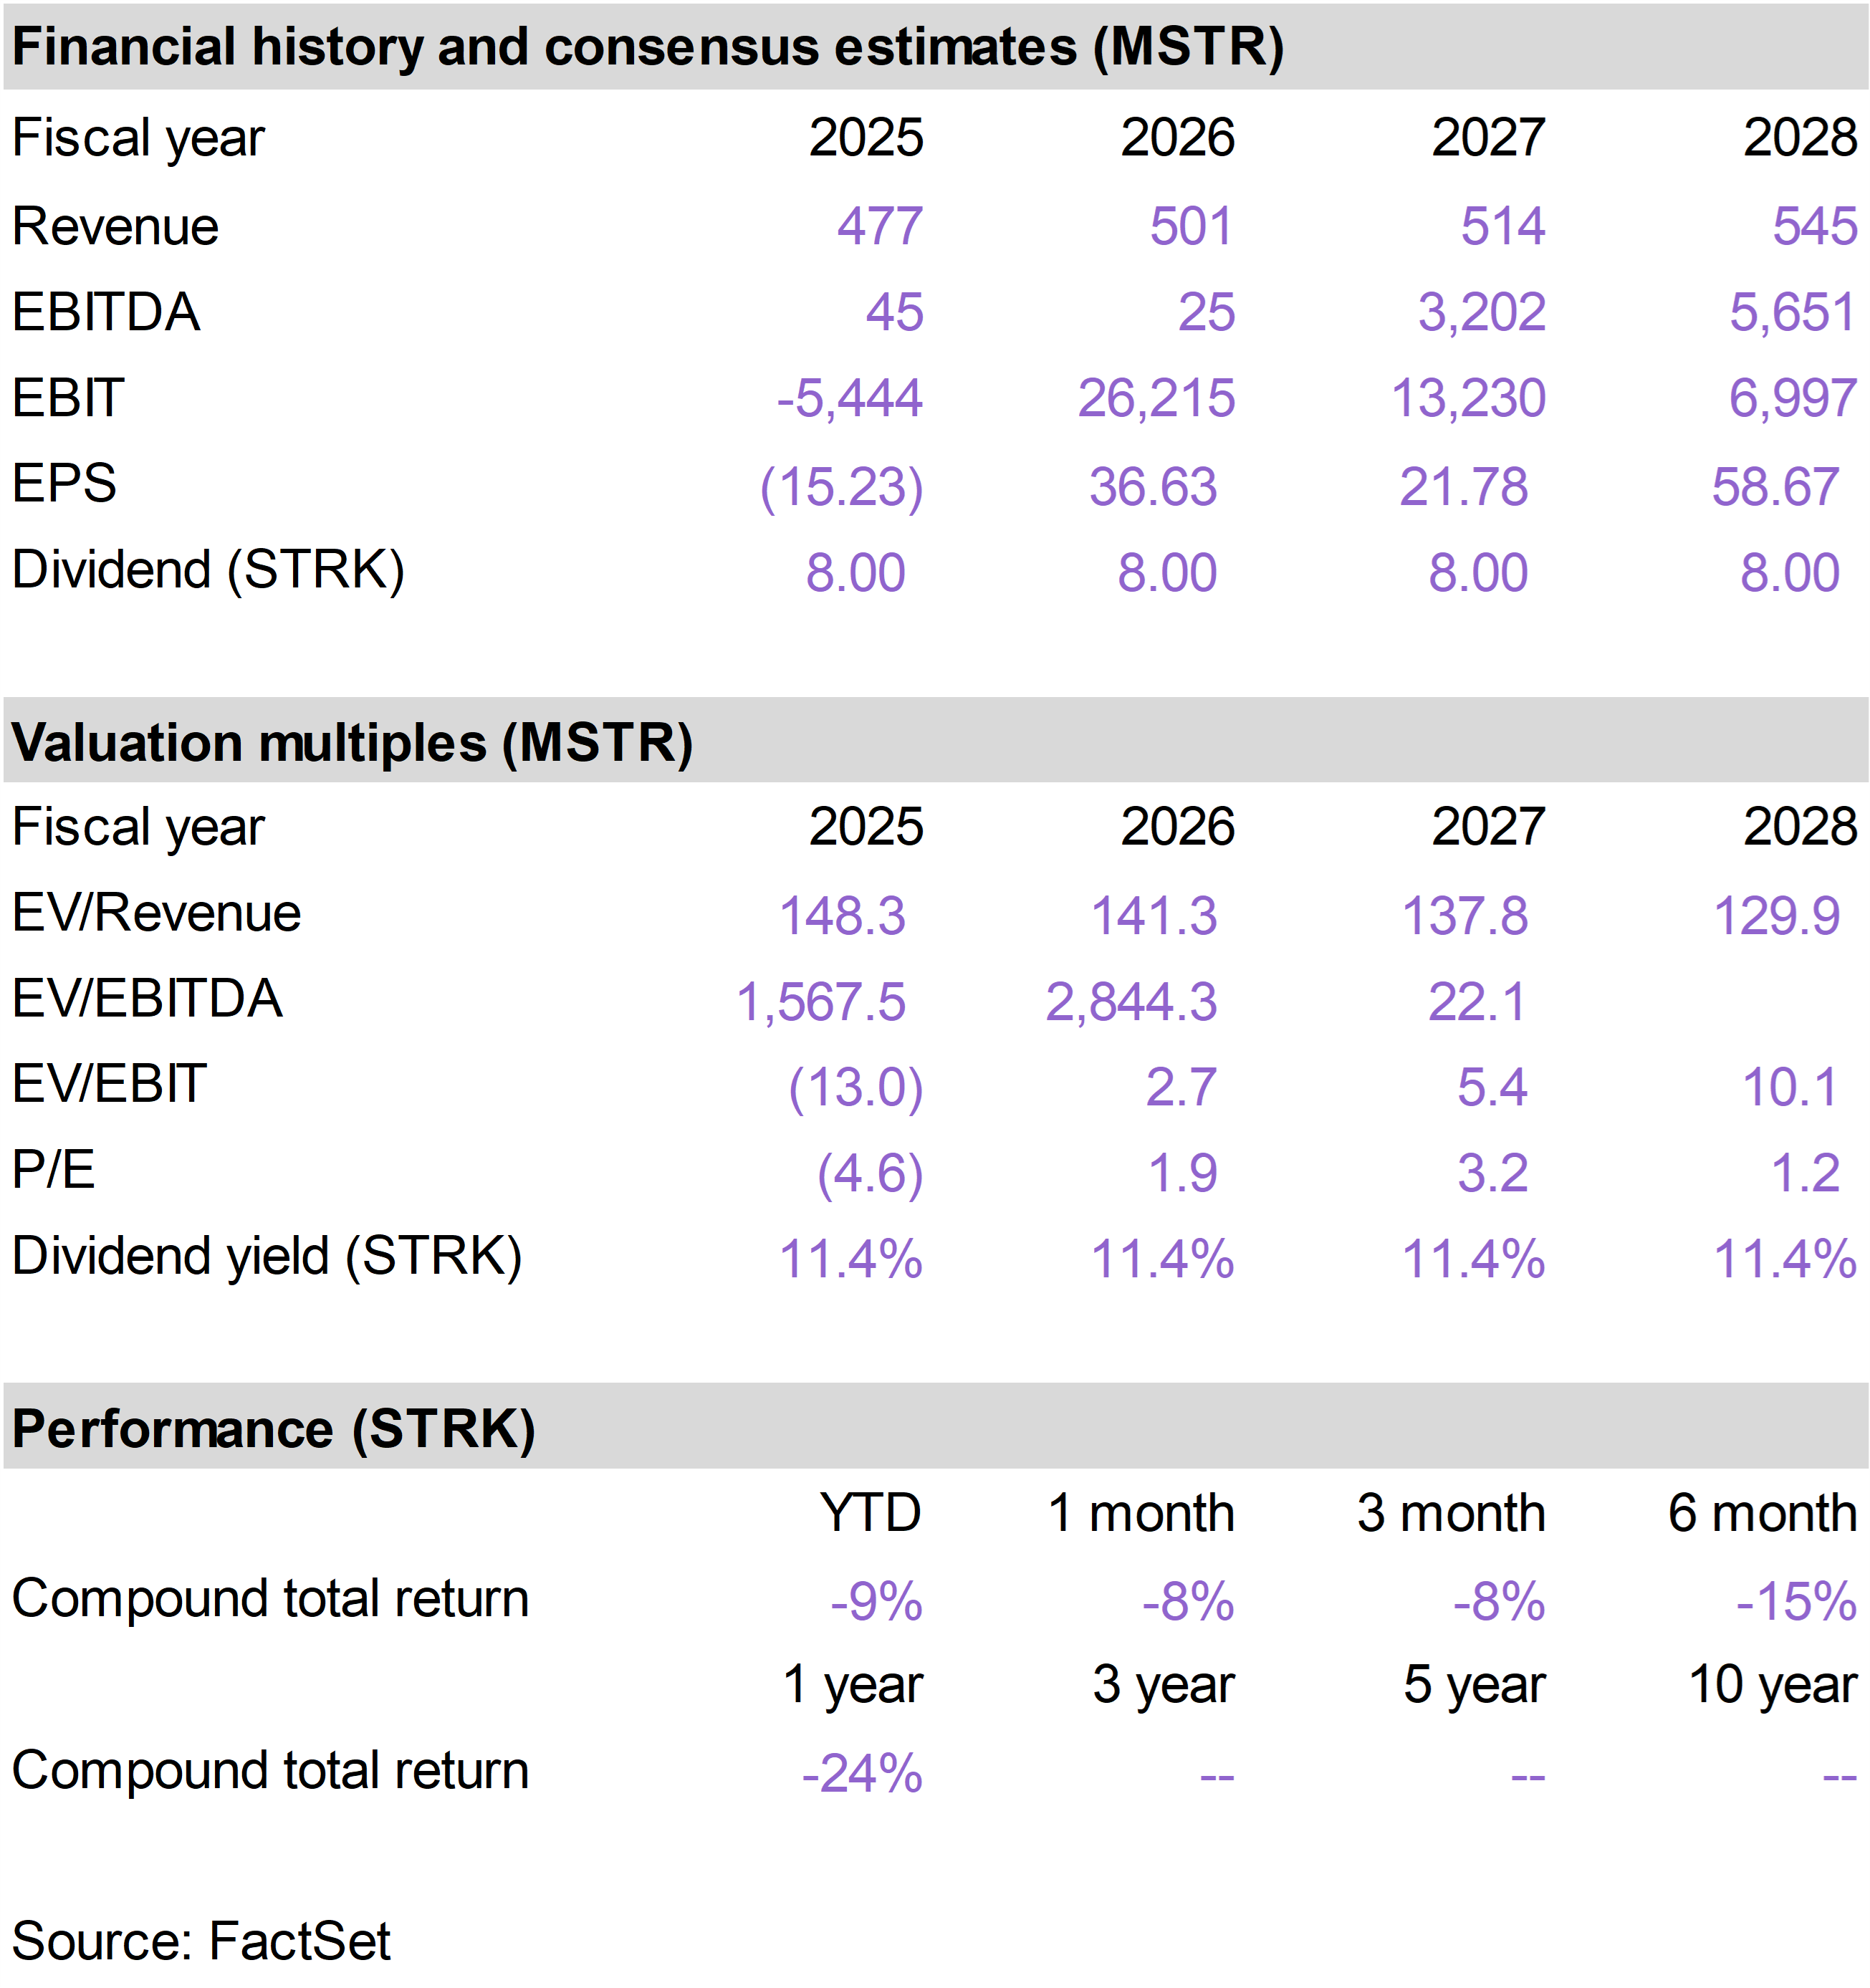
| | STRK declined this month, as sentiment toward Bitcoin remains shaky and preferred stock instruments in general came under pressure from rising rates.
Strategy (MSTR) has de-emphasized its longer duration preferred stock instruments like STRK, STRF and STRD and is now focusing almost exclusively on STRC, through which it is actively raising capital.
STRC differs from the other instruments in that it has a variable dividend that can be adjusted month to month, with the goal of preserving price stability.
On a recent podcast, the company’s founder, Michael Saylor, noted that one reason they are not focused on issuing more of the fixed dividend instruments to the public is that they believe they are undervalued.
Unlike STRC, STRK has a fixed dividend that cannot be modified. At its current share price, the dividend yield is just over 11%. Investors in STRK also have the perpetual right to convert their shares into MSTR common shares—a valuable call option in a scenario where MSTR common stock appreciates significantly.
With all the attention now paid to STRC, which allows Saylor to raise capital in a more flexible manner, STRK is arguably being neglected by the market.
So long as the dividend gets paid, which we expect, we do not view this as a problem, but rather an opportunity.
We agree with Saylor that STRK is undervalued and offers an unusually high income stream with valuable conversion potential. For more on STRC and STRK, we refer subscribers to our recent discussion of the topic on our YouTube channel. |
|
| |
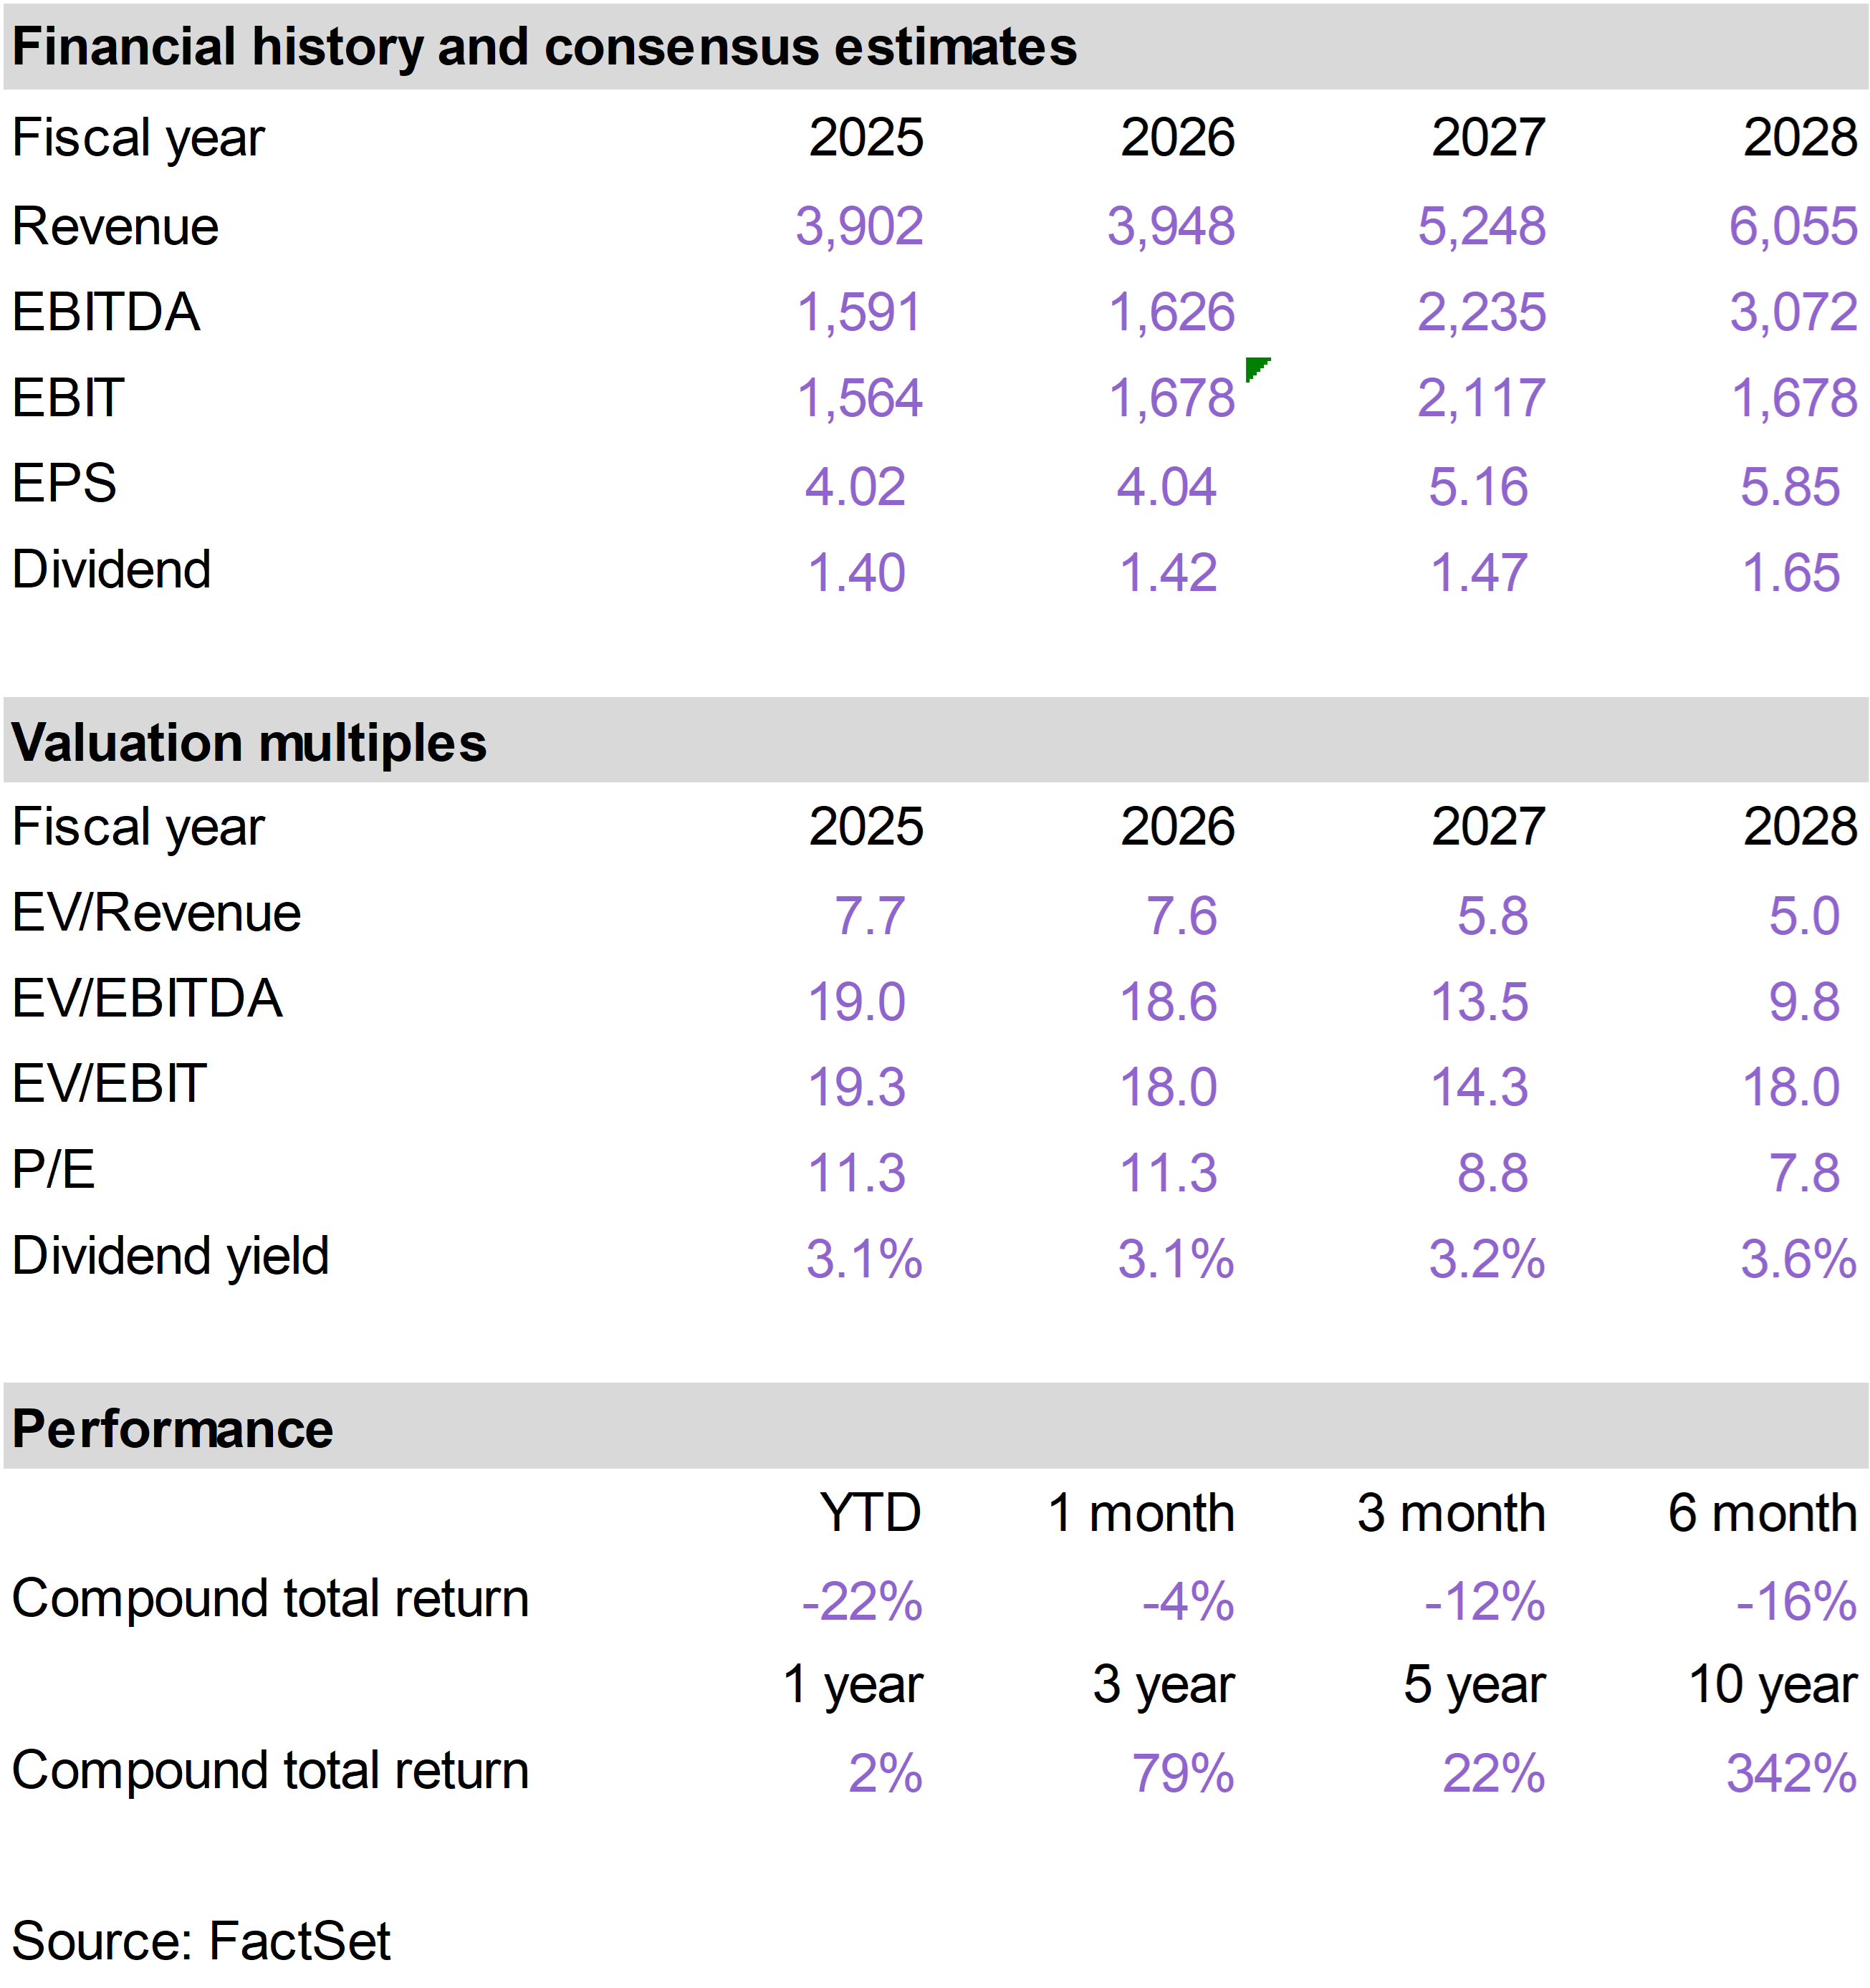
CG declined in May after earnings disappointed. While first quarter results came in below expectations, we believe the market may have overreacted to what appears to be a temporary slowdown rather than a deterioration in the company's long-term outlook.
Management reiterated confidence in its multi-year growth targets and highlighted an improving fundraising environment, with several large funds expected to come to market over the next few years. The company also expects stronger fee-related earnings growth as new funds begin contributing management fees.
We were also encouraged by management's comments regarding future realization activity. While the timing of asset sales remains uneven, CG sees an improving pipeline of opportunities to monetize investments, which could support earnings growth as 2026 progresses.
Recent volatility presents a difficult environment for alternative asset managers, but CG remains well positioned to benefit from recovering private market activity and a growing base of recurring fee revenue. |
|
| | | |
| | |
| | |
| | | |
|
| | Digital Realty Trust (DLR) |
|
|
|
| | |
|
| | |
|
| | |
|
| | |
|
| | |
|
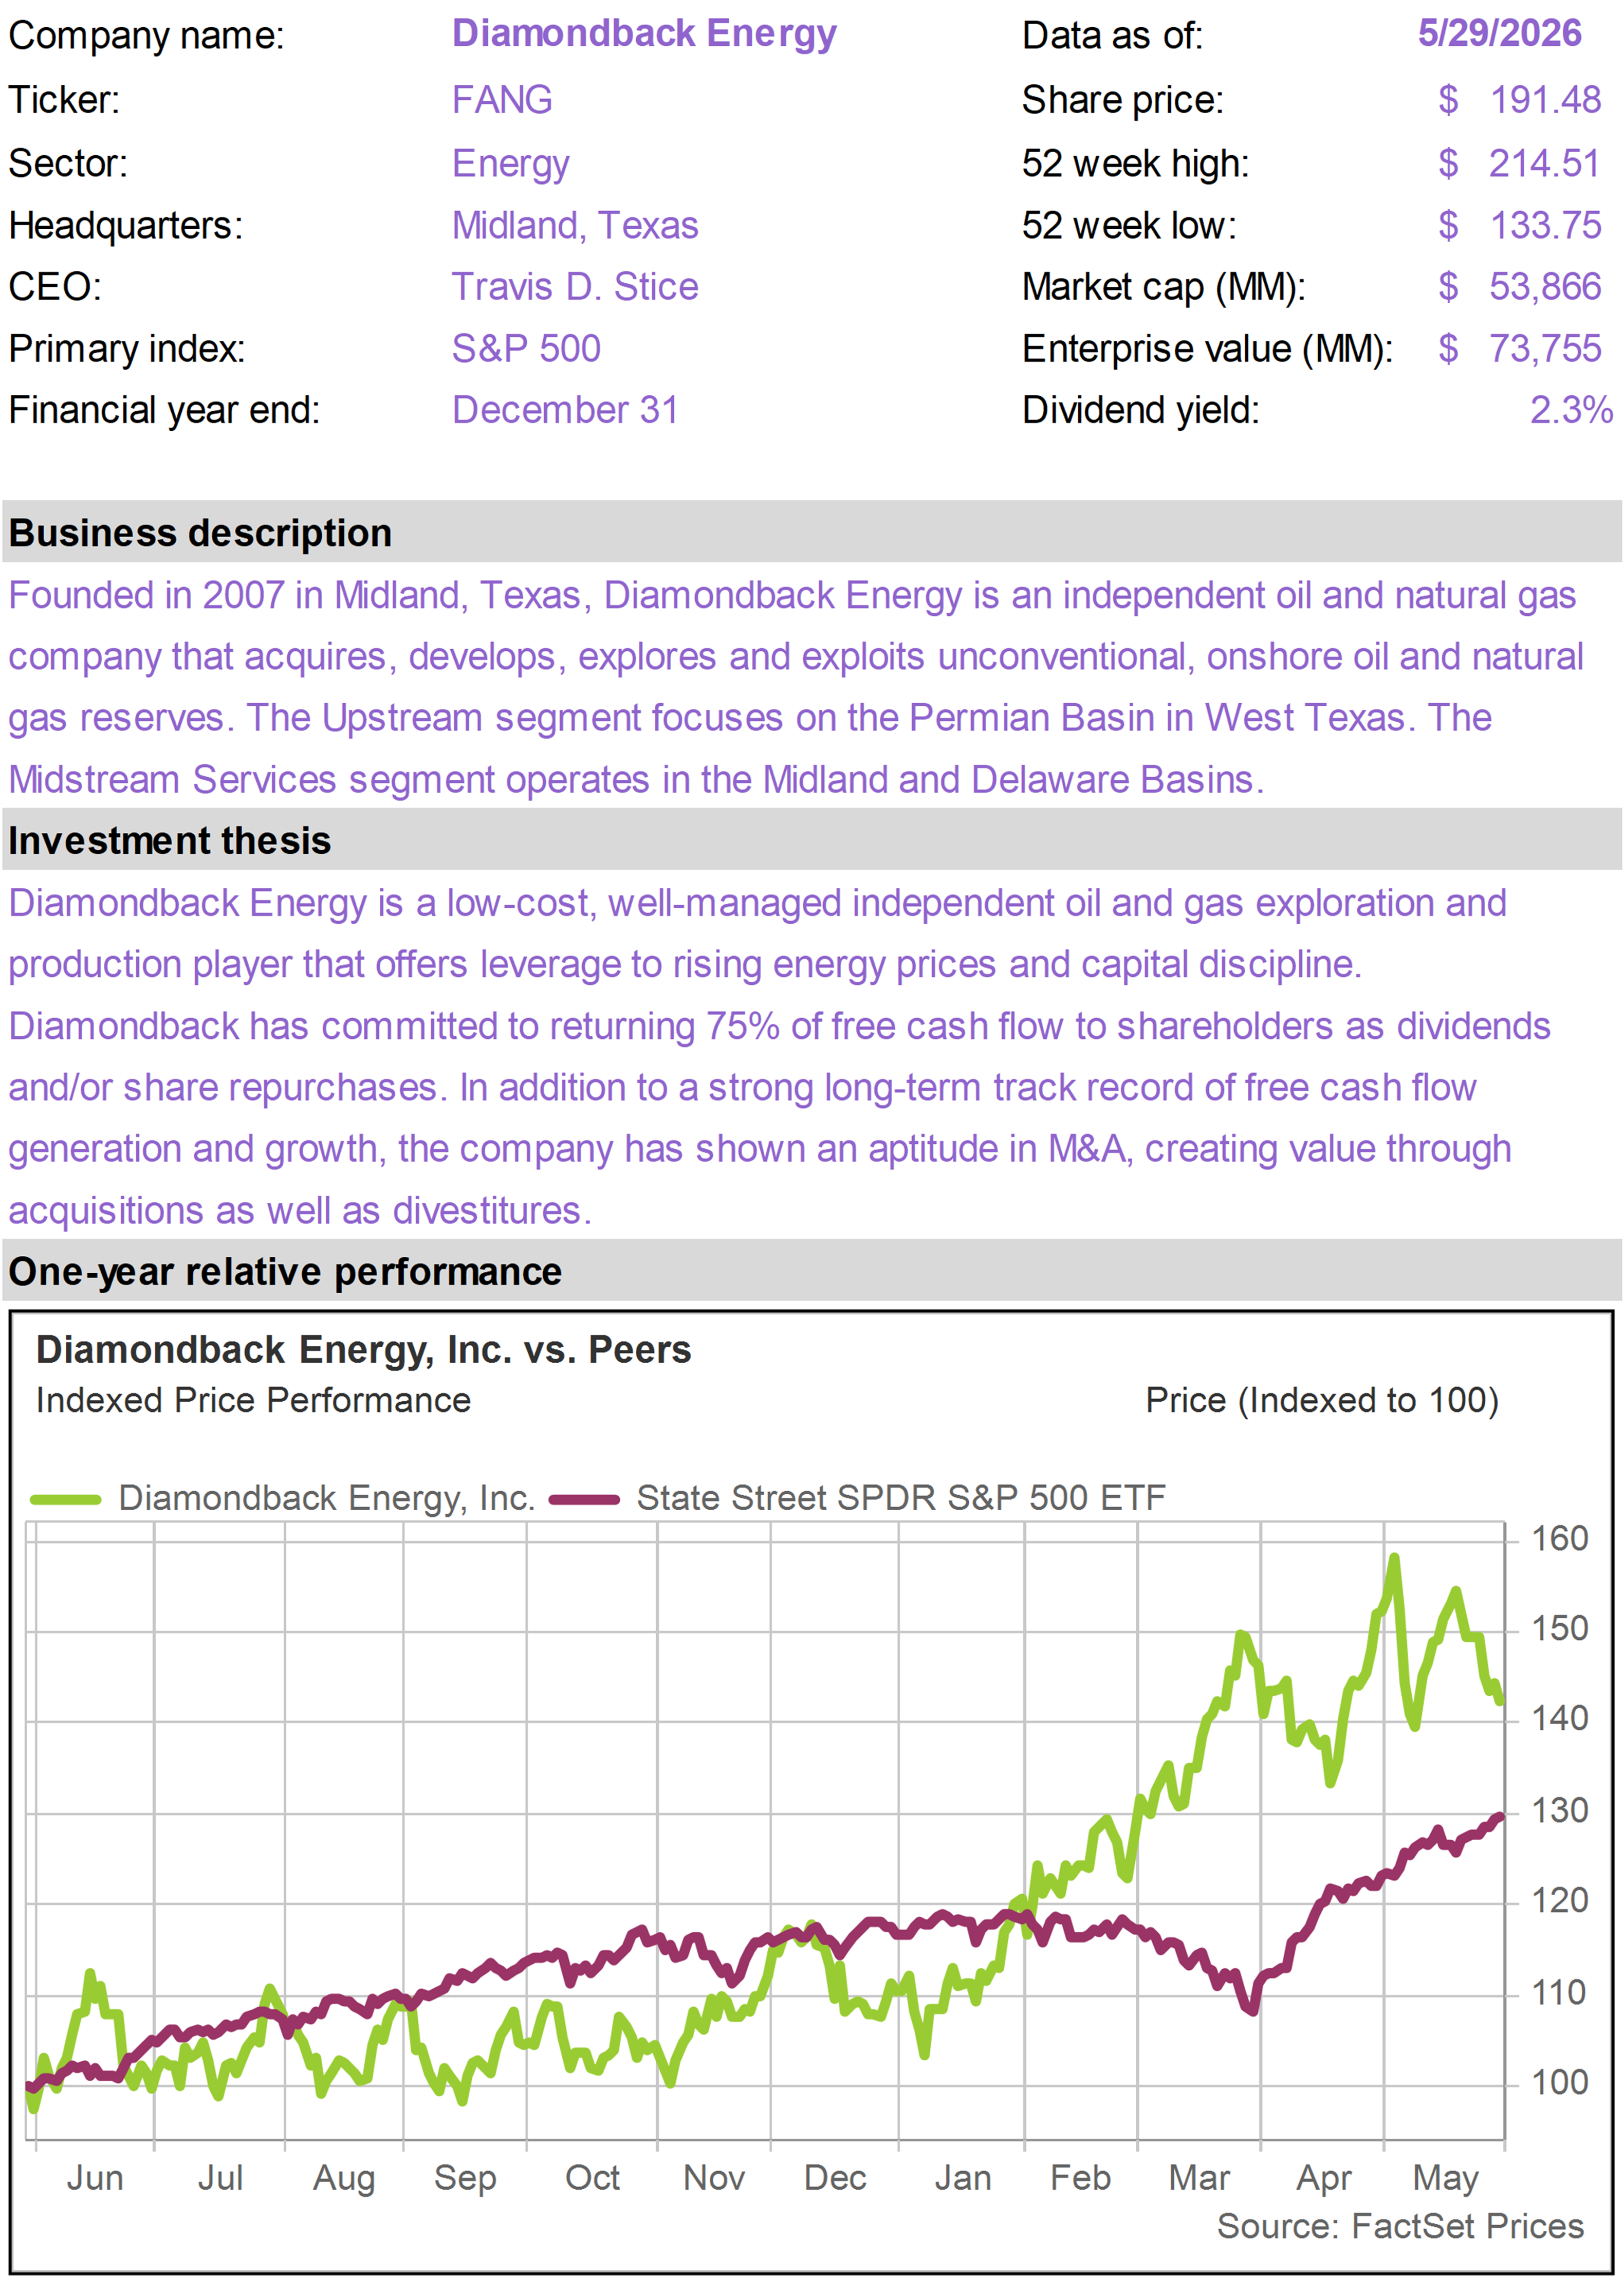
| | Diamondback Energy (FANG) |
|
|
|
| | |
|
| | Mid-America Apartment (MAA) |
|
|
|
| | |
|
| | |
|
| | |
|
| | Strategy 8% Perpetual Pref (STRK) |
|
|
|
| | |
|
| | The 76research Income Builder Model Portfolio is intended for income-oriented investors and managed to generate an overall yield that is materially higher than broad equity indices. The portfolio includes stocks with above average dividend yields from a cross section of industries. While investments are screened for their income and income growth characteristics, specific holdings are chosen based on valuation and general business quality, growth and risk considerations. |
|
| | FOR SUBSCRIBER USE ONLY. DO NOT FORWARD OR SHARE. |
|
| | | |
|
|
|
|
|