| Income Builder Model Portfolio |
|
| Monthly Portfolio Review: March 2026Publication date: April 5, 2026 |
|
| | | Current portfolio holdings |
|
|
| | FOR SUBSCRIBER USE ONLY. DO NOT FORWARD OR SHARE. |
|
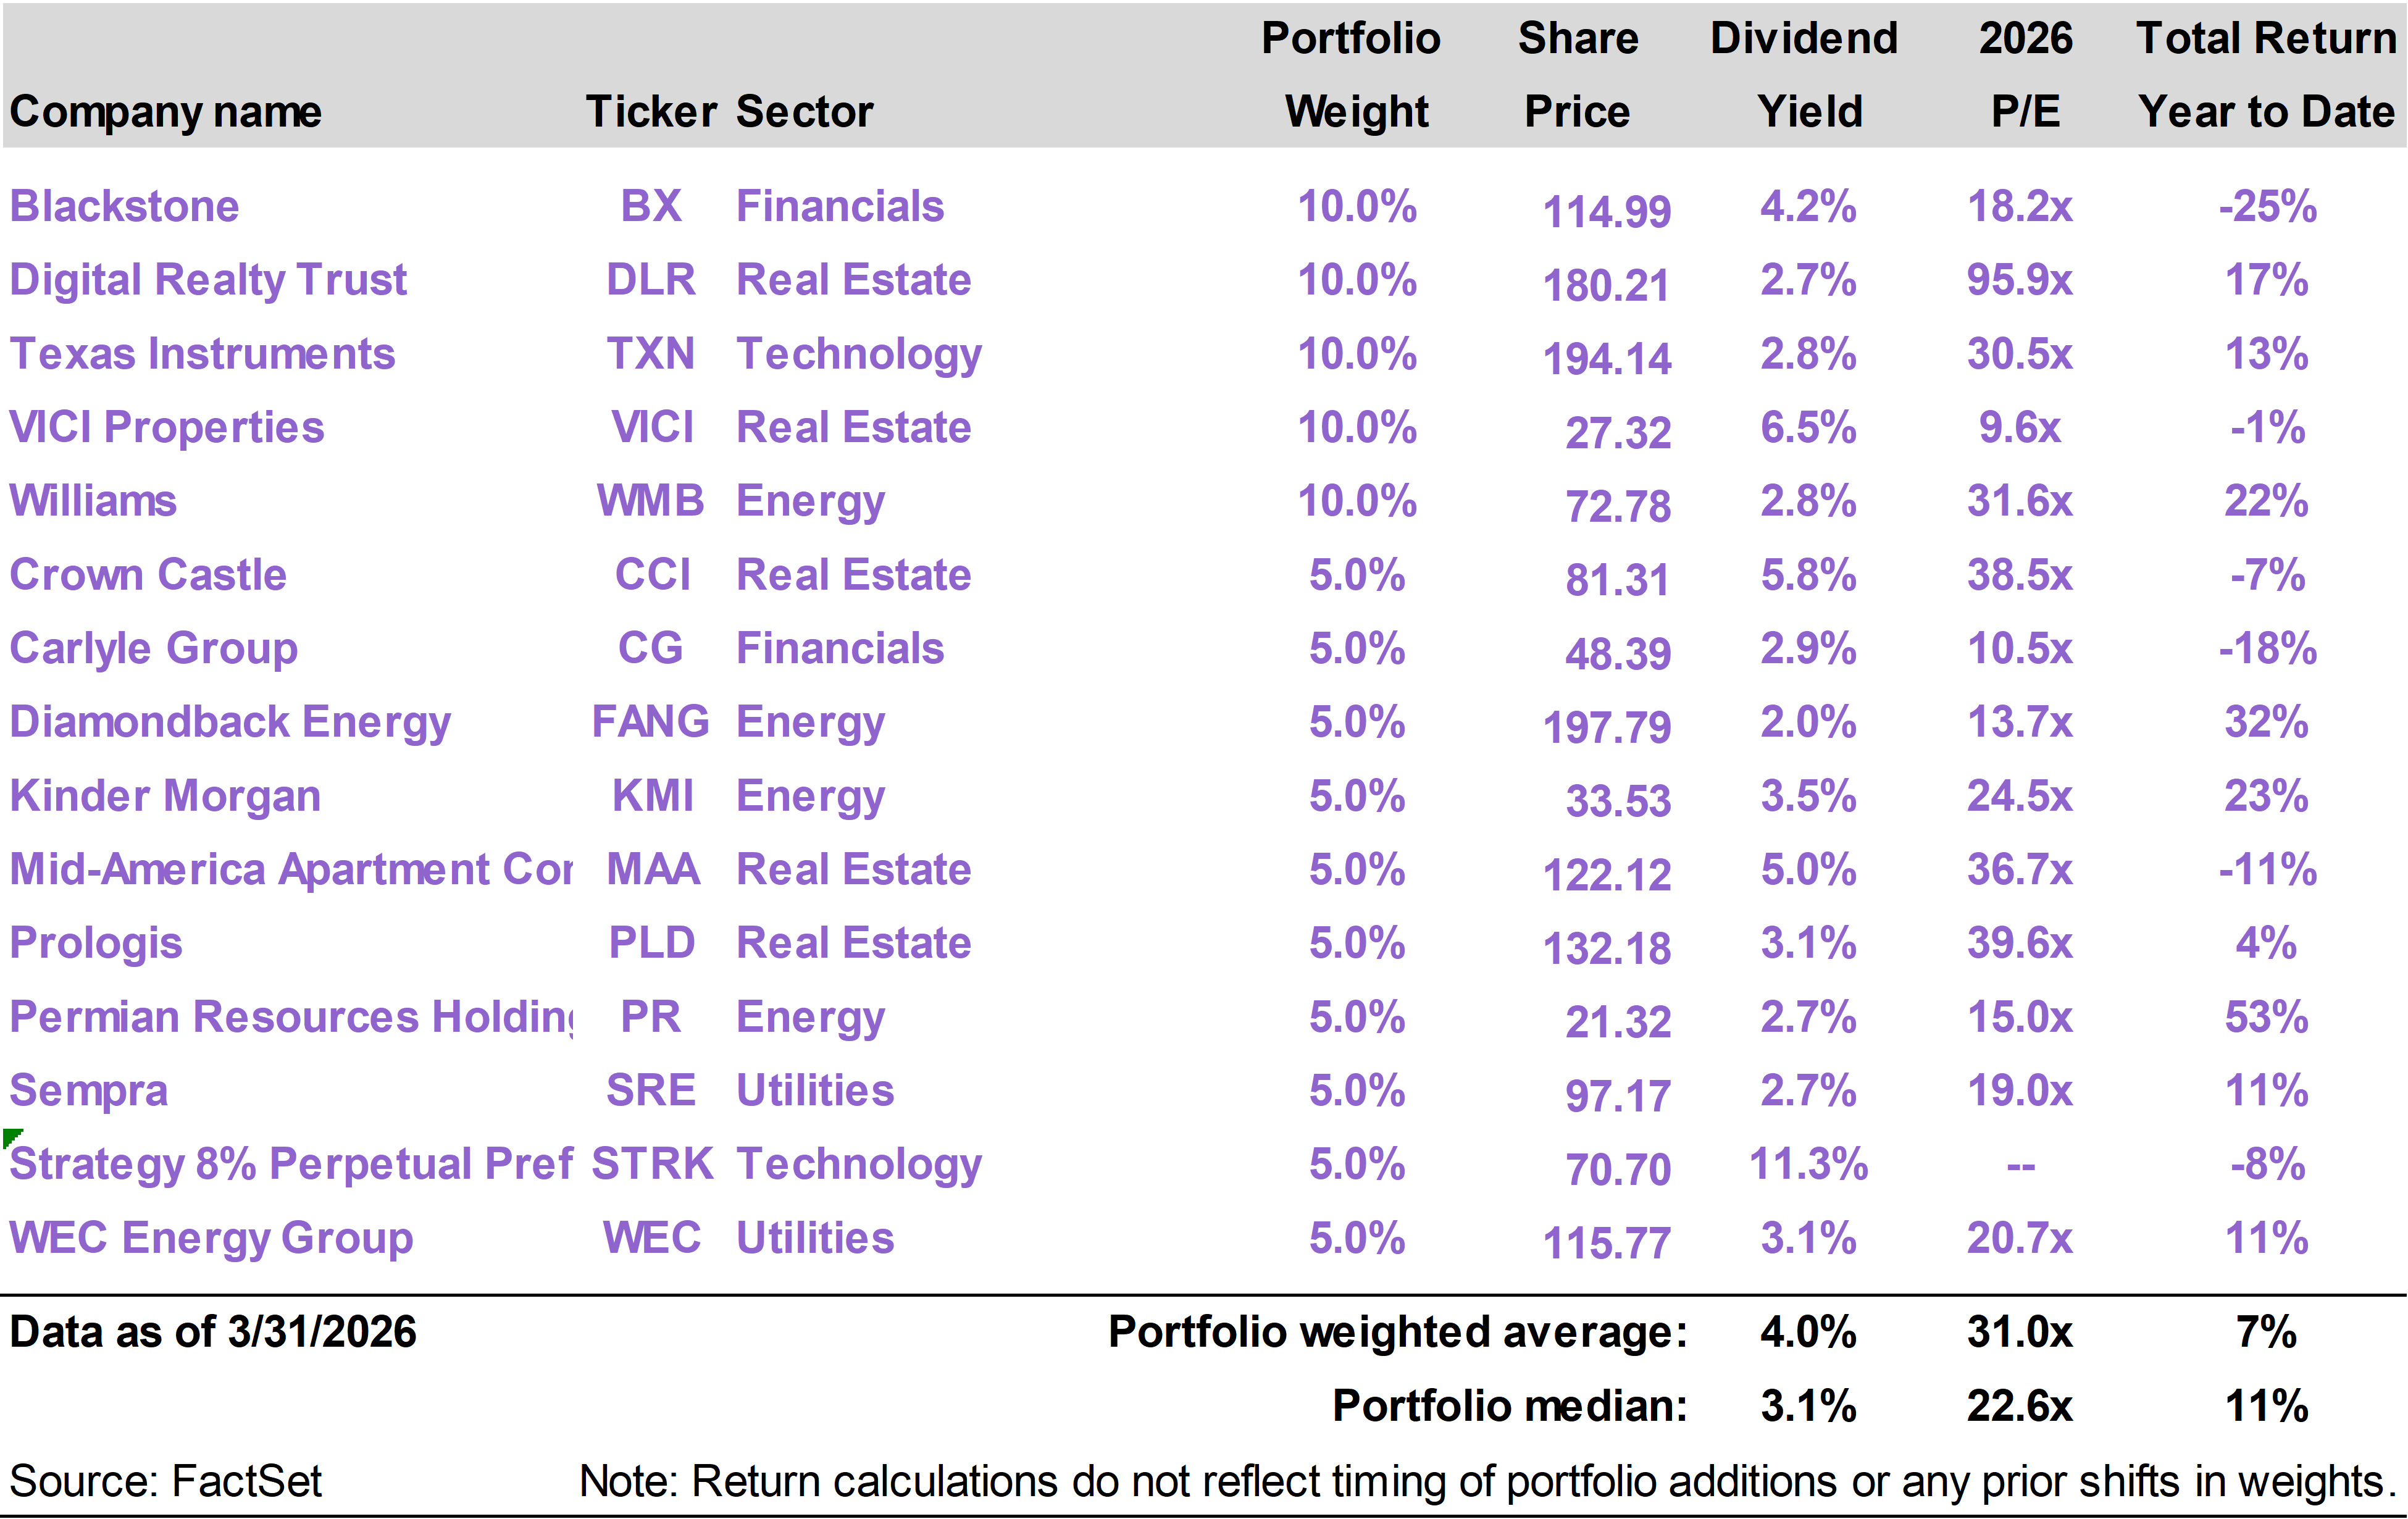
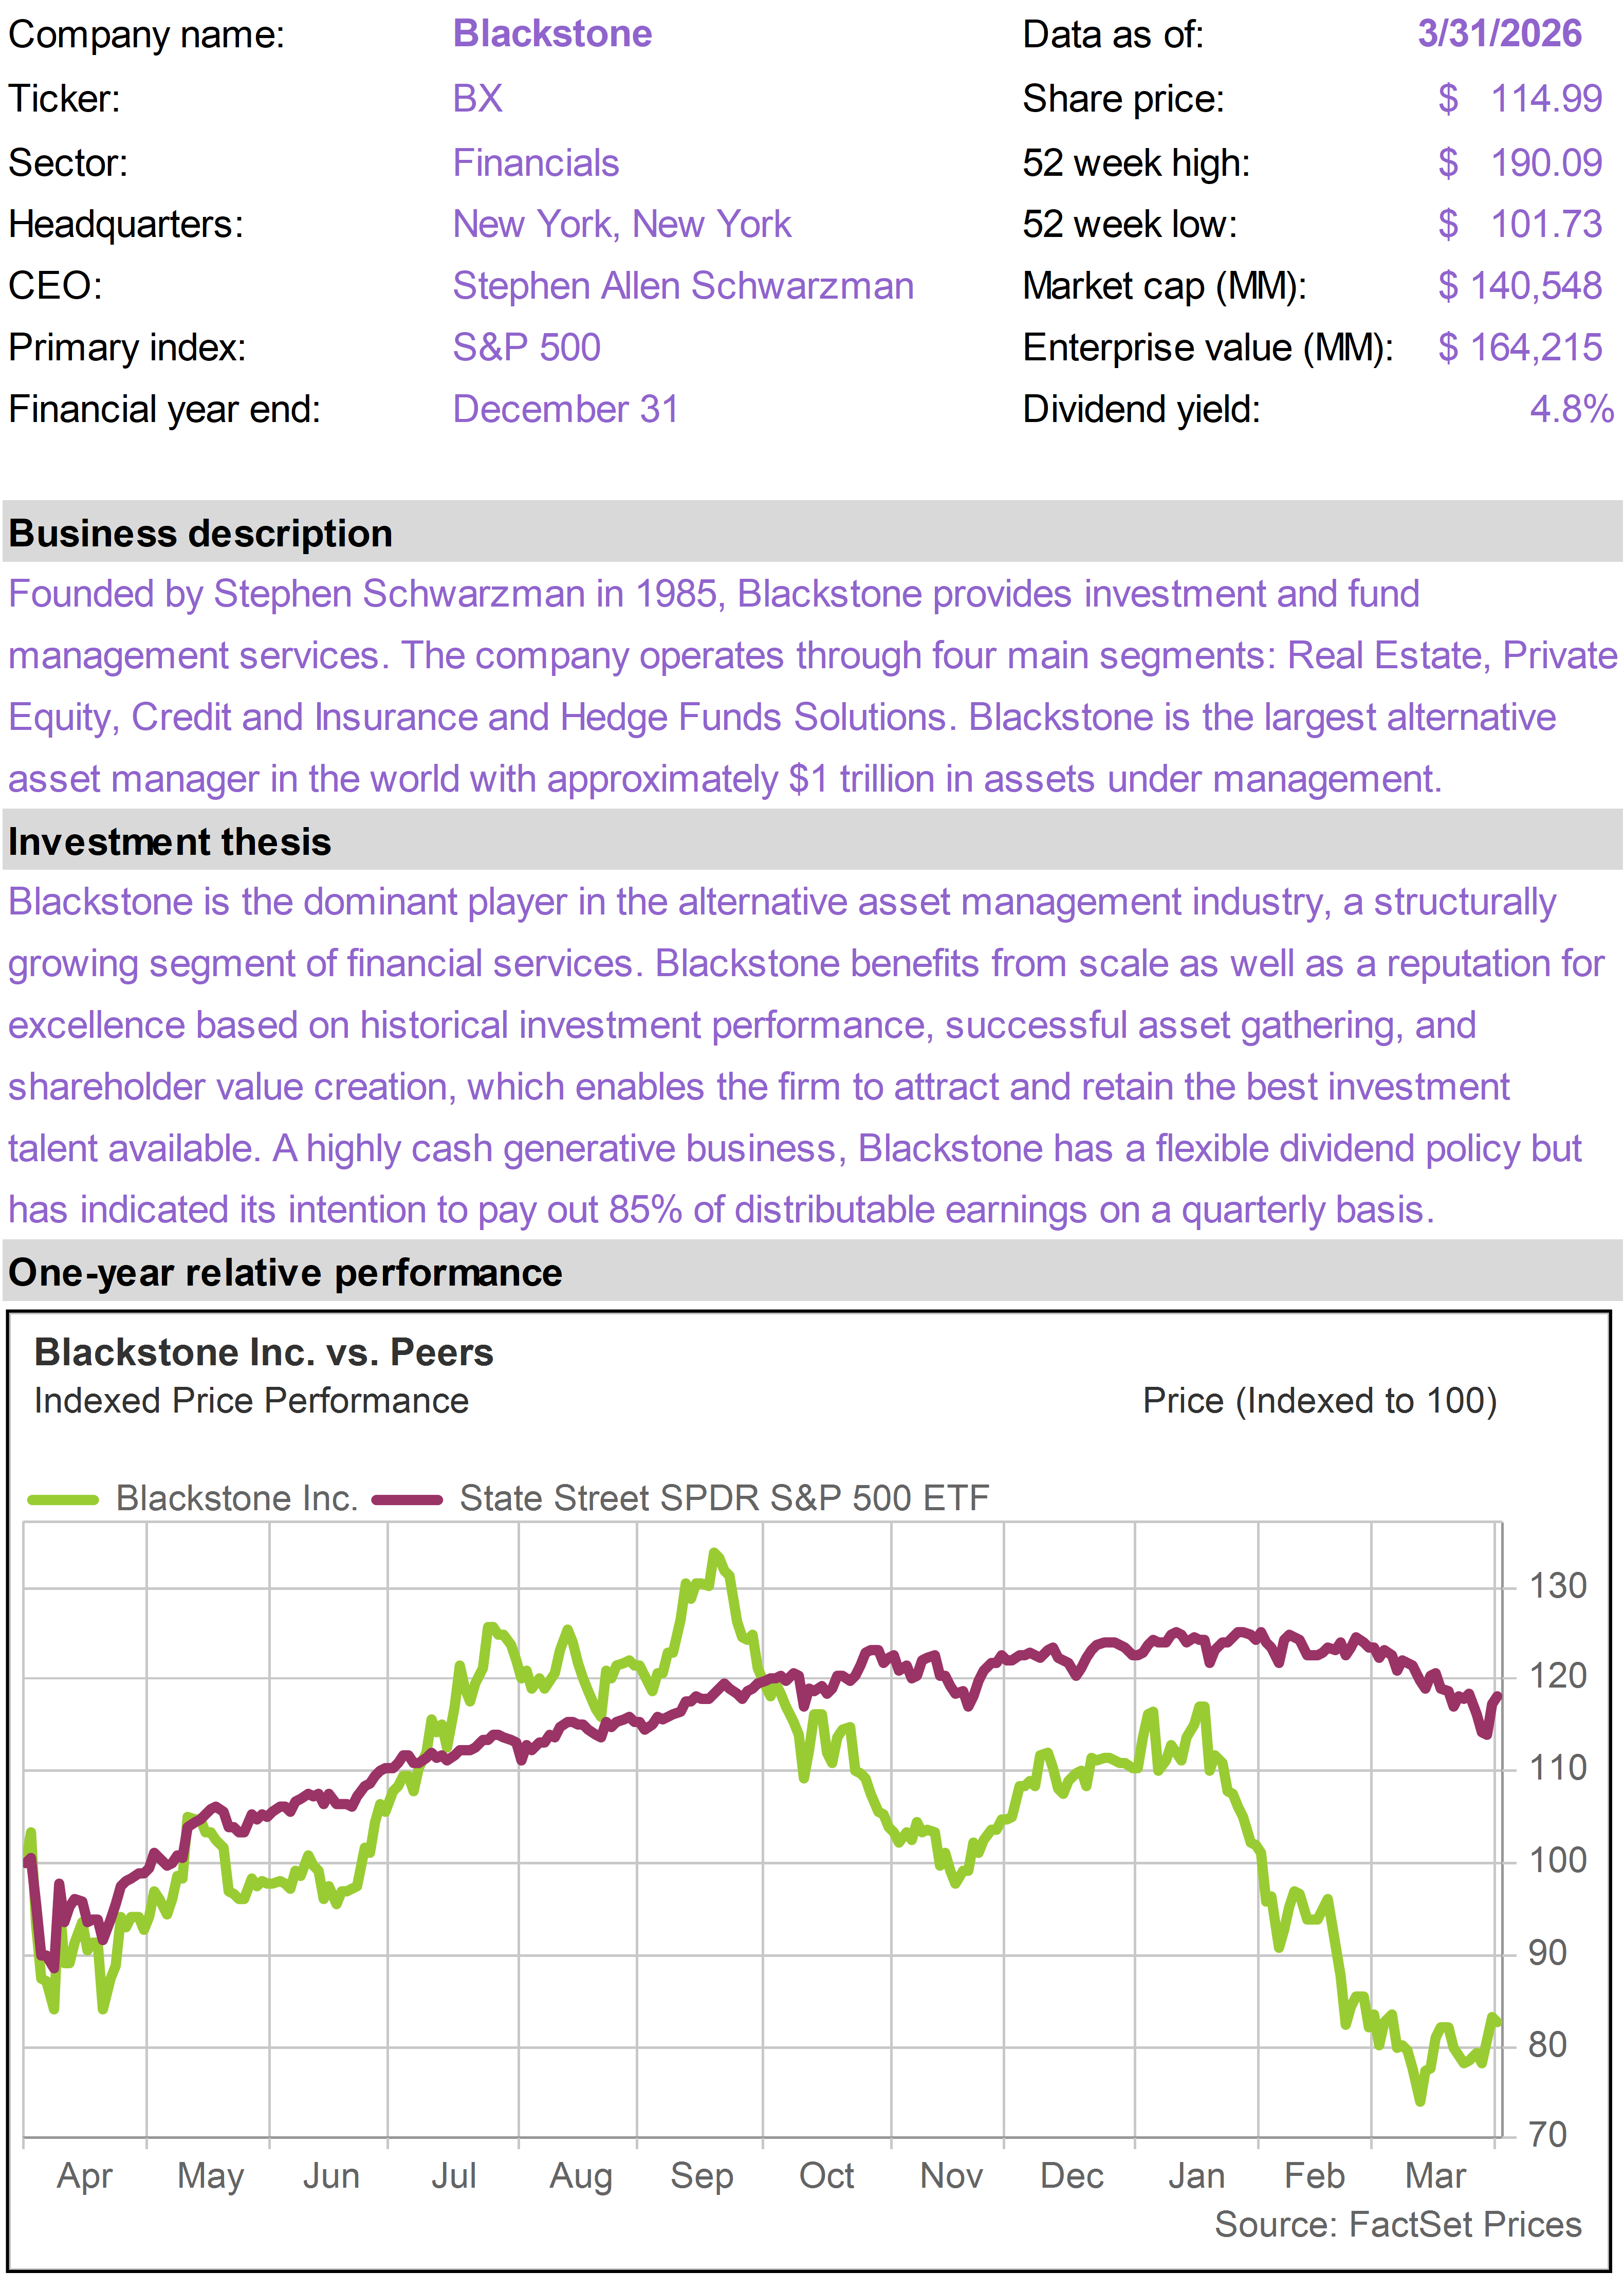
| | | Stocks came under pressure in March as the conflict in Iran disrupted energy markets and complicated the interest rate outlook. While the S&P 500 delivered a -5.0% return, the Income Builder portfolio saw a more modest decline, with a -1.7% return for the month. On a year to date basis through the end of March, the portfolio has returned 6.6%, meaningfully outperforming the S&P 500, which has returned -4.3%. The portfolio’s Energy stocks led performance this month, as crude oil prices spiked higher. Permian Resources (PR) and Diamondback Energy (FANG) returned 18% and 14% respectively. The portfolio’s most significant detractors in March were Real Estate Investment Trust (REIT) stocks, which were negatively impacted by the rise in interest rates. With Trump escalating his threats against the Iranian regime, the opening of the Strait of Hormuz remains the key variable driving markets. We expect a favorable resolution that will lead to an improvement in market sentiment.
|
|
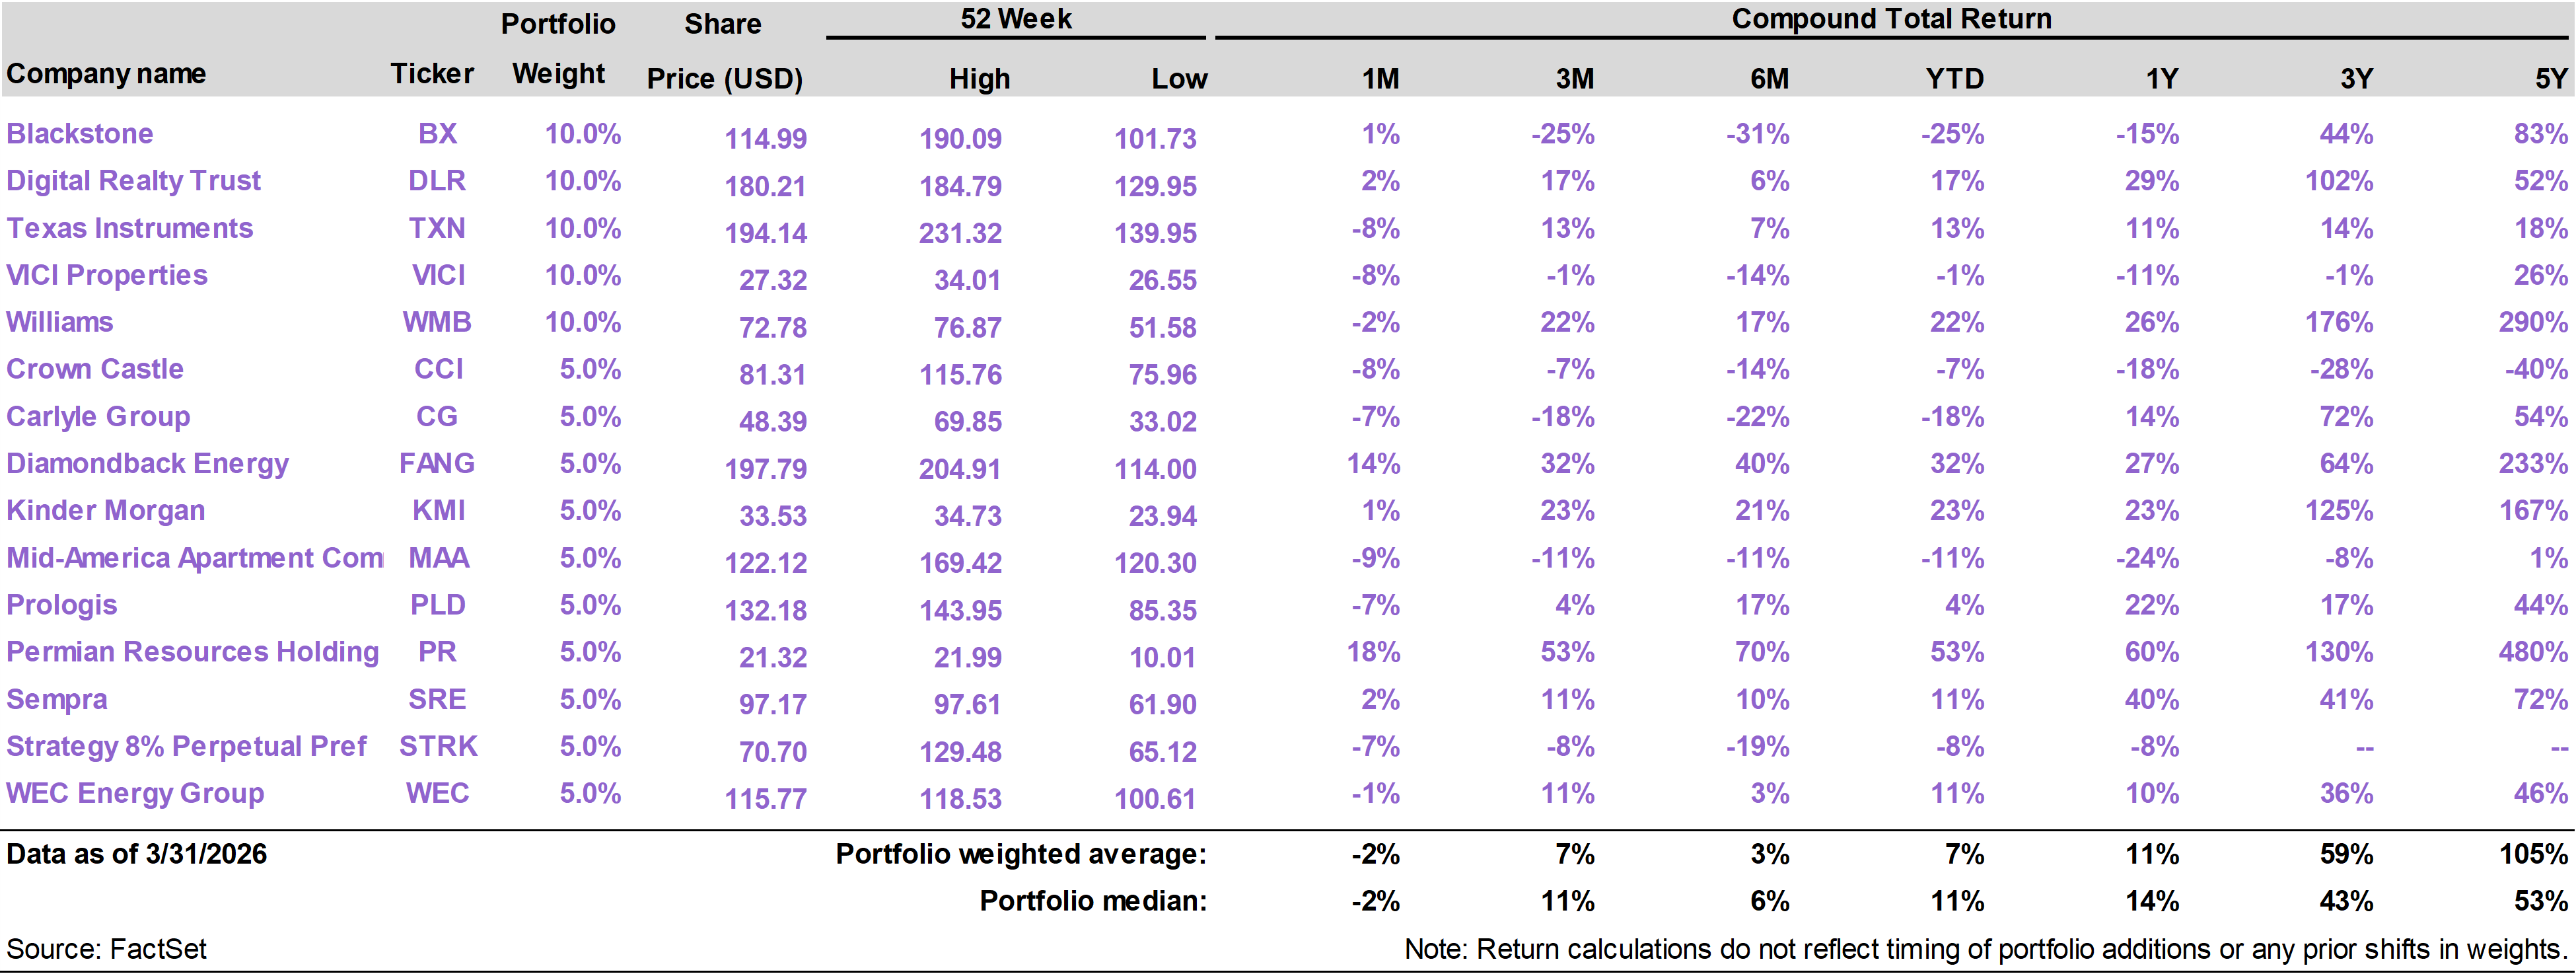
| | | The Income Builder portfolio returned -1.7% in March, while the S&P 500 Index returned -5.0%. On a year to date basis through the end of the month, the portfolio has returned 6.6%, versus -4.3% for the index.
The top performing positions in the portfolio in March were Permian Resources (PR), which returned 18%, and Diamondback Energy (FANG), which returned 14%.
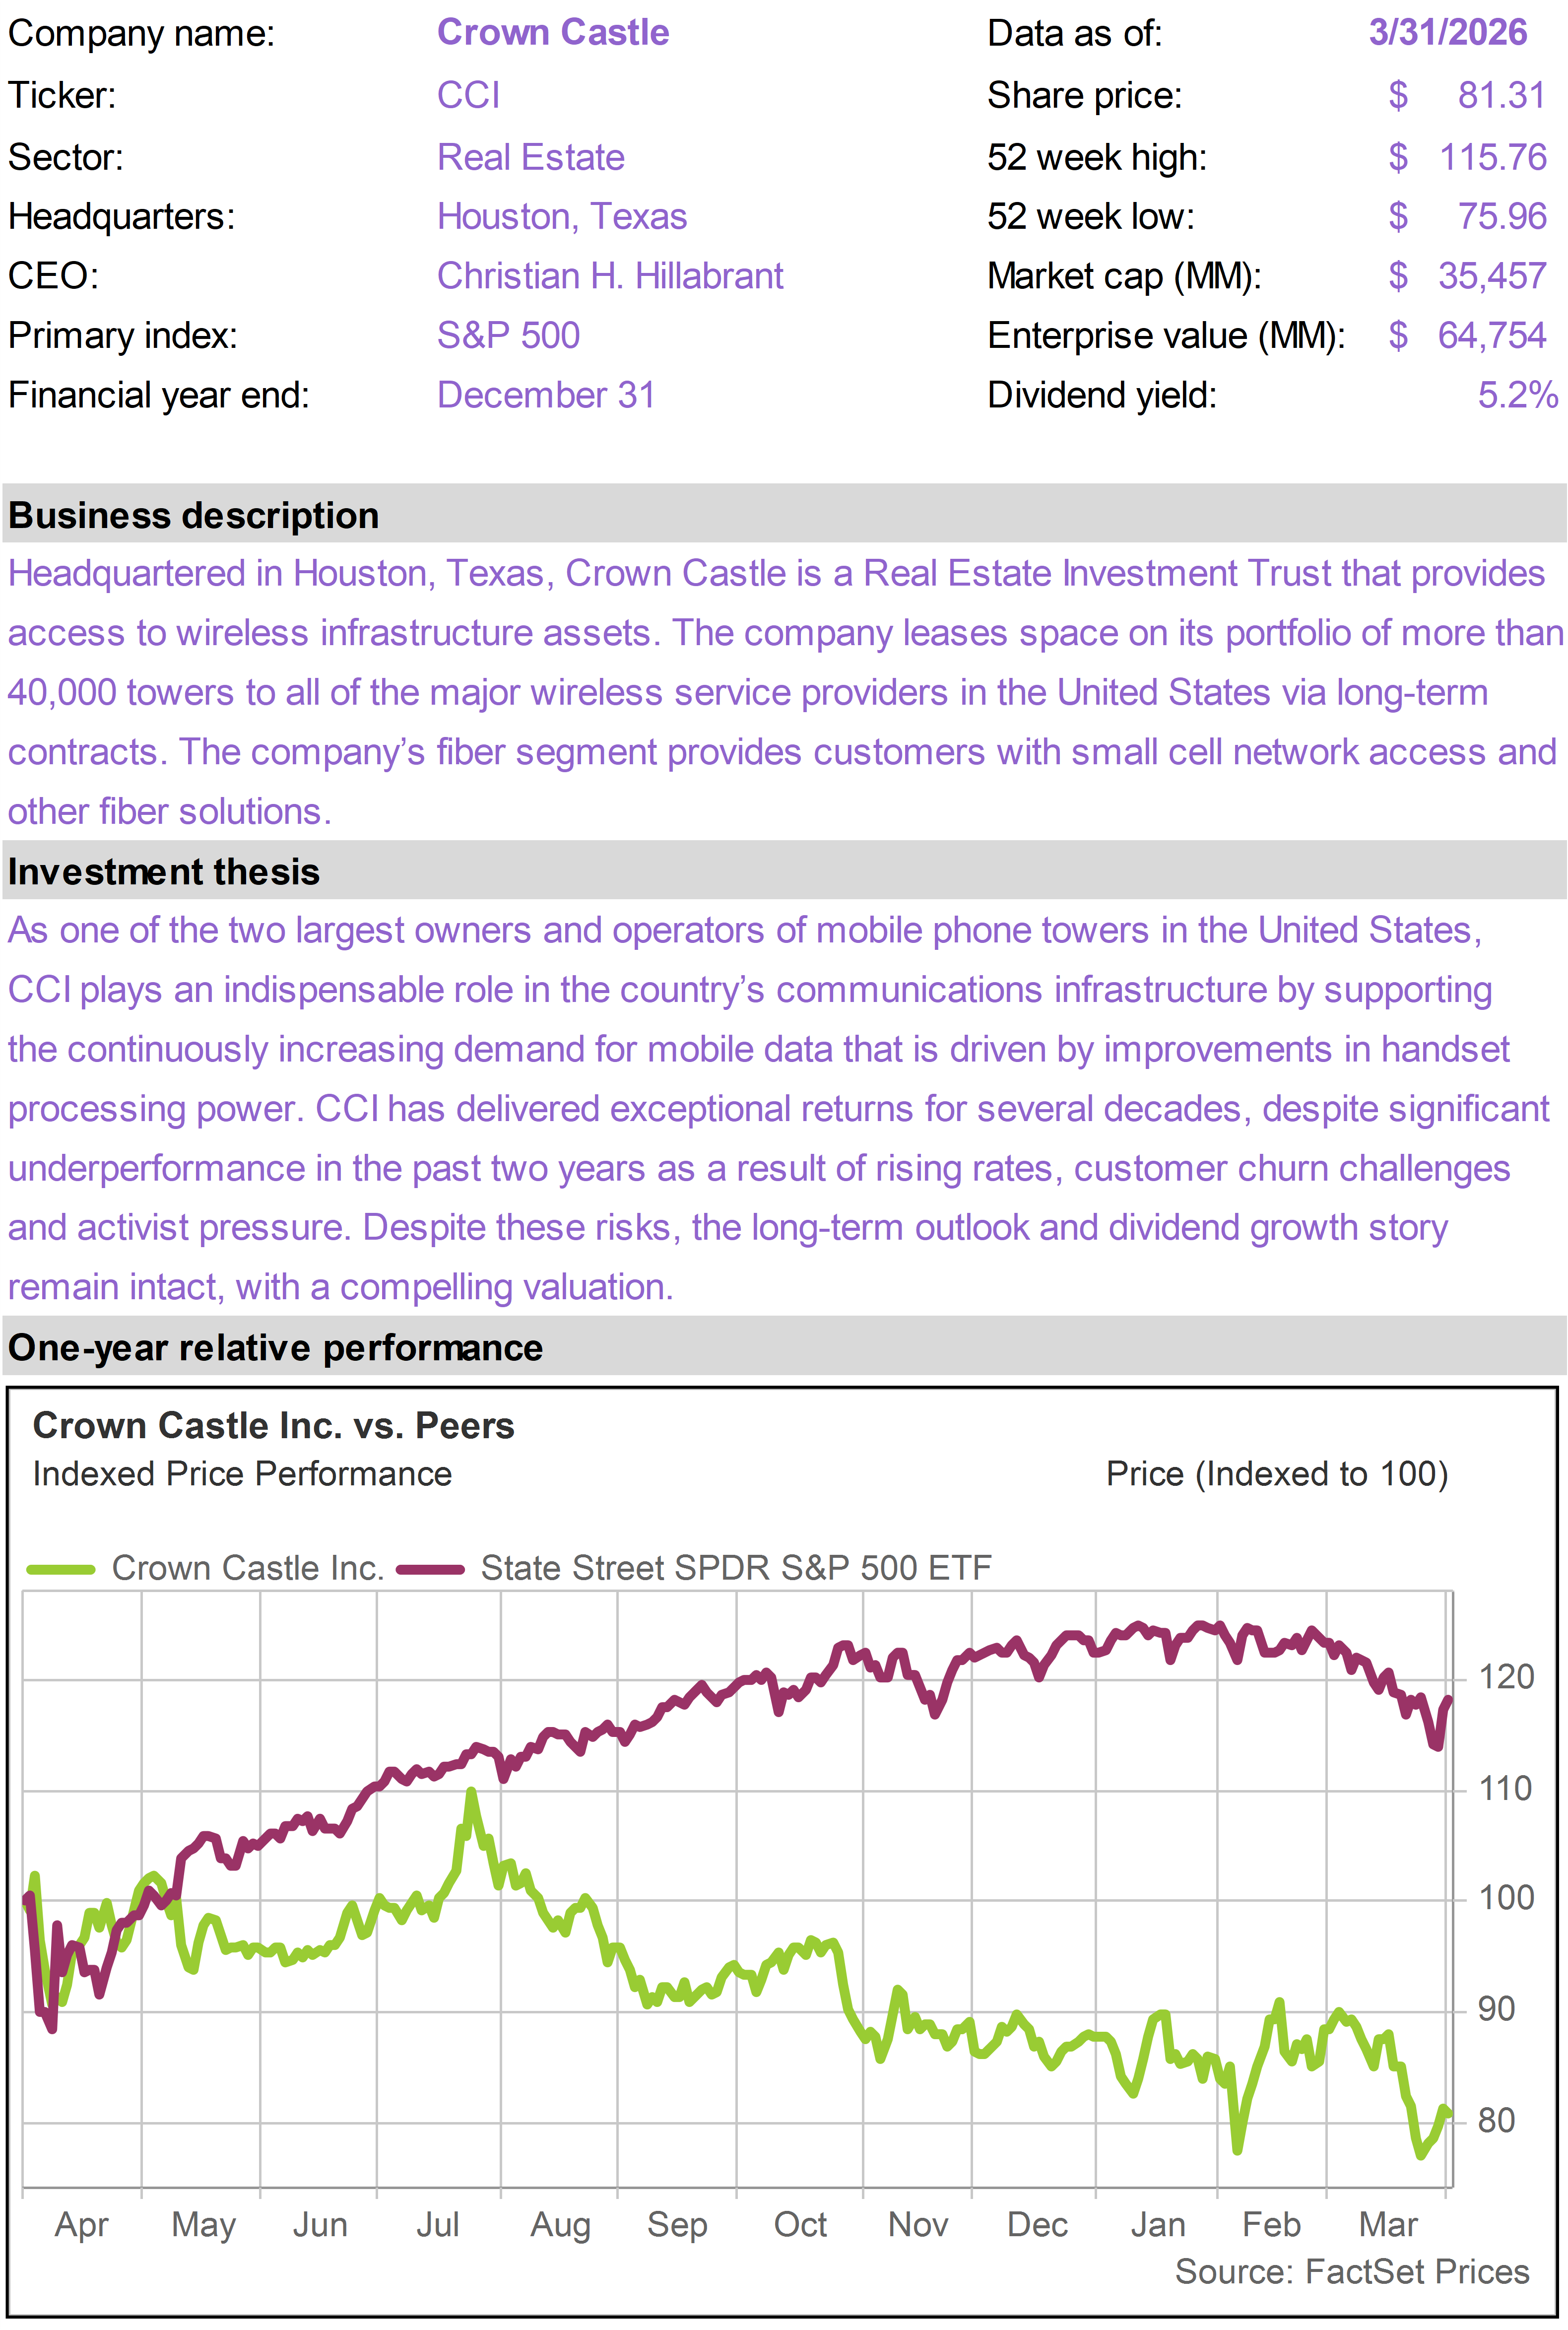
The worst performing positions in the portfolio this month were Mid-America Apartments (MAA), which returned -9%; Crown Castle (CCI), which returned -8%; and VICI Properties (VICI), which returned -8%. |
|
|
Epic Fury pressures stocks
Operation Epic Fury, which kicked off at the very end of February, was the dominant factor in financial markets throughout the month of March. The main issue was the spike in oil prices, which had direct impacts on many companies and significant ripple effects across the entire market.
A down 5% month in the S&P 500—after a three-year run, leading up to the end of February, that produced an 81% total return in the index—is far from a catastrophe. While stocks certainly lost ground in March, it is notable that the stock market also showed a fair amount of resilience.
By any objective standard, the U.S. has exhibited unprecedented military dominance after making the decision to neutralize Iran as a threat.
In a matter of weeks, Iran’s conventional warfare capacity has been severely diminished, while its nuclear weapons program sustained another enormous setback. Multiple layers of the regime’s political leadership were destroyed.
Despite all the losses, Iran’s ability to wage war was not totally eliminated, leaving the regime one critical opportunity to push back. By threatening cargo ships in the Strait of Hormuz, Iran has been able to disrupt the flow of oil and other commodities out of the Persian Gulf.
It does not take much to stop commercial shipping vessels from going about their normal business. Iran took full advantage of this vulnerability.
The Iranian regime (or what remains of it) cannot stop the U.S. militarily, but it can manufacture a difficult economic and political scenario for Trump by interfering with global oil markets. This is the strategy they have unsurprisingly pursued.
Oil surges
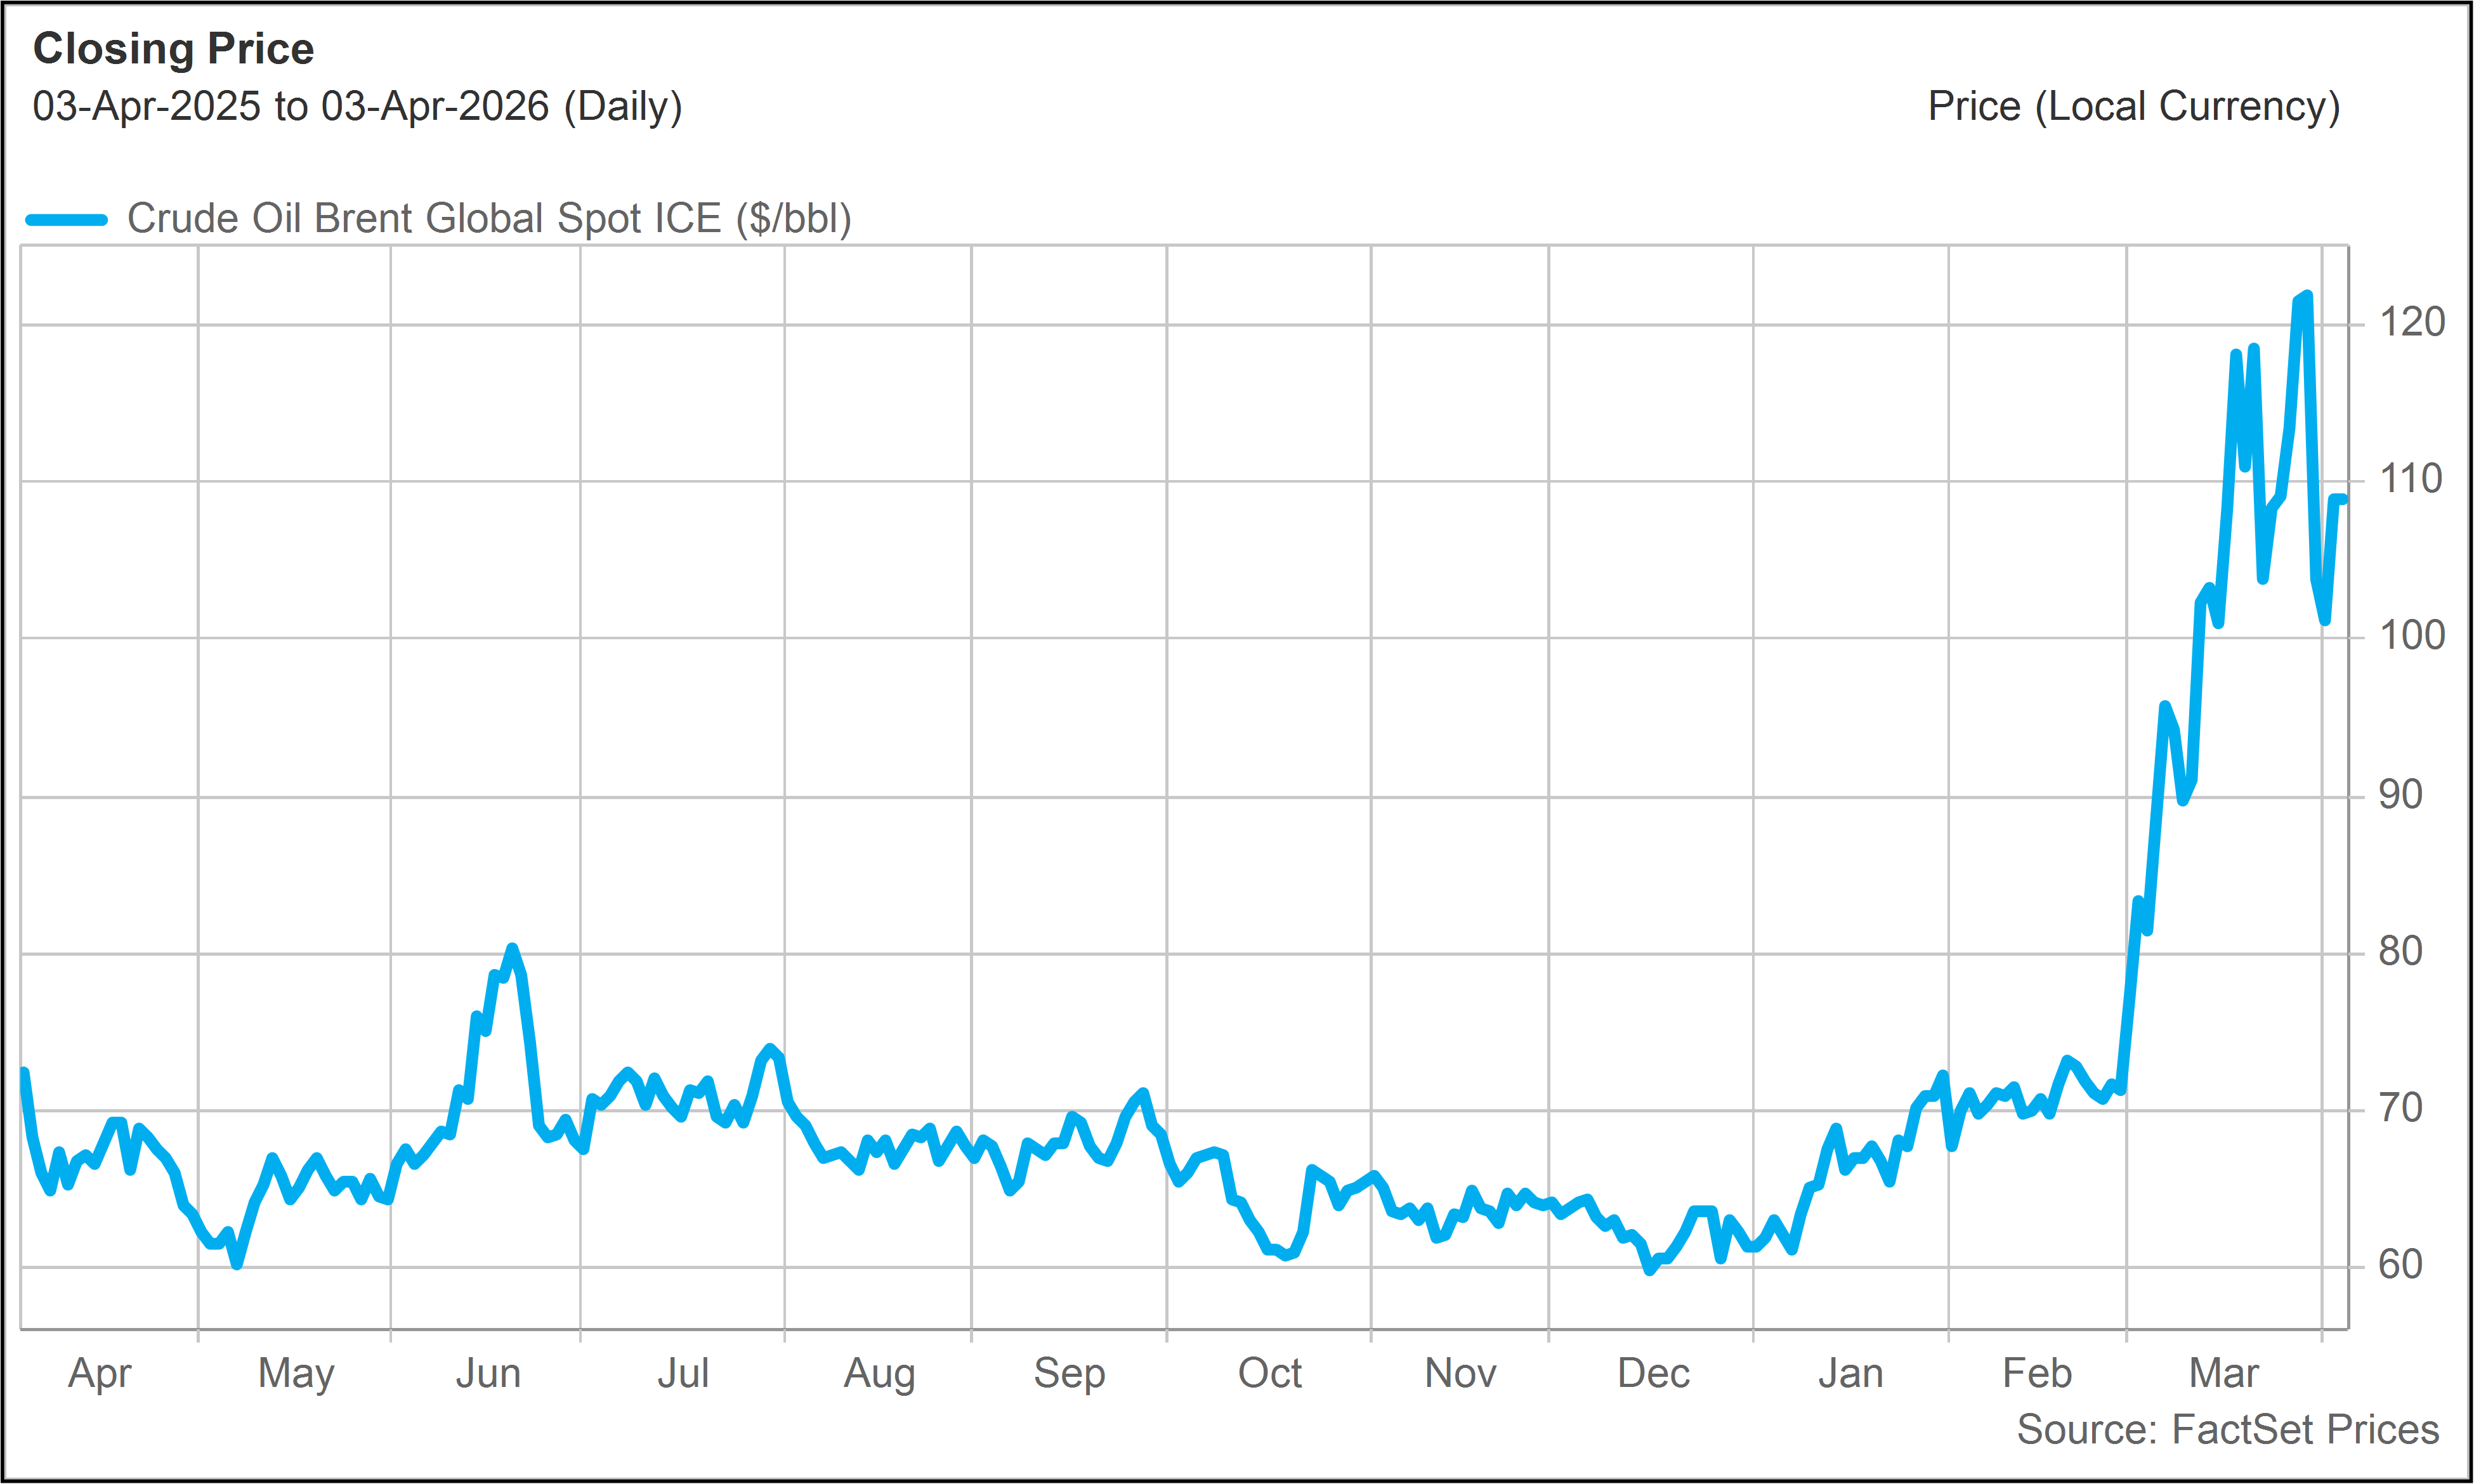
Global oil markets ended last year in a well-supplied state, with a barrel of brent crude having drifted as low as $60.
Spot crude oil prices then started to move upward in the beginning of 2026, especially as oil traders took note of rising tensions between the U.S and Iran in February, with U.S. naval assets being deployed to the Middle East.
Once Epic Fury began at the end of February, and it became apparent that tankers would at least temporarily not be able to make their way through the Strait of Hormuz, oil prices immediately surged.
Spot crude moved from around $70 at the start of the month to as high as $120 at one point, settling in the $100 to $110 range by the end of the month. |
|
|
|
Brent Crude Oil($/barrel - Last 12 Months) |
|
|
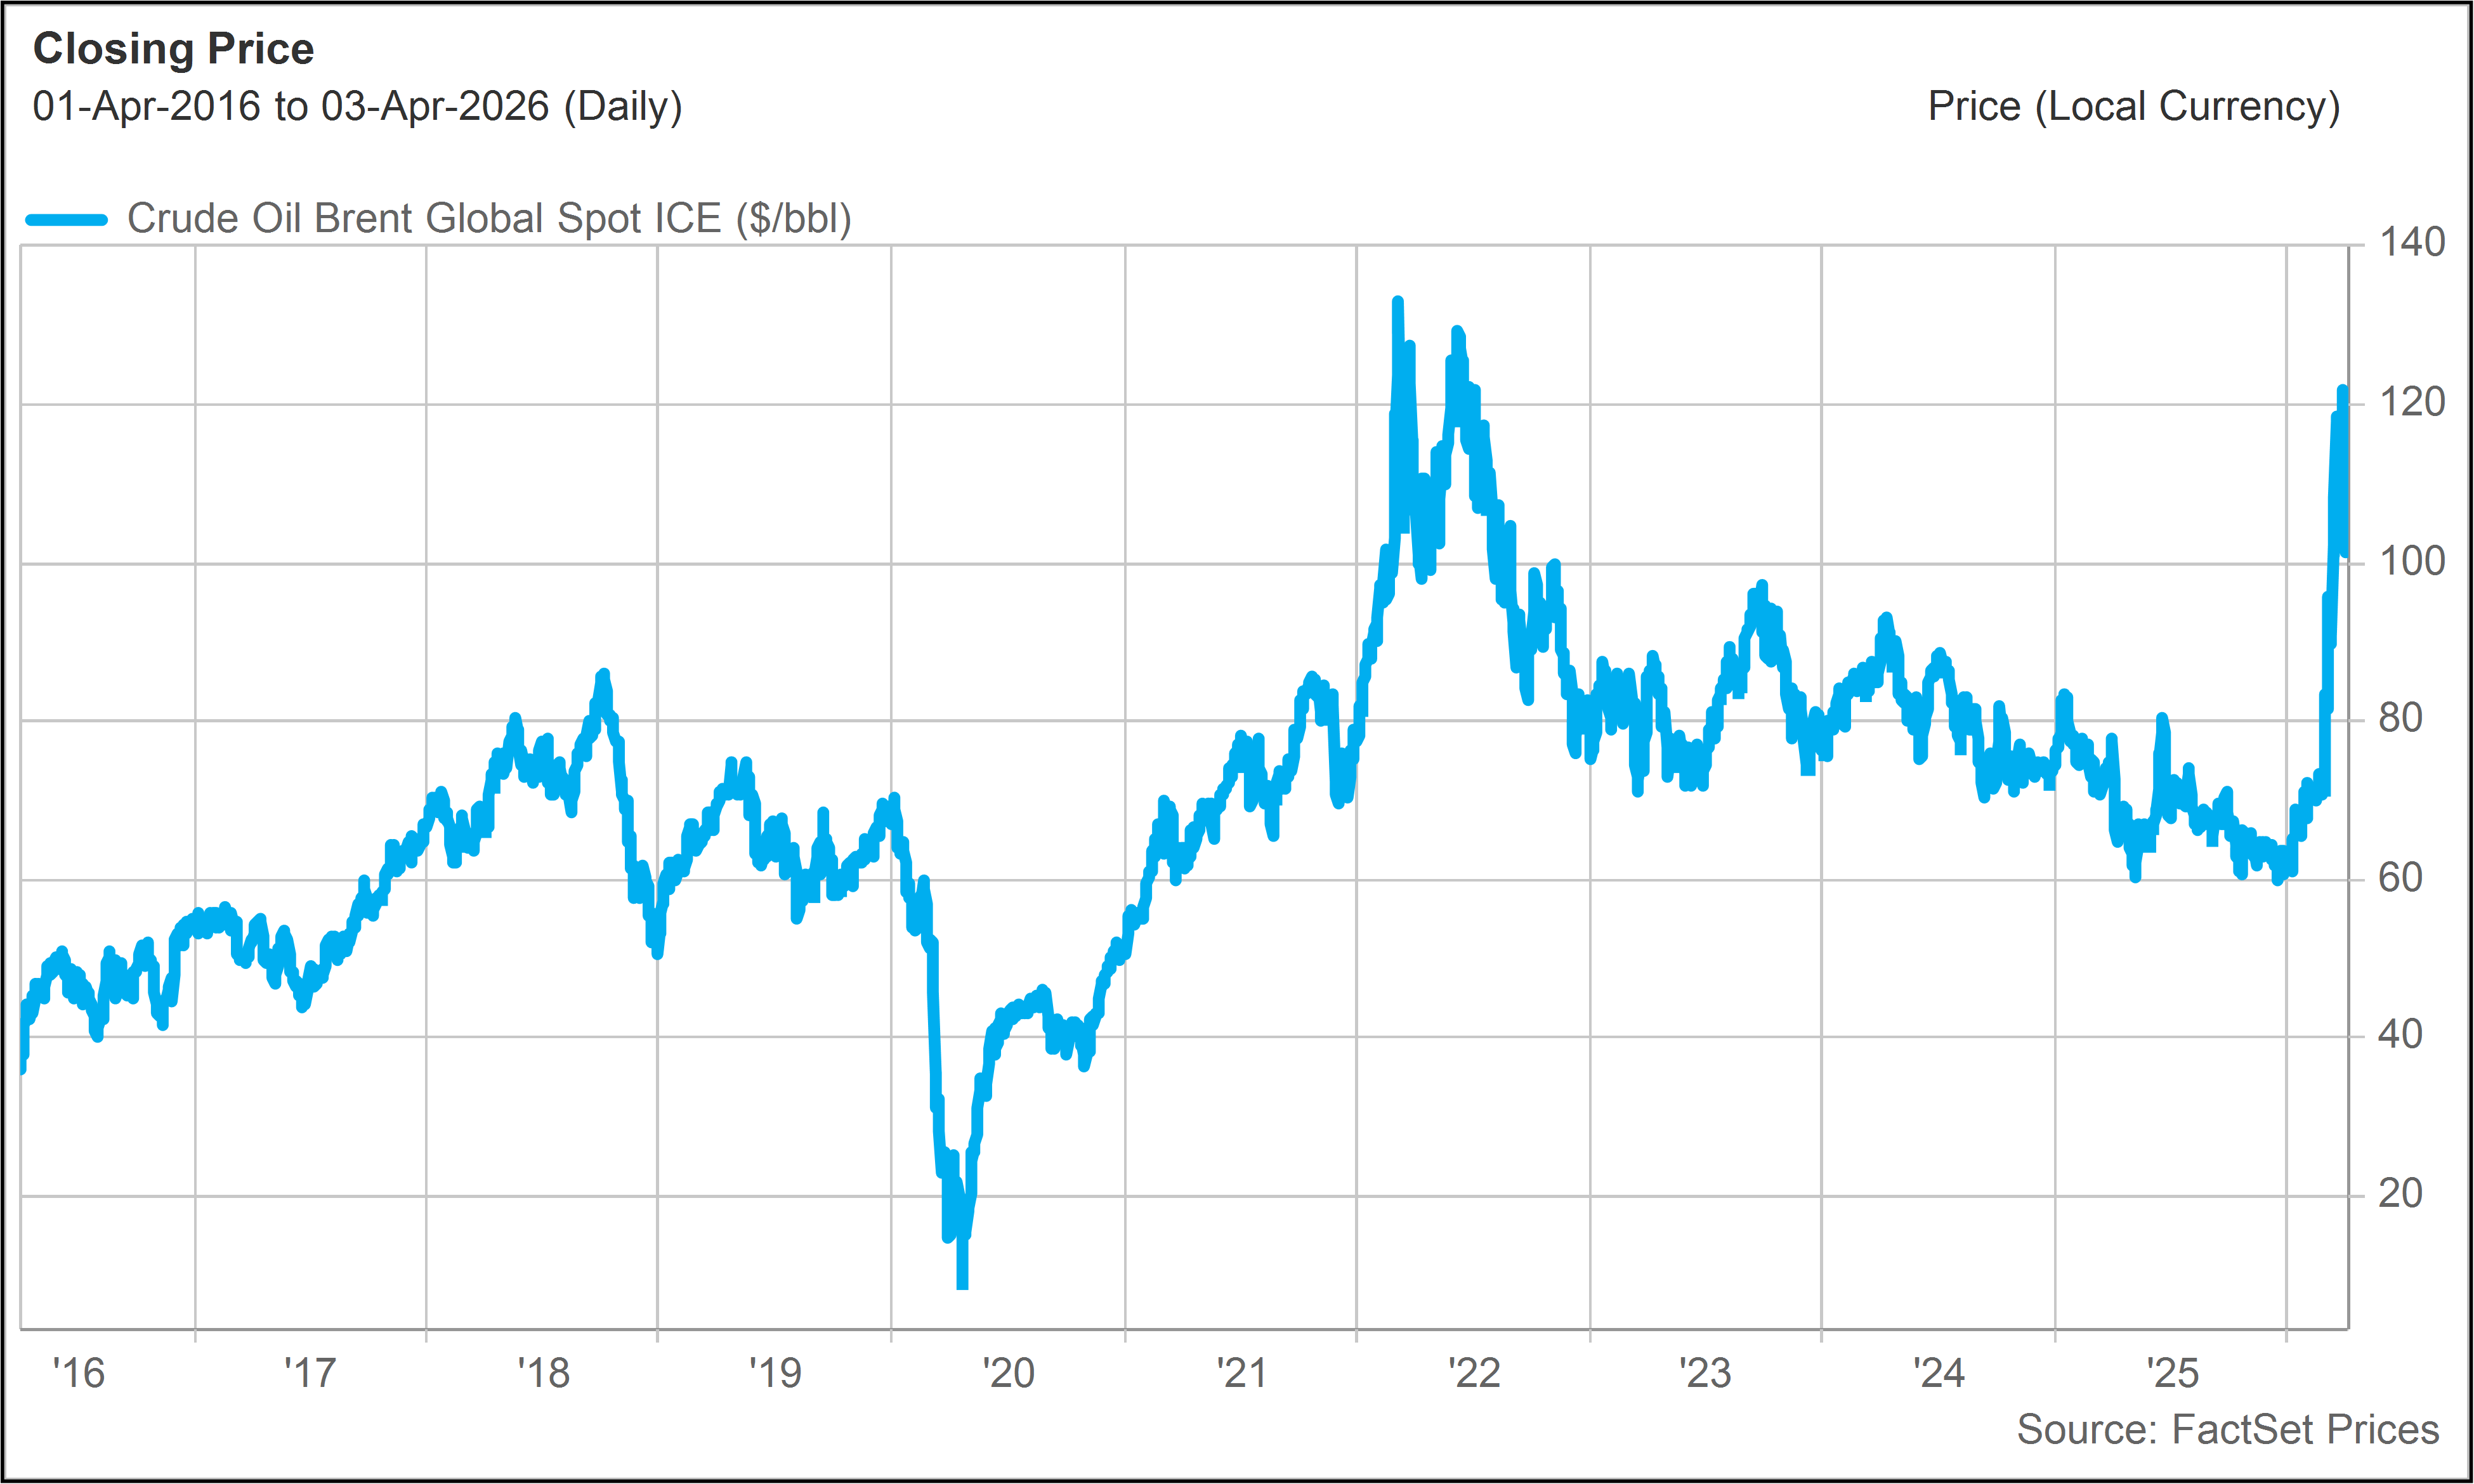
The move in oil prices was abrupt, especially because oil prices were so low to begin with. It is worth noting, however, that over a longer time horizon, current oil prices are not especially stretched.
This should give investors some comfort in the global economy’s ability weather this storm. It also helps explain why the market is not reacting to this event as a full-blown crisis.
Current oil prices in fact remain below their highest levels of 2022, during the Russia-Ukraine conflict.
On an inflation-adjusted basis, current prices are largely in line with the 2018 peak in oil prices, north of $80 per barrel. Oil prices drifted higher in that time frame as a result of strong demand and restrictive global supply conditions. |
|
|
|
Brent Crude Oil($/barrel - Last 10 Years) |
|
|
The ramifications of higher oil
Even after the March surge, oil prices are not at dangerously high levels from a historical perspective. And as a net exporter of all fossil fuels (albeit a net importer of crude oil), the United States is also relatively protected from energy shocks.
Furthermore, many companies and workers in the U.S. are connected to the energy sector, directly or indirectly, and therefore stand to benefit from higher energy prices and higher profits.
All that said, the marginal impact of the spike in oil prices on the economy and market expectations is material.
Everyone in the U.S. is a consumer of energy. High energy prices act like a tax on economic activity and in that way tend to depress economic growth.
Rising energy prices are also inflationary, which is particularly inconvenient in the current environment.
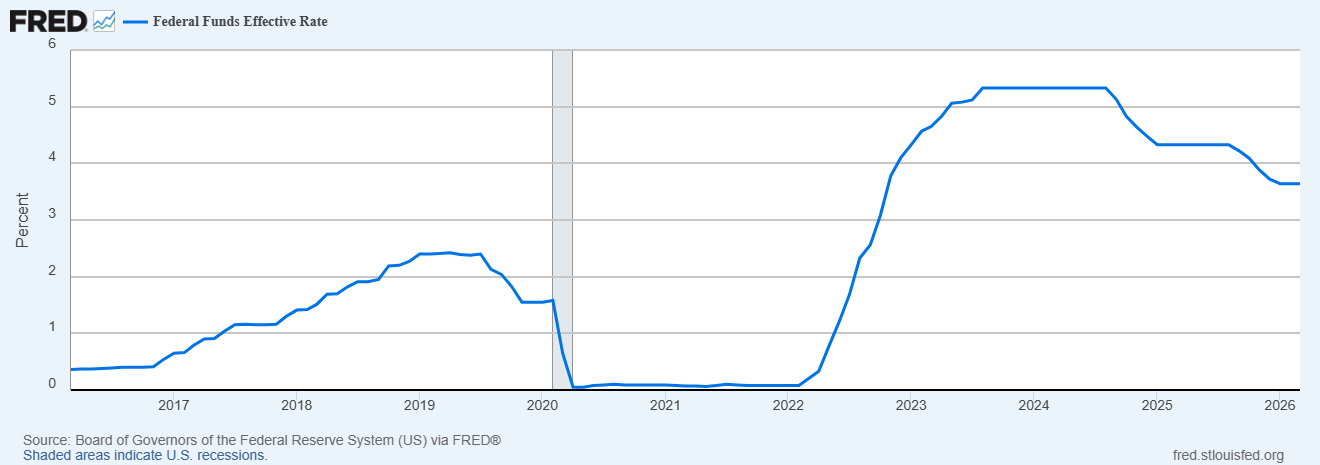
Inflation has come way down from Biden-era peaks, but the U.S. economy has not quite reached the Fed’s informal 2% inflation target, trending closer to 3%.
As a result, the Fed has kept short-term interest rates elevated, even though they have been causing significant friction in the housing market and other challenges for consumers. |
|
|
|
Fed Funds Rate(Last 10 Years) |
|
|
The Fed pivots hawkish
Perhaps the most significant market impact of the war in Iran has been on interest rates.
When Federal Reserve officials convened for the regularly scheduled FOMC meeting in the middle of March, they left the short-term Fed funds rate unchanged but signaled a more hawkish outlook.
For investors in stocks, the key takeaway from the Fed meeting was its reluctance, at least over the next several months, to stay on the rate-cutting path. Fed officials are concerned that higher oil prices will put upward pressure on inflation, which they believe rate cuts will only exacerbate further.
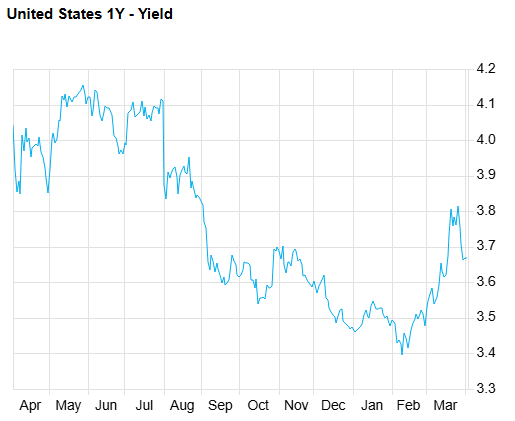
In anticipation of a shift in the Fed’s behavior, both short-term and long-term interest rates rose sharply in March, after steadily declining over the prior 12 months in response to subsiding inflation pressure.
The 1-Year Treasury yield, which is a good indicator of where the bond market thinks the Fed funds rate is headed over the next year, rose approximately 0.2% in March. This is consistent with the idea that we may now see one less quarter-point rate cut this year (relative to what the market was expecting before the war began). |
|
|
|
1-Year Treasury Yields—Last 12 Months(Source: FactSet) |
|
|
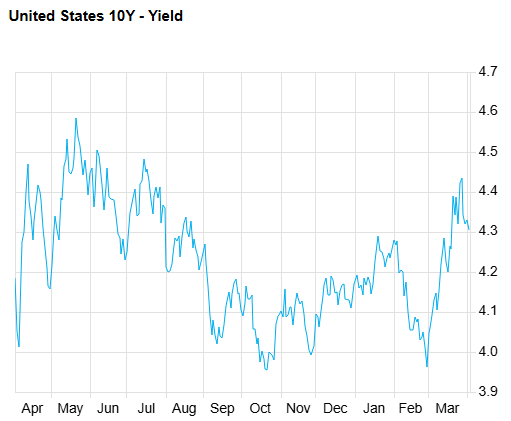
The 10-Year Treasury yield also rose significantly, moving from approximately 4.0% at the end of February (close to its lowest level over the past year) toward 4.3% at the end of March. |
|
|
|
10-Year Treasury Yields—Last 12 Months(Source: FactSet) |
|
|
All sectors suffer (except Energy)
Few businesses stand to benefit when there is a macro shift that threatens growth and at the same time leads to tighter monetary policy.
The only sector that performed well this month was, unsurprisingly, Energy. Oil and gas exploration and production stocks were particularly strong performers, as higher oil prices feeds directly into higher earnings. The Energy sector advanced 10%. |
|
|
|
Defensive sectors, like Consumer Staples and Health Care, often perform well in periods of geopolitical turbulence. However, in this case, the impact on interest rates offset any perceived benefit of business stability.
When long-term interest rates rise, this can be especially damaging for defensive stocks that tend to be valued on the basis of their secure long-term cash flow potential. These stocks often trade in tandem with long-term bonds, which trade lower as interest rates rise.
At the same time, more cyclical sectors, like Industrials and Consumer Discretionary, also perform poorly in a period of heightened macroeconomic risk. Investors shunned these sectors as well in March.
Outside of Energy, there were not many places for investors to hide this month. |
|
|
What comes next?
The S&P 500 drifted down steadily all month as oil prices climbed and investors grew increasingly nervous. The key question on every investor’s mind was when does the Strait of Hormuz reopen.
The index closed at its lowest level for the year on March 30, down 7% on a year to date basis. However, on the following day, the final day of the month, stocks rallied sharply in response to indications from President Trump that U.S. military engagement in the region will begin to wind down.
The situation remains highly fluid. This morning, Trump issued a not so gently worded message on social media, demanding that the Strait get reopened before Tuesday, at which point he will start targeting critical infrastructure.
Our expectation is that the Strait of Hormuz problem should be largely resolved in a matter of days or weeks, either through diplomacy or force.
Once traffic begins to flow through the Strait again, we would expect spot oil prices to subside along with some potential relief on interest rates. Risk appetite should also return to the stock market.
Given lingering uncertainty and the need for strategic stockpiling, oil prices likely will not immediately return to the historically low levels that we saw at the end of last year. But to the extent global energy flows normalize, market sentiment has the potential to improve noticeably.
Investors who view this as a short-term problem that will ultimately get sorted out are likely to be rewarded for having patience during this turbulent period. In the meantime, disturbing headlines and risk-off sentiment create opportunities for long-term investors to build positions at lower prices. |
|
| | | The top performing positions within the portfolio in March were Permian Resources (PR), which returned 18%, and Diamondback Energy (FANG), which returned 14%.
The worst performing positions were Mid-America Apartments (MAA), which returned -9%; Crown Castle (CCI), which returned -8%; and VICI Properties (VICI), which returned -8%. |
|
| |
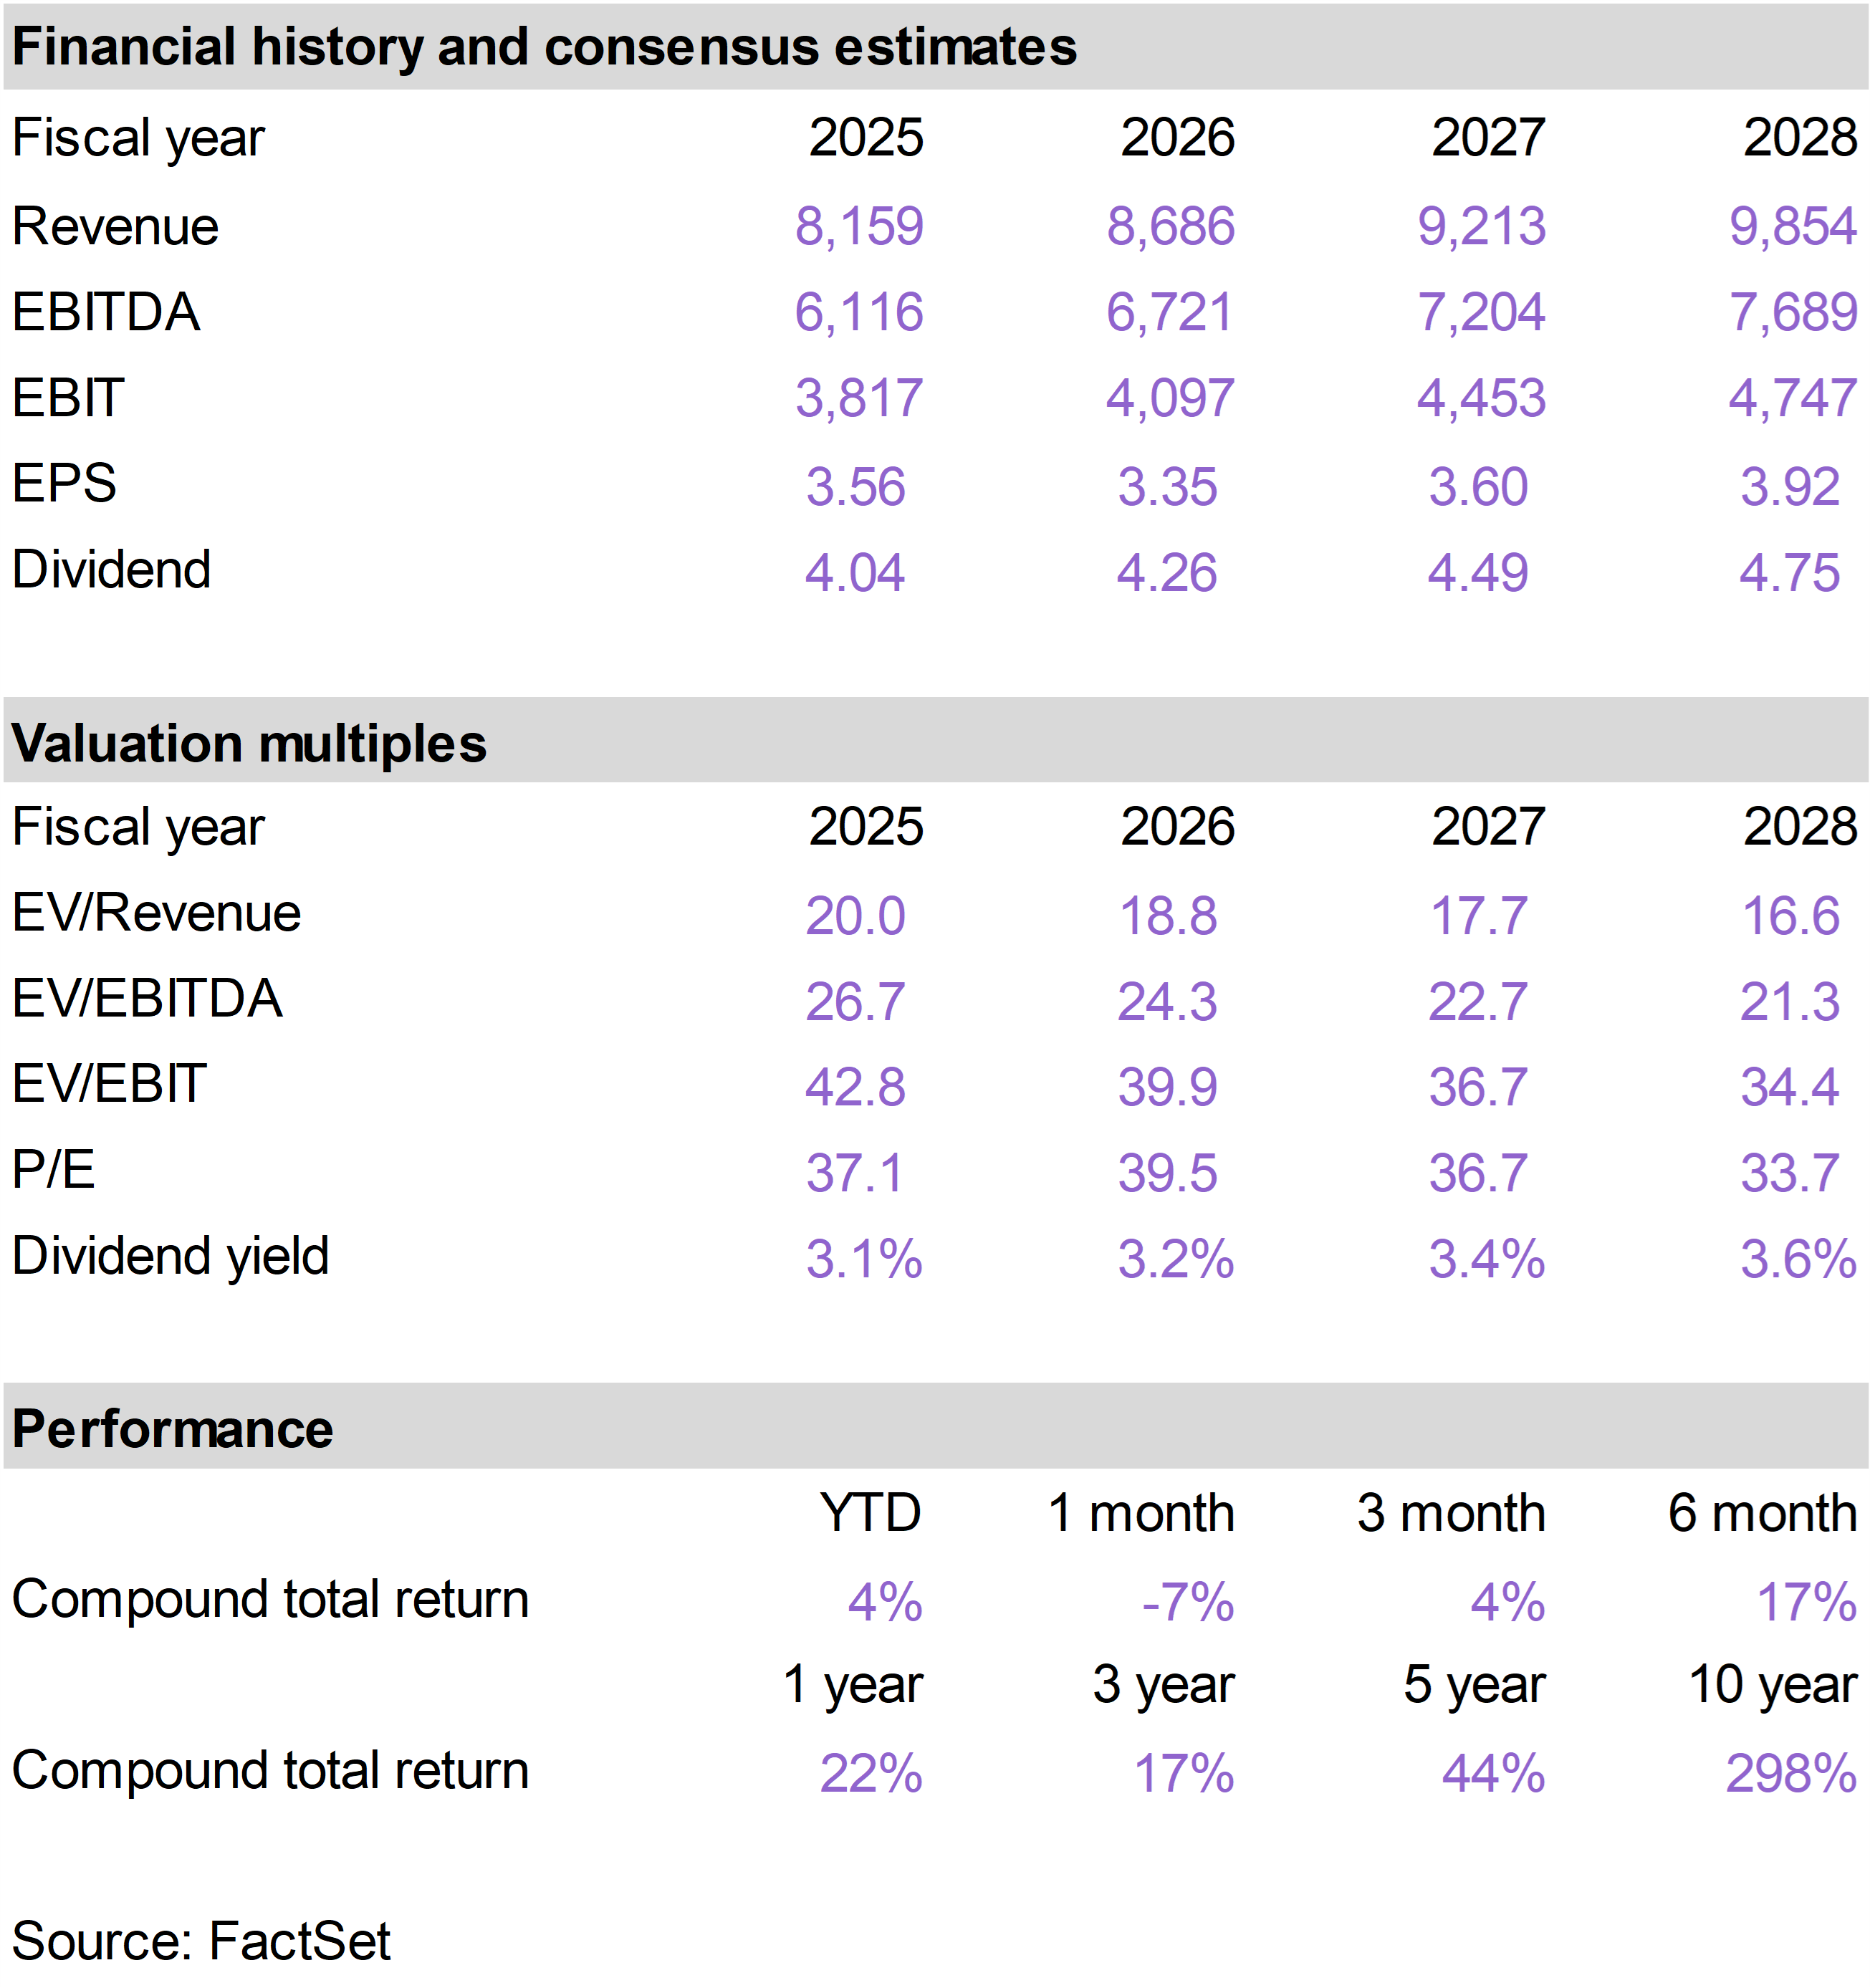
PR and FANG are both independent oil and gas producers focused on the Permian Basin. Located in Texas and New Mexico, the Permian Basin is the most productive and lowest-cost shale region in the U.S.
Both companies drill wells, produce oil and natural gas, and sell those commodities into global energy markets. Higher oil prices pressure most stocks, but they are a clear tailwind for PR and FANG—highlighting the unique value of domestic producers as an energy shock hedge within a broader portfolio.
The long-term investment case for both stocks centers on high-quality assets and disciplined capital allocation. Both companies operate in core acreage with low breakeven costs, allowing them to generate strong cash flow even at moderate oil prices.
Rather than aggressively growing production, both management teams are focused on returning cash to shareholders through dividends and share buybacks.
FANG is one of the largest and most efficient operators, while PR, which is much smaller, has built a strong position through consolidation and is itself a long-term acquisition candidate.
A successful resolution of the Strait of Hormuz crisis could lead to some pressure on these names, but we would note that exploration and production stocks tend to reflect expectations for future oil prices, which have risen from low levels in recent months and will likely stay somewhat elevated.
Prior to the war, stocks like PR and FANG had fallen out of favor amid weaker oil prices. Looking ahead, we expect investor interest in high-quality, resource-rich assets like these to persist. |
|
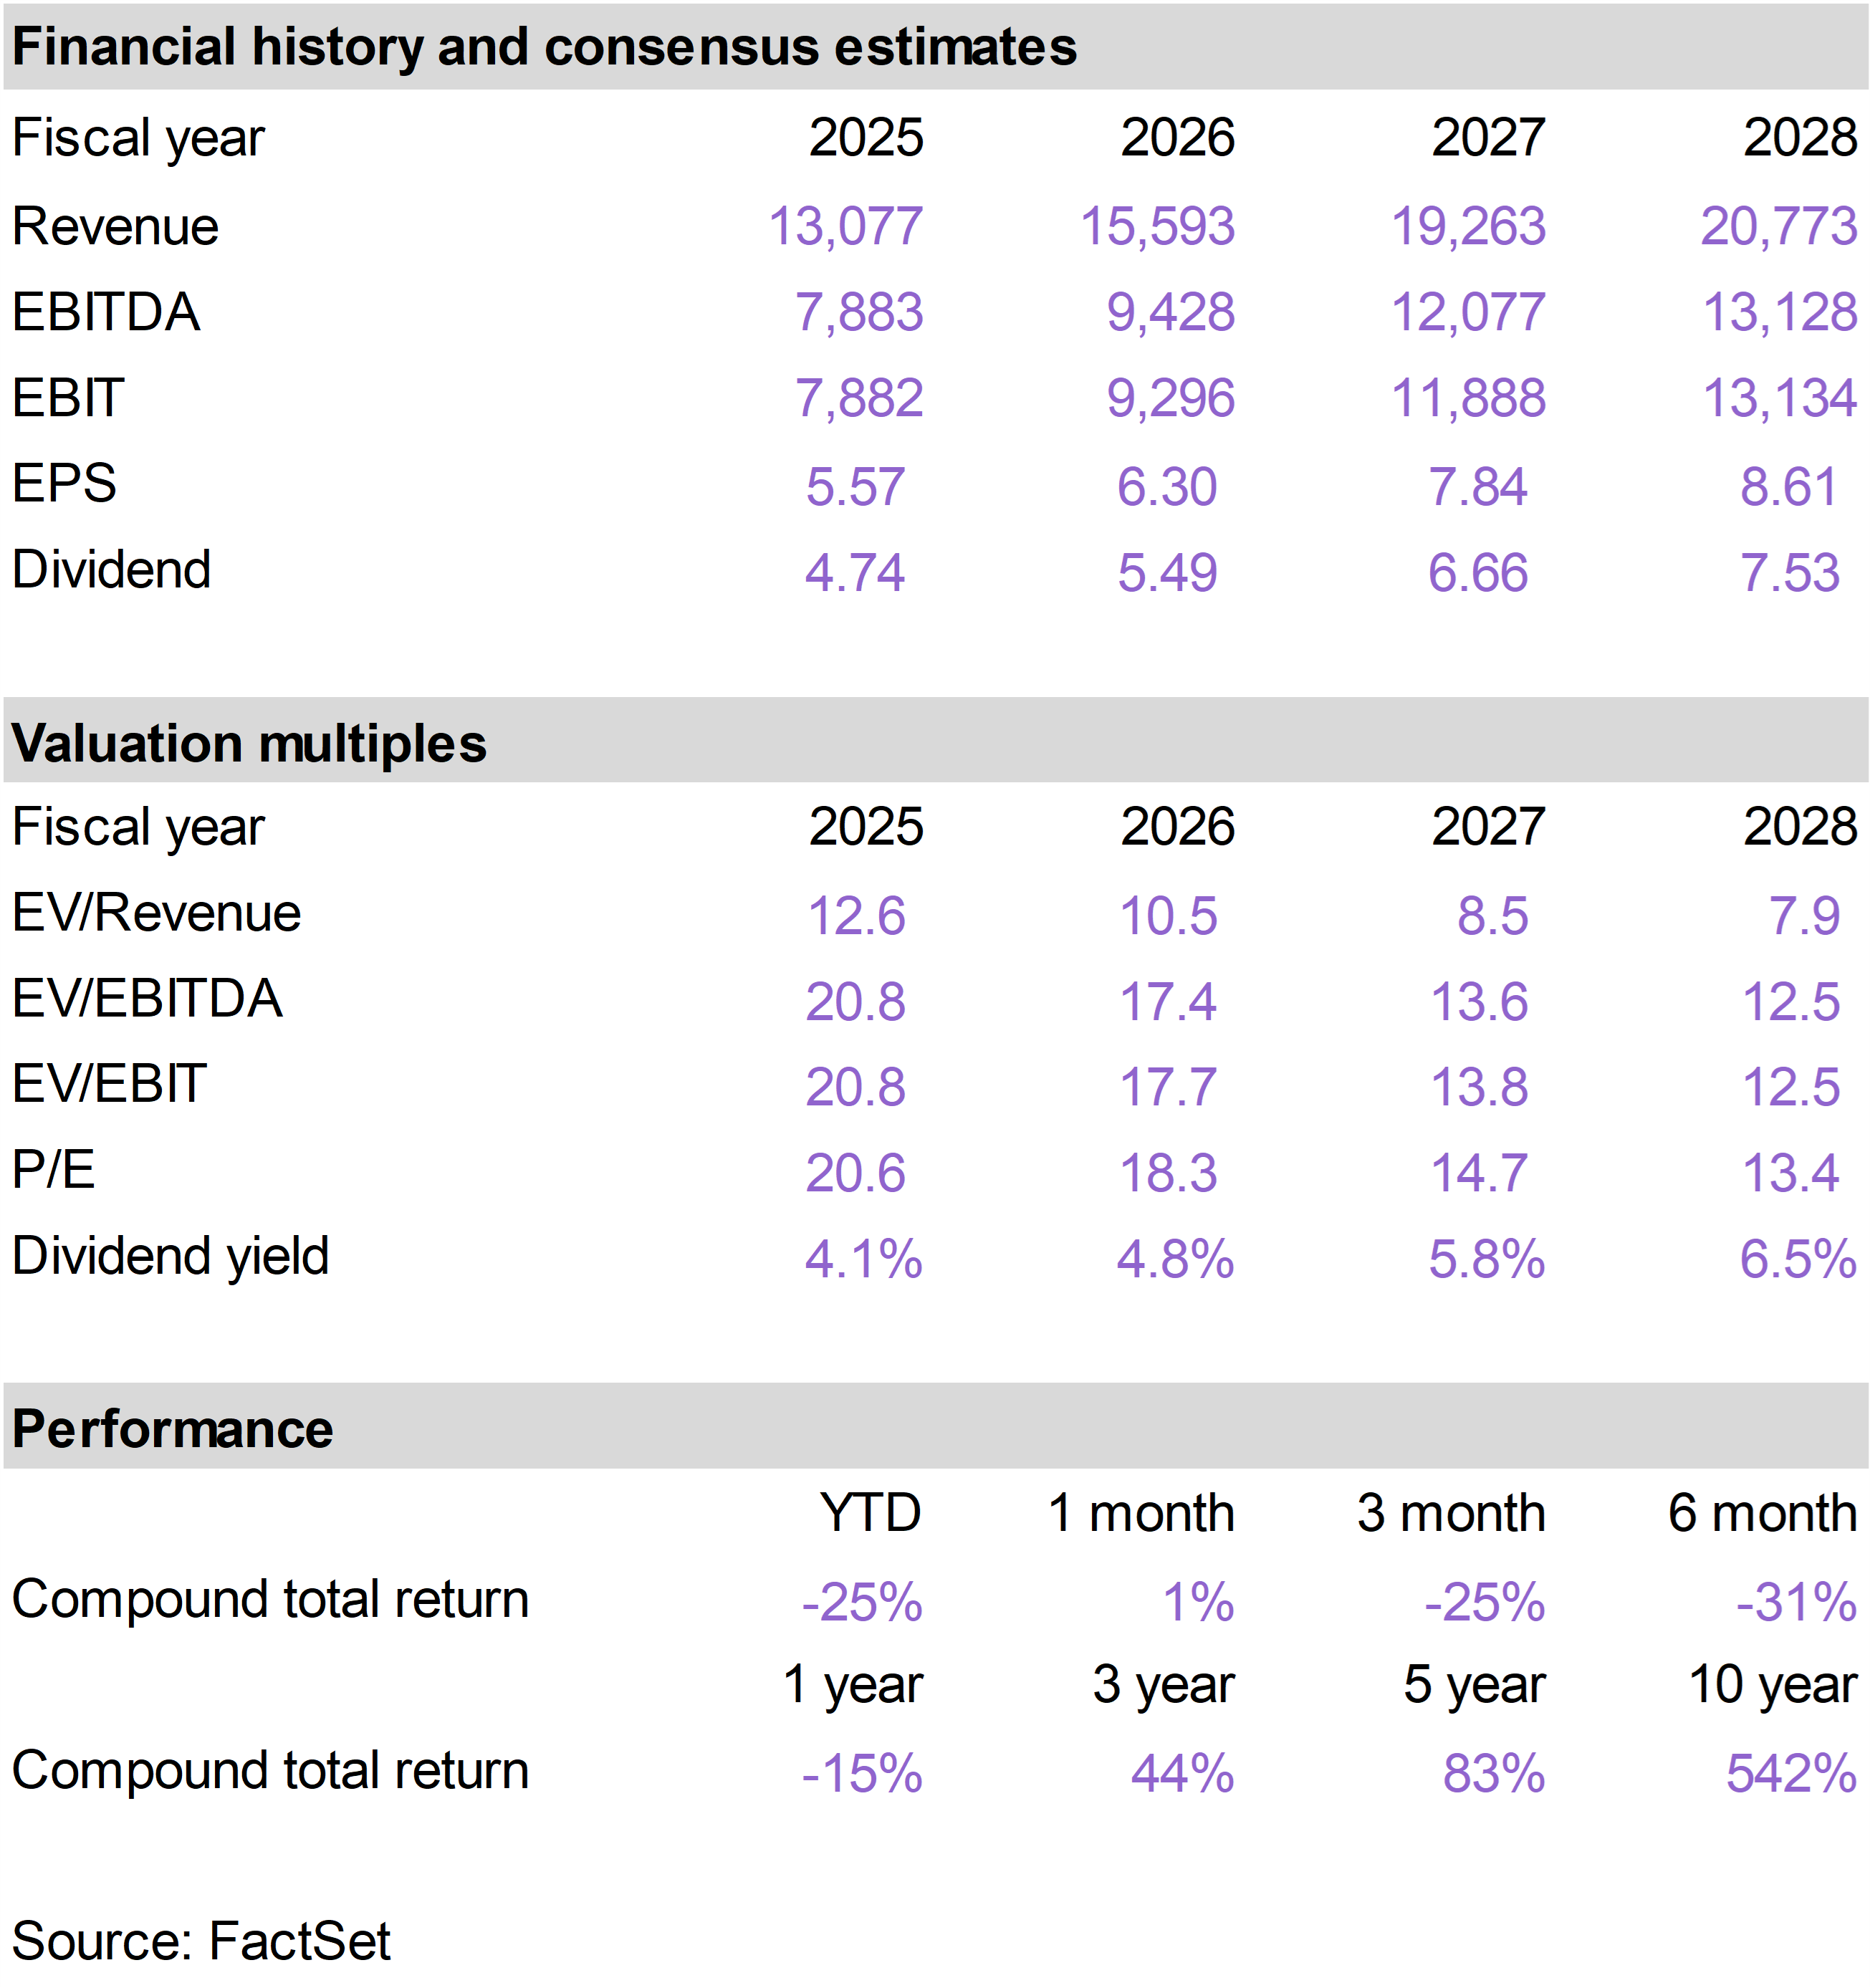
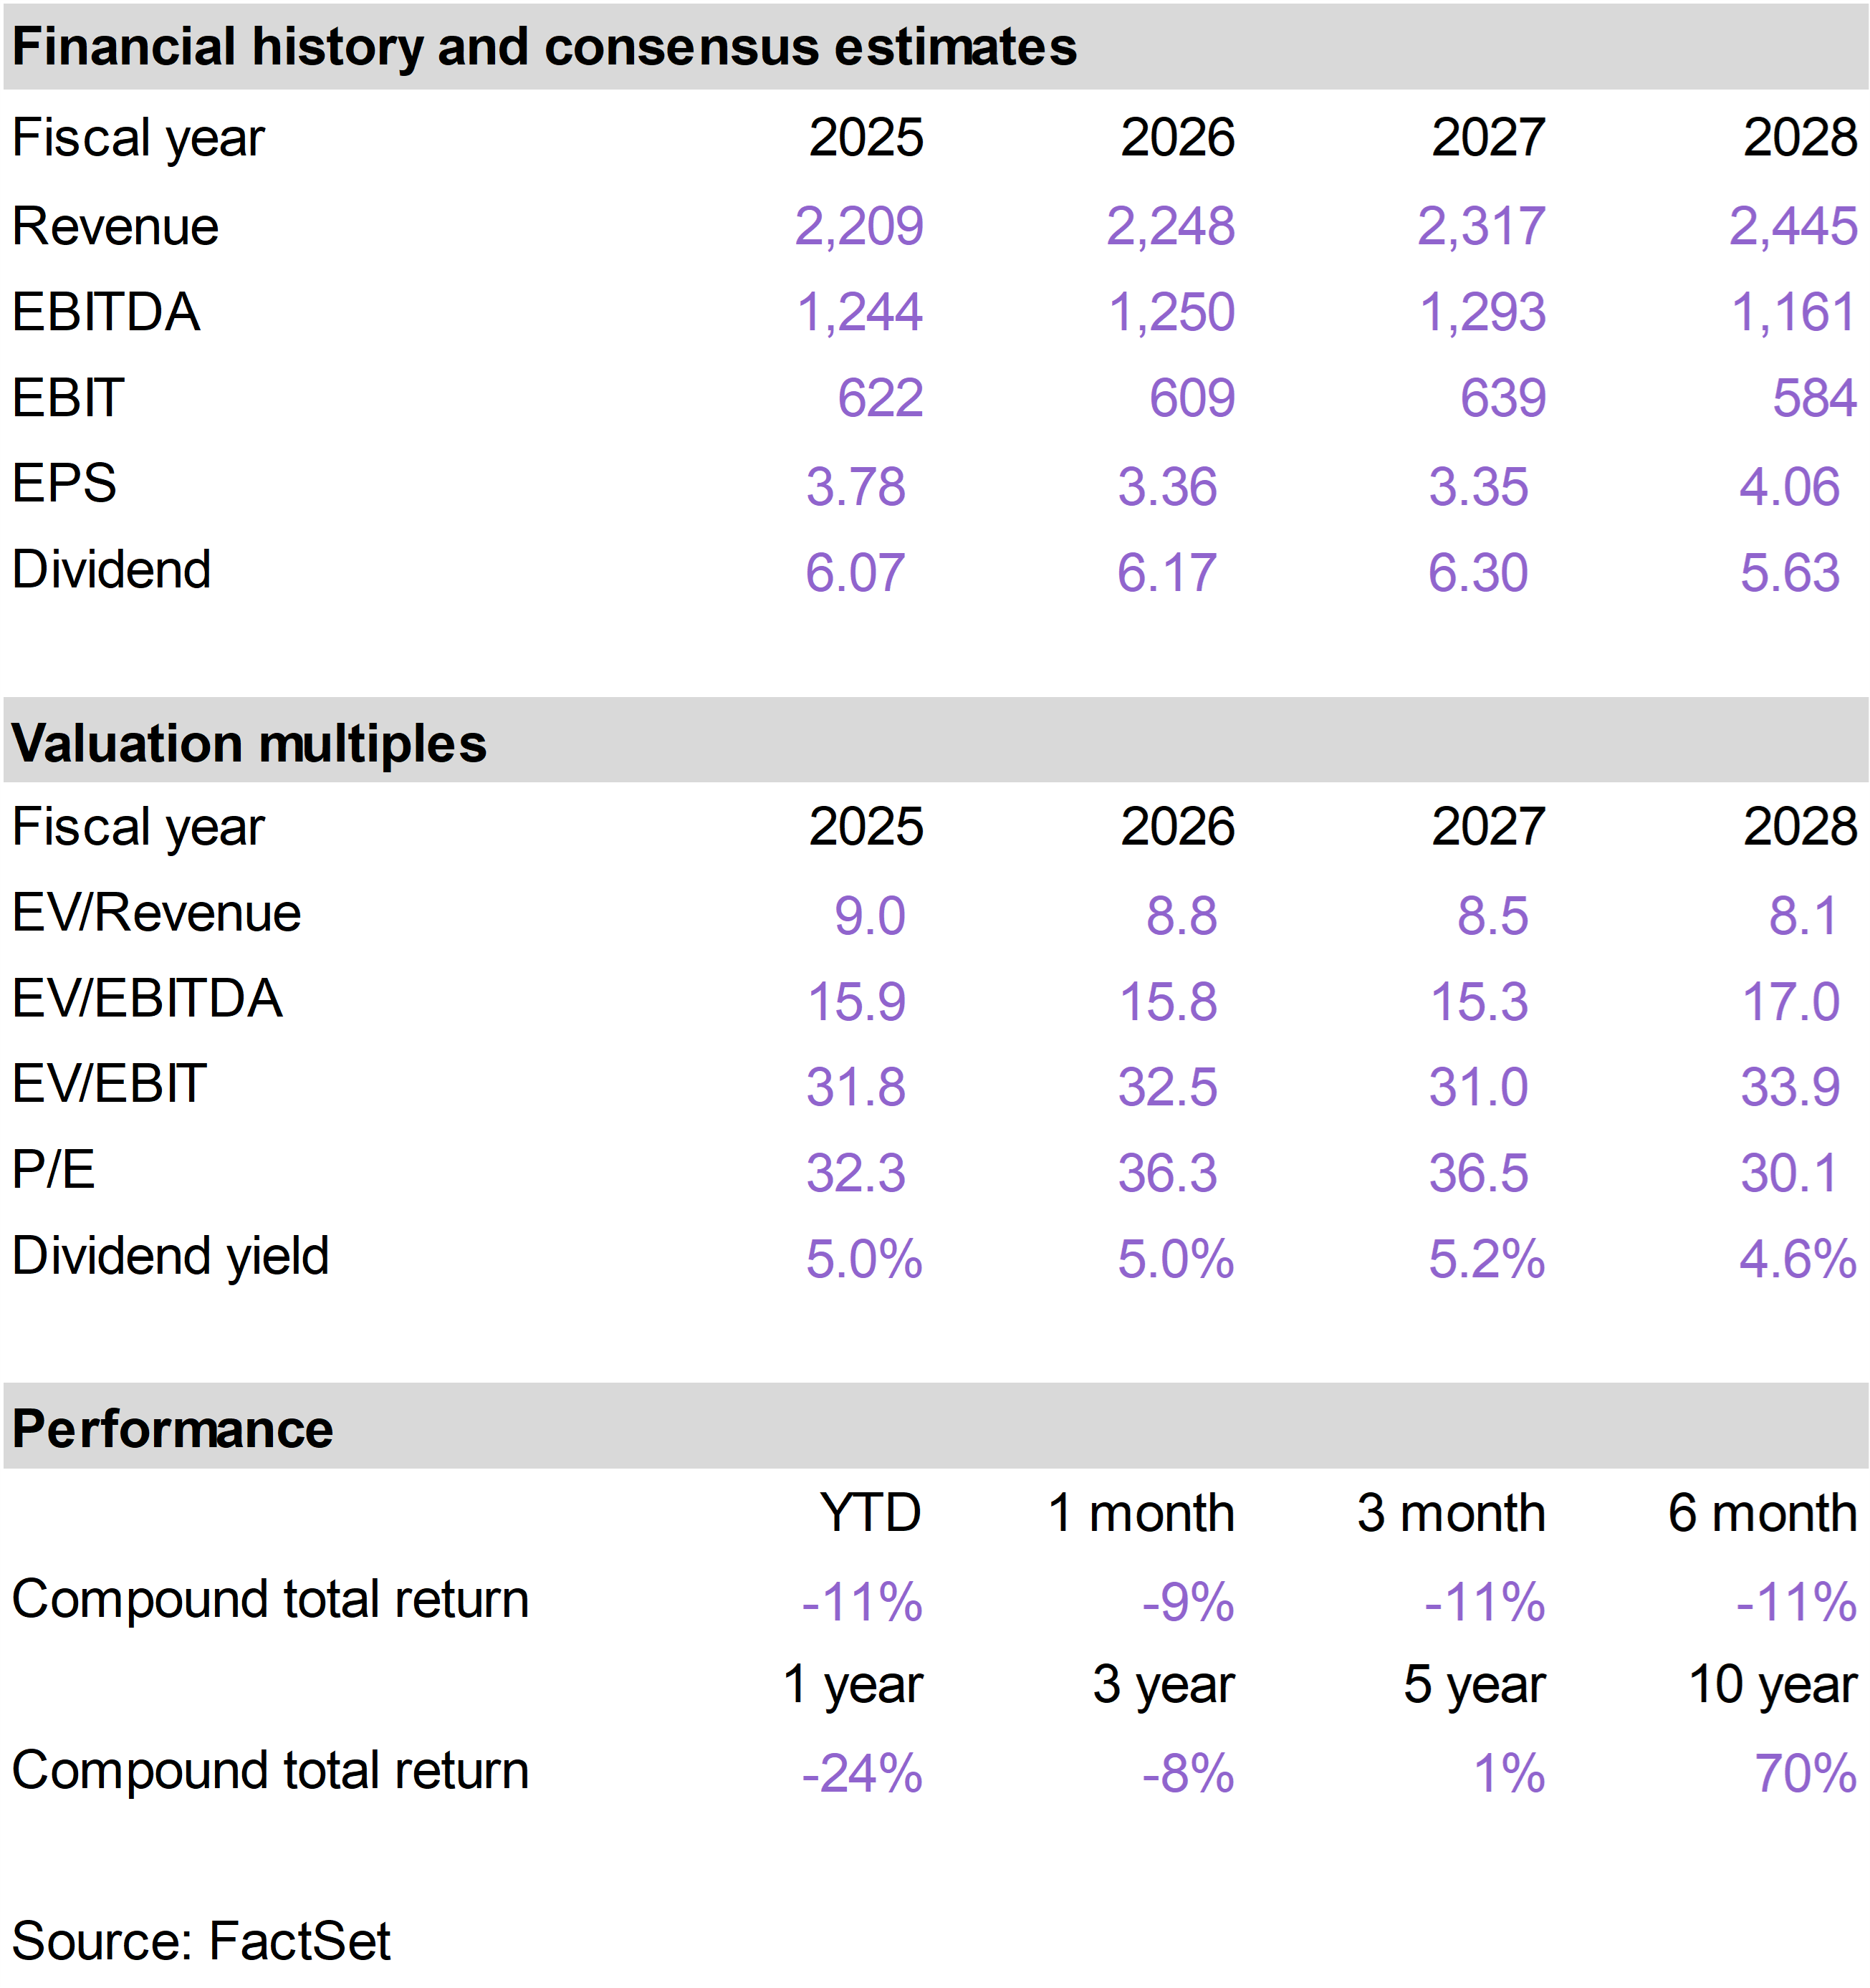
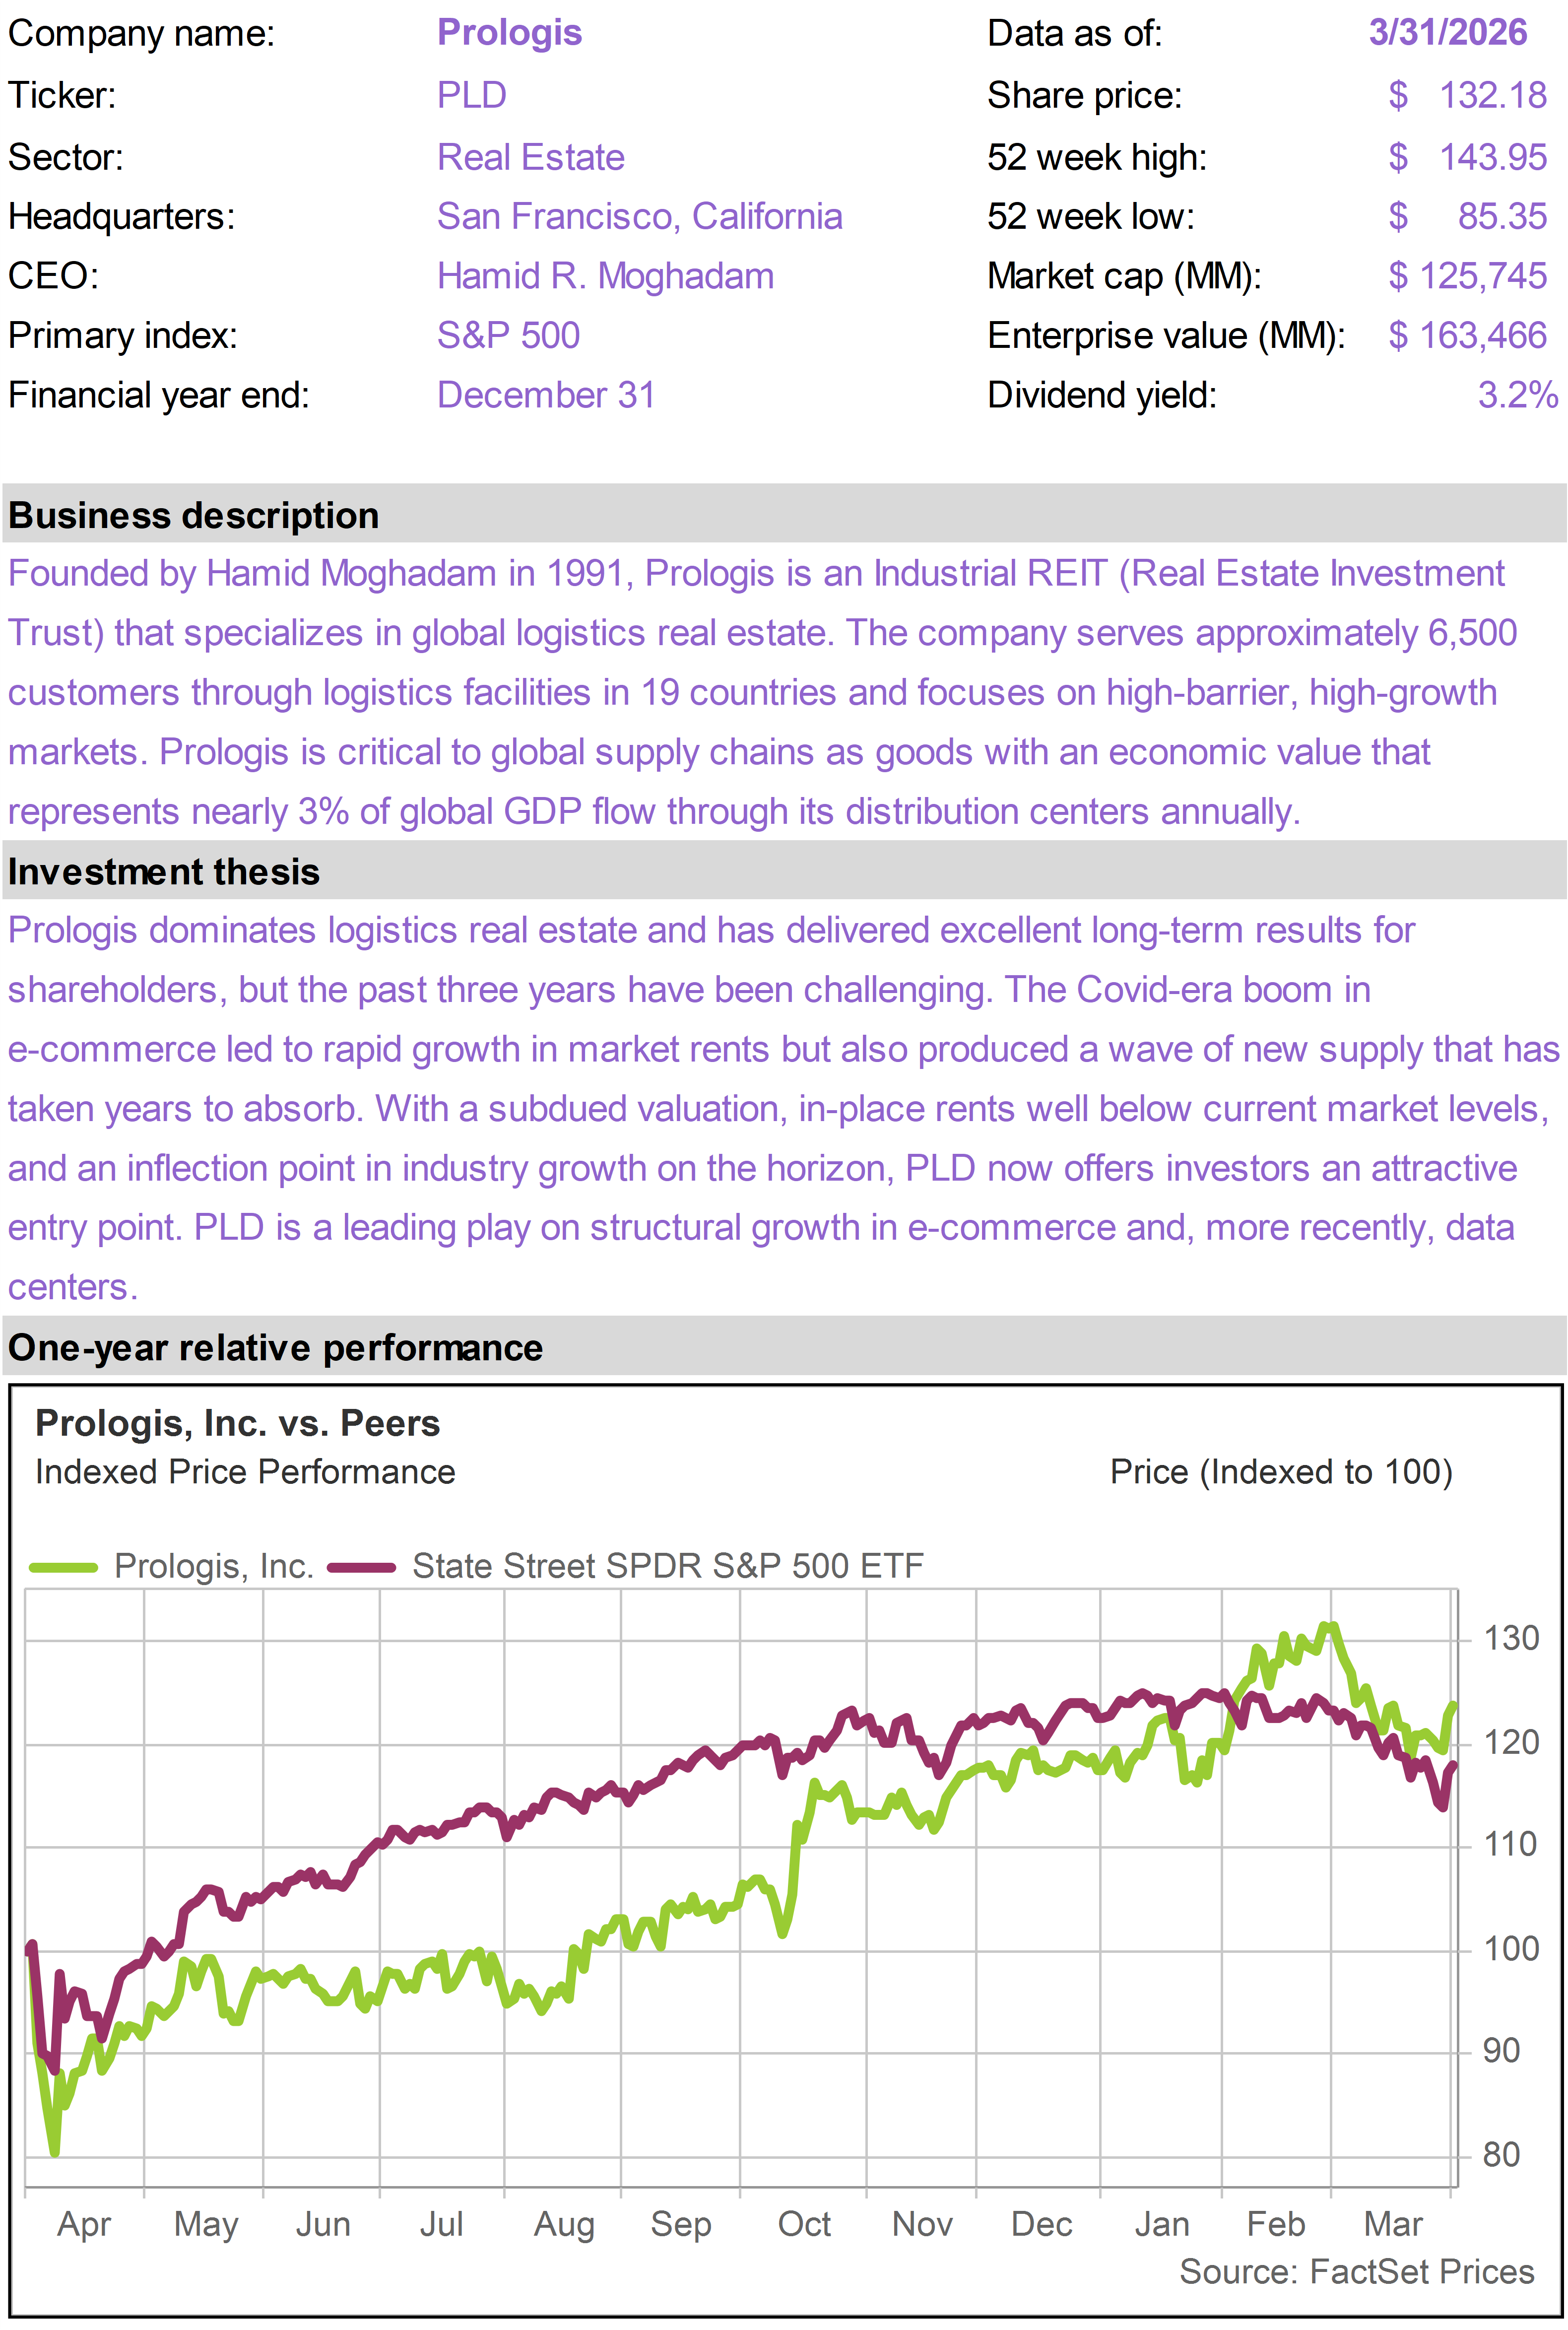
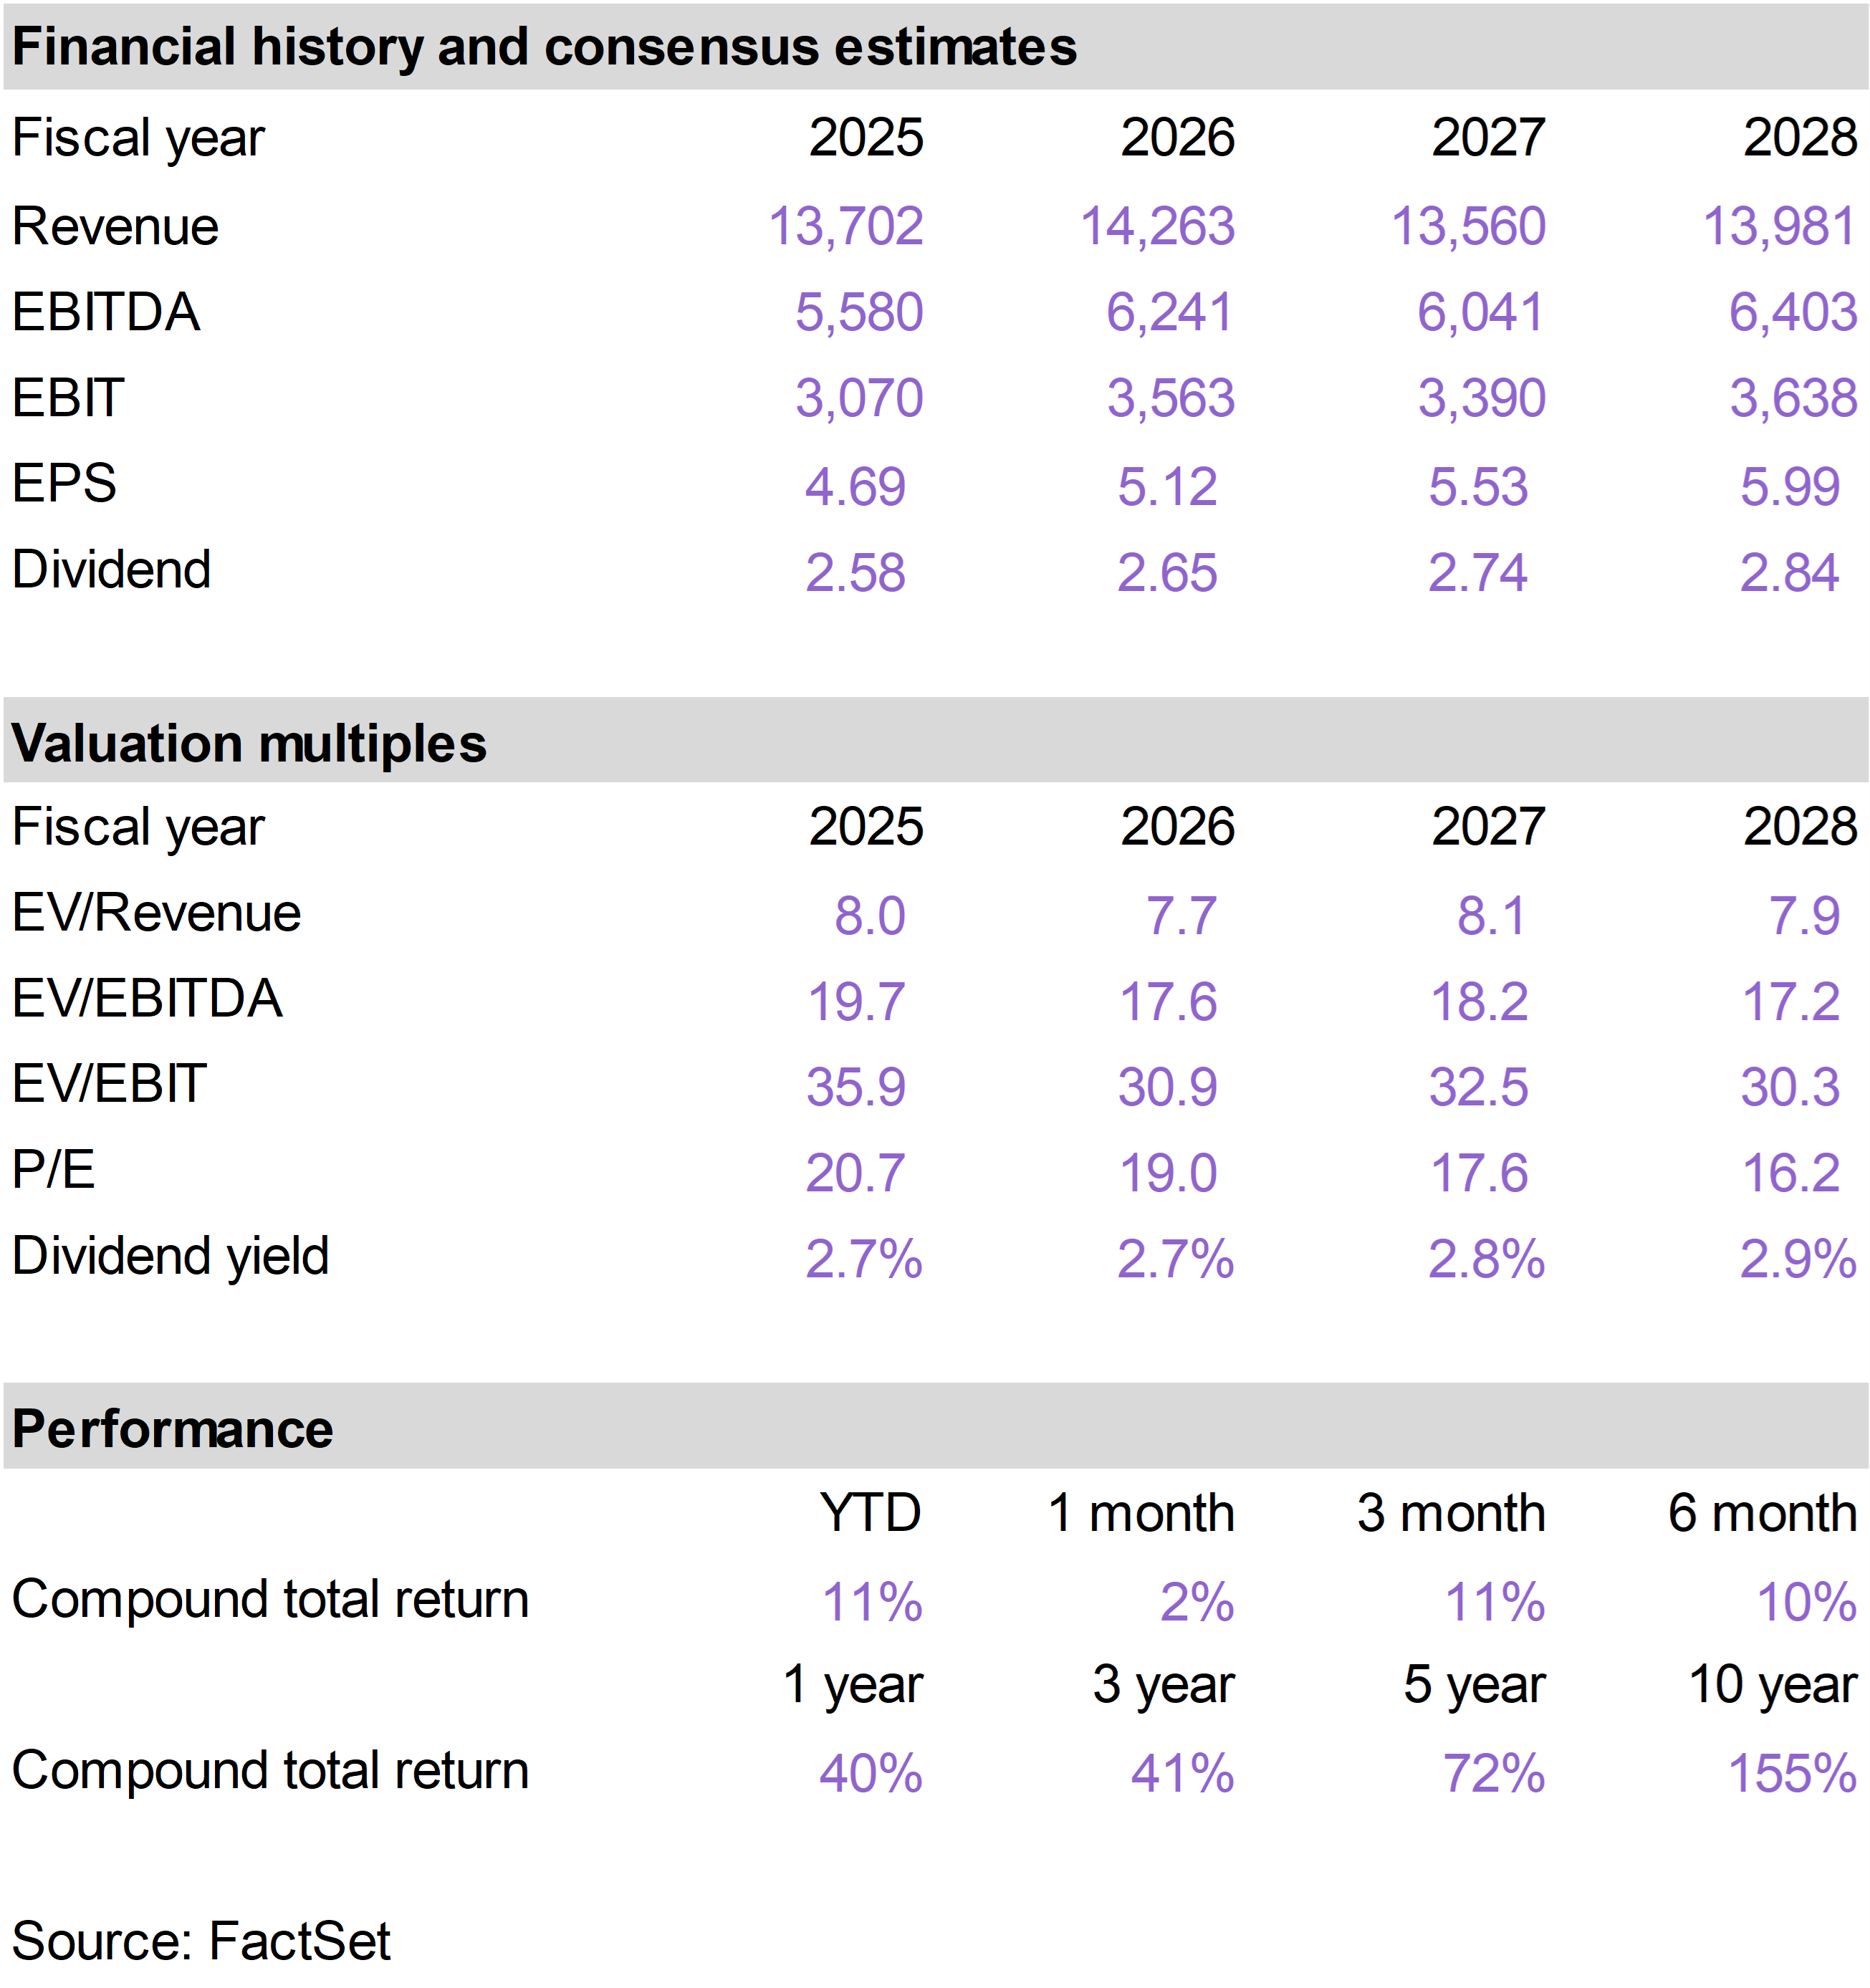
| | MAA, CCI and VICI—all three of which are Real Estate Investment Trusts (REITs)—were weak in March largely due to interest rate dynamics and broader sector pressure.
REITs are particularly sensitive to interest rates for two key reasons.
First, higher rates increase borrowing costs, which can pressure earnings and reduce the attractiveness of new investments.
Second, REITs compete with bonds for income-focused investors—when Treasury yields rise, REIT dividends become relatively less attractive, leading to valuation pressure.
In March, concerns that rates could remain higher for longer weighed on the group.
Notwithstanding the macro headwinds, VICI did deliver positive news during the month.
VICI, which owns experiential real estate such as casinos and resorts and generates income through long-term leases and financing investments, announced the expansion of its investment in One Beverly Hills, an ultra-luxury mixed use development in a prime location in Beverly Hills, California.
The company increased its total commitment to a $1.5 billion mezzanine loan while also securing a higher interest rate on the full investment. This structured financing allows VICI to earn attractive, predictable returns, with capital deployed over several years as construction progresses.
Importantly, the deal deepens VICI’s partnership with top developers and creates a pathway to redeploy capital into additional experiential investments, reinforcing its long-term external growth strategy. |
|
| | |
| | |
| | |
| | | |
|
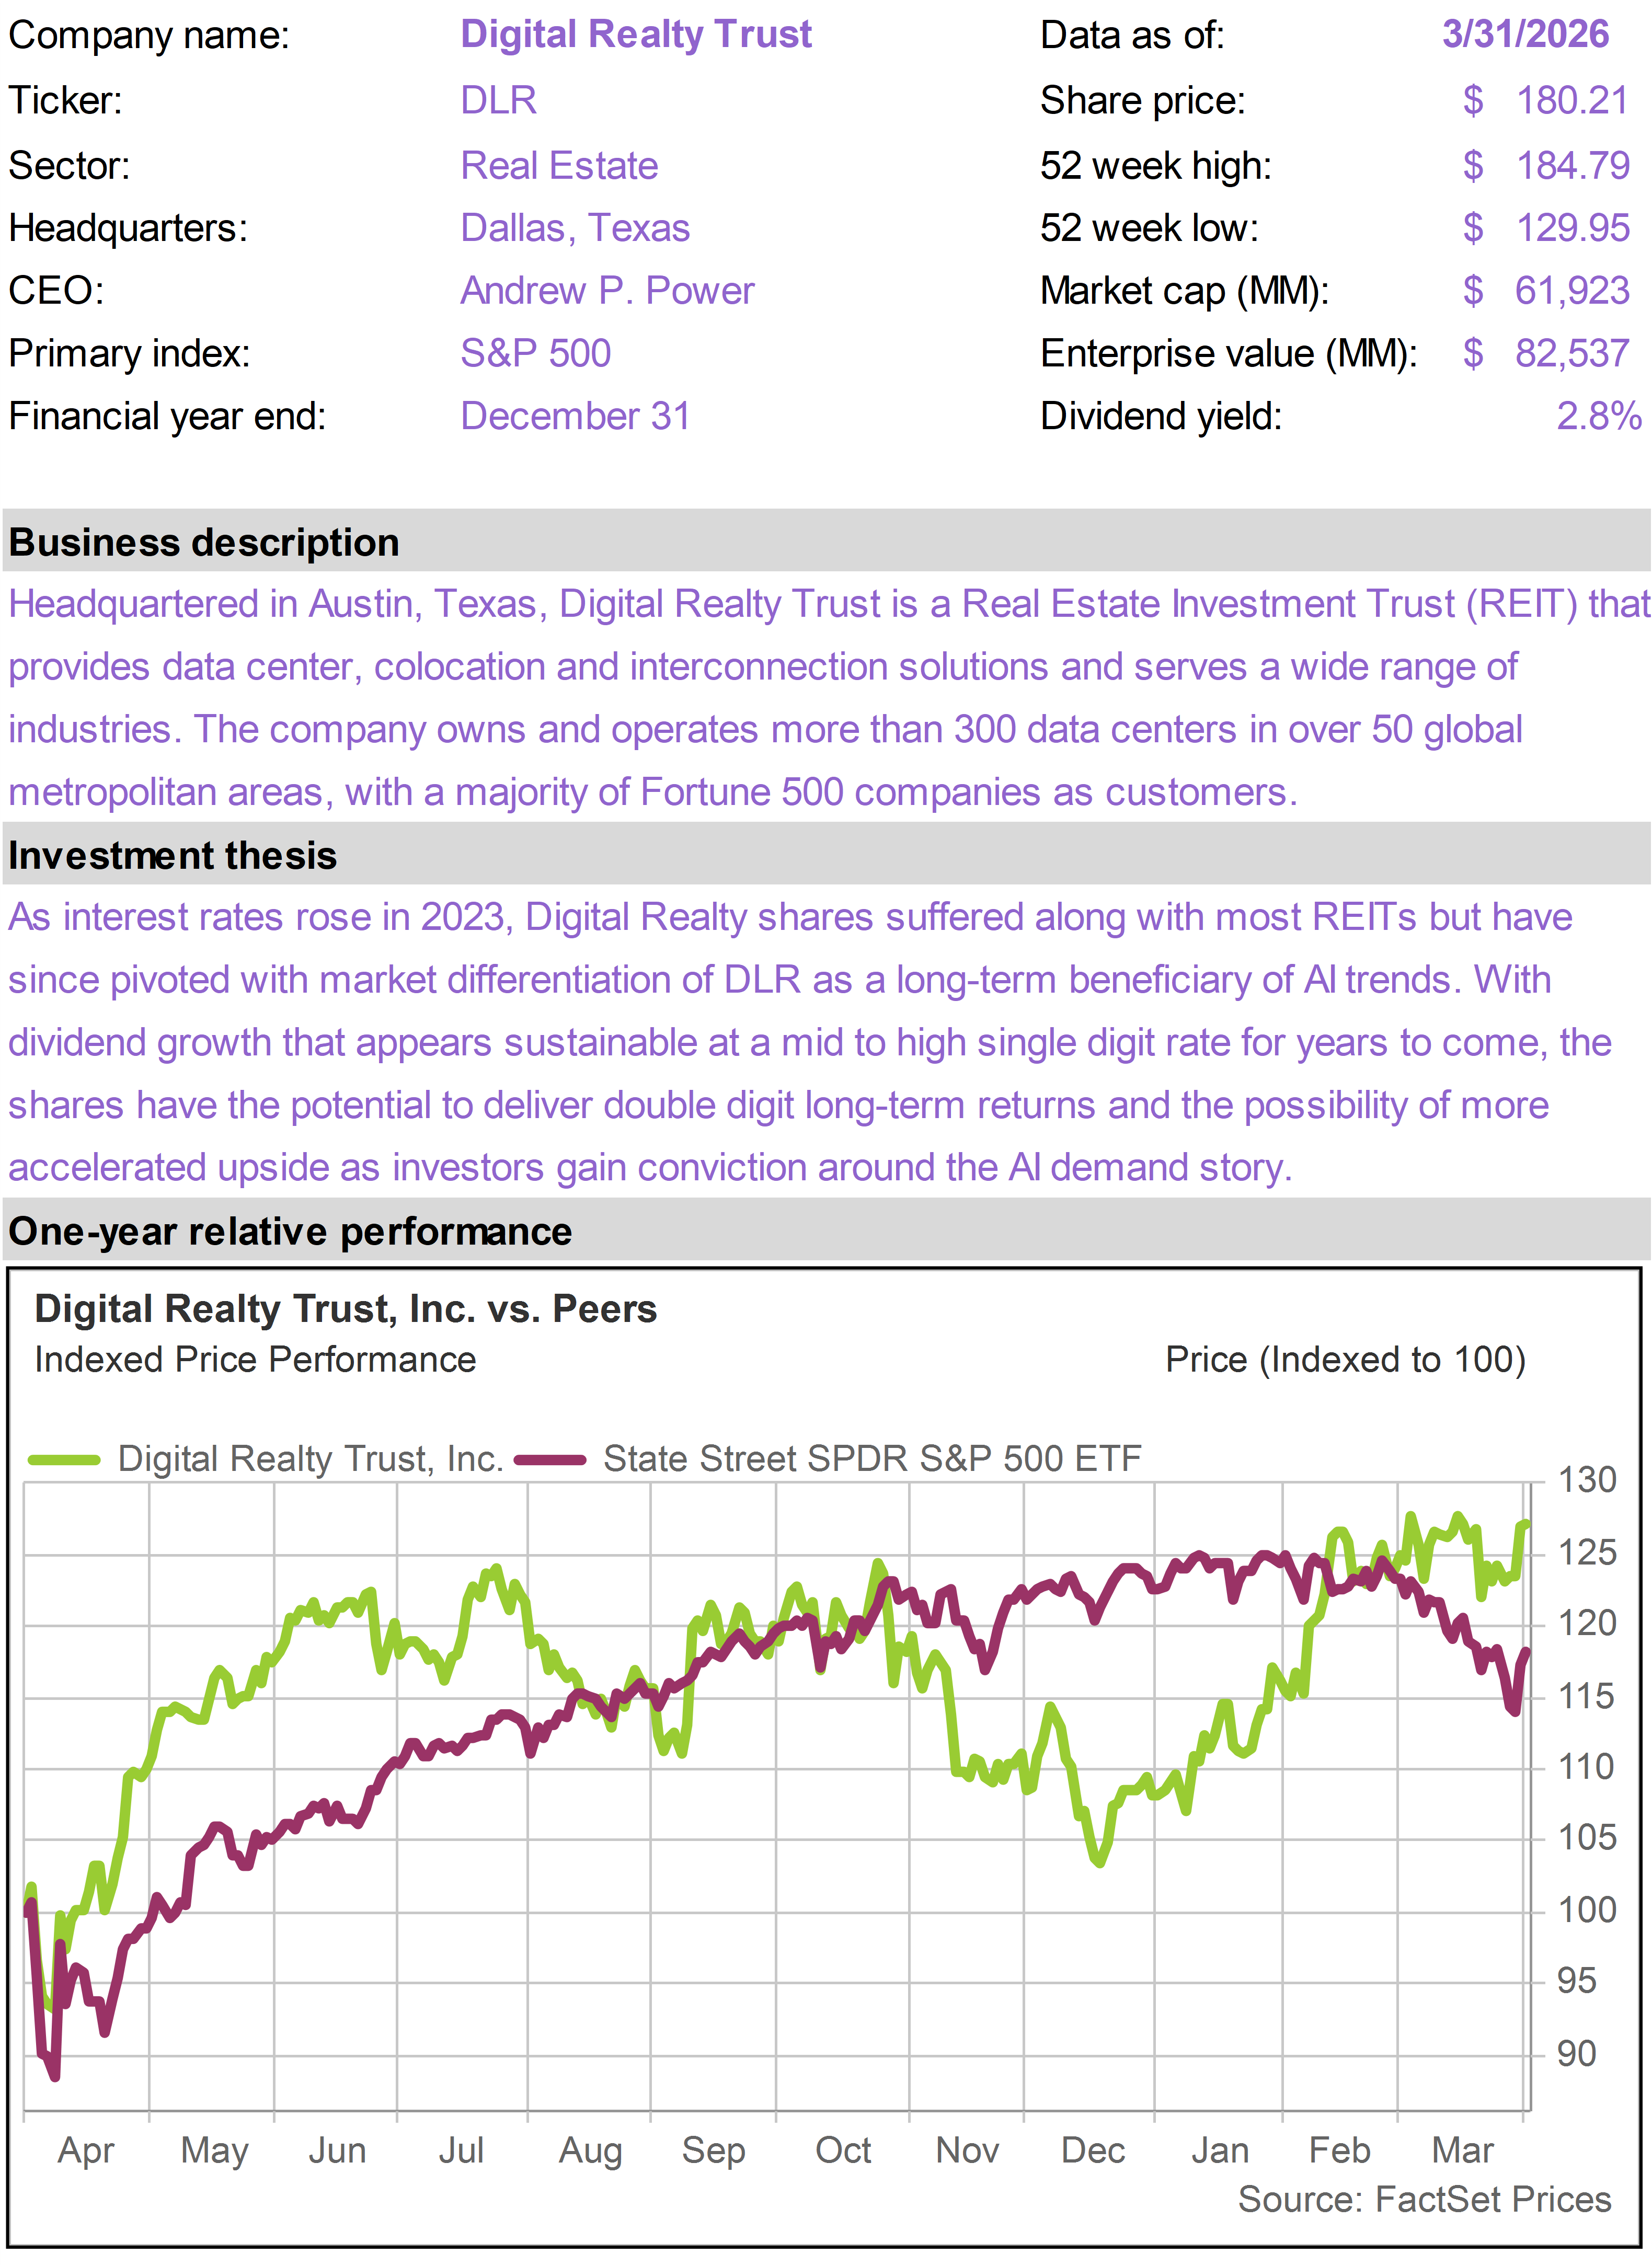
| | Digital Realty Trust (DLR) |
|
|
|
| | |
|
| | |
|
| | |
|
| | |
|
| | |
|
| | Diamondback Energy (FANG) |
|
|
|
| | |
|
| | Mid-America Apartment (MAA) |
|
|
|
| | |
|
| | |
|
| | |
|
| | Strategy 8% Perpetual Pref (STRK) |
|
|
|
| | |
|
| | The 76research Income Builder Model Portfolio is intended for income-oriented investors and managed to generate an overall yield that is materially higher than broad equity indices. The portfolio includes stocks with above average dividend yields from a cross section of industries. While investments are screened for their income and income growth characteristics, specific holdings are chosen based on valuation and general business quality, growth and risk considerations. |
|
| | FOR SUBSCRIBER USE ONLY. DO NOT FORWARD OR SHARE. |
|
| | | |
|
|
|
|
|