Income Builder
*|MC:SUBJECT|*
͏ ‌     ͏ ‌     ͏ ‌     ͏ ‌     ͏ ‌     ͏ ‌     ͏ ‌     ͏ ‌     ͏ ‌     ͏ ‌     ͏ ‌     ͏ ‌     ͏ ‌     ͏ ‌     ͏ ‌     ͏ ‌     ͏ ‌     ͏ ‌     ͏ ‌     ͏ ‌     ͏ ‌     ͏ ‌     ͏ ‌     ͏ ‌     ͏ ‌     ͏ ‌     ͏ ‌     ͏ ‌     ͏ ‌     ͏ ‌     ͏ ‌     ͏ ‌     ͏ ‌     ͏ ‌     ͏ ‌     ͏ ‌     ͏ ‌     ͏ ‌     ͏ ‌     ͏ ‌     ͏ ‌     ͏ ‌     ͏ ‌     ͏ ‌     ͏ ‌     ͏ ‌     ͏ ‌     ͏ ‌     ͏ ‌     ͏ ‌     ͏ ‌     ͏ ‌     ͏ ‌     ͏ ‌     ͏ ‌     ͏ ‌     ͏ ‌     ͏ ‌     ͏ ‌     ͏ ‌     ͏ ‌     ͏ ‌     ͏ ‌     ͏ ‌     ͏ ‌     ͏ ‌     ͏ ‌     ͏ ‌     ͏ ‌     ͏ ‌     ͏ ‌     ͏ ‌     ͏ ‌     ͏ ‌     ͏ ‌     ͏ ‌     ͏ ‌     ͏ ‌     ͏ ‌     ͏ ‌     ͏ ‌     ͏ ‌     ͏ ‌     ͏ ‌     ͏ ‌     ͏ ‌     ͏ ‌     ͏ ‌     ͏ ‌     ͏ ‌     ͏ ‌     ͏ ‌     ͏ ‌     ͏ ‌     ͏ ‌     ͏ ‌     ͏ ‌     ͏ ‌     ͏ ‌     ͏ ‌     ͏ ‌     ͏ ‌     ͏ ‌     ͏ ‌     ͏ ‌     ͏ ‌     ͏ ‌     ͏ ‌     ͏ ‌     ͏ ‌     ͏ ‌     ͏ ‌     ͏ ‌     ͏ ‌     ͏ ‌     ͏ ‌     ͏ ‌     ͏ ‌     ͏ ‌     ͏ ‌     ͏ ‌     ͏ ‌     ͏ ‌     ͏ ‌     ͏ ‌     ͏ ‌     ͏ ‌     ͏ ‌     ͏ ‌     ͏ ‌     ͏ ‌     ͏ ‌     ͏ ‌     ͏ ‌     ͏ ‌     ͏ ‌     ͏ ‌     ͏ ‌     ͏ ‌     ͏ ‌     ͏ ‌     ͏ ‌     ͏ ‌     ͏ ‌     ͏ ‌     ͏ ‌     ͏ ‌     ͏ ‌     ͏ ‌     ͏ ‌     ͏ ‌     ͏ ‌     ͏ ‌     ͏ ‌     ͏ ‌     ͏ ‌     ͏ ‌     ͏ ‌     ͏ ‌     ͏ ‌     ͏ ‌     ͏ ‌     ͏ ‌     ͏ ‌     ͏ ‌     ͏ ‌     ͏ ‌     ͏ ‌     ͏ ‌     ͏ ‌     ͏ ‌     ͏ ‌     ͏ ‌     ͏ ‌     ͏ ‌     ͏ ‌     ͏ ‌     ͏ ‌     ͏ ‌     ͏ ‌     ͏ ‌     ͏ ‌     ͏ ‌     ͏ ‌     ͏ ‌     ͏ ‌     ͏ ‌     ͏ ‌     ͏ ‌     ͏ ‌     ͏ ‌     ͏ ‌     ͏ ‌     ͏ ‌     ͏ ‌     ͏ ‌     ͏ ‌     ͏ ‌     ͏ ‌     ͏ ‌     ͏ ‌     ͏ ‌     ͏ ‌     ͏ ‌     ͏ ‌     ͏ ‌     ͏ ‌     ͏ ‌     ͏ ‌     ͏ ‌     ͏ ‌     ͏ ‌     ͏ ‌     ͏ ‌     ͏ ‌     ͏ ‌     ͏ ‌     ͏ ‌     ͏ ‌     ͏ ‌     ͏ ‌     ͏ ‌     ͏ ‌     ͏ ‌     ͏ ‌     ͏ ‌     ͏ ‌     ͏ ‌     ͏ ‌     ͏ ‌     ͏ ‌     ͏ ‌     ͏ ‌     ͏ ‌     ͏ ‌     ͏ ‌     ͏ ‌     ͏ ‌     ͏ ‌     ͏ ‌     ͏ ‌     ͏ ‌     ͏ ‌     ͏ ‌     ͏ ‌     ͏ ‌     ͏ ‌     ͏ ‌     ͏ ‌     ͏ ‌     ͏ ‌     ͏ ‌     ͏ ‌     ͏ ‌     ͏ ‌     ͏ ‌     ͏ ‌     ͏ ‌     ͏ ‌     ͏ ‌     ͏ ‌     ͏ ‌     ͏ ‌     ͏ ‌     ͏ ‌     ͏ ‌     ͏ ‌     ͏ ‌     ͏ ‌     ͏ ‌     ͏ ‌     ͏ ‌     ͏ ‌     ͏ ‌     ͏ ‌     ͏ ‌     ͏ ‌     ͏ ‌     ͏ ‌     ͏ ‌     ͏ ‌     ͏ ‌     ͏ ‌     ͏ ‌     ͏ ‌     ͏ ‌     ͏ ‌     ͏ ‌     ͏ ‌     ͏ ‌     ͏ ‌     ͏ ‌     ͏ ‌     ͏ ‌     ͏ ‌     ͏ ‌     ͏ ‌     ͏ ‌     ͏ ‌     ͏ ‌     ͏ ‌     ͏ ‌     ͏ ‌     ͏ ‌     ͏ ‌     ͏ ‌     ͏ ‌     ͏ ‌     ͏ ‌     ͏ ‌     ͏ ‌     ͏ ‌     ͏ ‌     ͏ ‌     ͏ ‌     ͏ ‌     ͏ ‌     ͏ ‌     ͏ ‌     ͏ ‌    ­ ­ ­ ­ ­ ­ ­ ­ ­ ­ ­ ­ ­ ­ ­ ­ ­ ­ ­ ­ ­ ­ ­ ­ ­ ­ ­ ­ ­ ­ ­ ­ ­ ­ ­ ­ ­ ­ ­ ­ ­ ­ ­ ­ ­ ­ ­ ­ ­ ­ ­ ­ ­ ­ ­ ­ ­ ­ ­ ­ ­ ­ ­ ­ ­ ­ ­ ­ ­ ­ ­ ­ ­ ­ ­ ­ ­ ­ ­ ­ ­ ­ ­ ­ ­ ­ ­ ­ ­ ­ ­ ­ ­ ­ ­ ­ ­ ­ ­ ­ ­ ­ ­ ­ ­ ­ ­ ­ ­ ­ ­ ­ ­ ­ ­ ­ ­ ­ ­ ­ ­ ­ ­ ­ ­ ­ ­ ­ ­ ­ ­ ­ ­ ­ ­ ­ ­ ­ ­ ­ ­ ­ ­ ­ ­ ­ ­ ­ ­ ­ ­ ­ ­ ­ ­ ­ ­ ­ ­ ­ ­ ­ ­ ­ ­ ­ ­ ­ ­ ­ ­ ­ ­ ­ ­ ­ ­ ­ ­ ­ ­ ­ ­ ­ ­ ­ ­ ­ ­ ­ ­ ­ ­ ­ ­ ­ ­ ­ ­ ­ ­ ­ ­ ­ ­ ­ ­ ­ ­ ­ ­ ­ ­ ­ ­ ­ ­ ­ ­ ­ ­ ­ ­ ­ ­ ­ ­ ­ ­ ­ ­ ­ ­ ­ ­ ­ ­ ­ ­ ­ ­ ­ ­ ­ ­ ­ ­ ­ ­ ­ ­ ­ ­ ­ ­ ­ ­ ­ ­ ­ ­ ­ ­ ­ ­ ­ ­ ­ ­ ­ ­ ­ ­ ­ ­ ­ ­ ­ ­ ­ ­ ­

Income Builder Model Portfolio

Monthly Portfolio Review: October 2025

Publication date: November 3, 2025

Current portfolio holdings

FOR SUBSCRIBER USE ONLY. DO NOT FORWARD OR SHARE.

Executive summary

  • Tech stocks drove upside in the S&P 500 in October, while the average stock in the index produced negative returns.

  • The Income Builder portfolio delivered a negative result, with the vast majority of its holdings in sectors experiencing weaker sentiment.

  • A bright spot in the portfolio was Prologis (PLD), which now offers two interesting sources of upside: the long-awaited inflection in industrial real estate and data center conversion opportunities.

  • The portfolio’s alternative asset manager plays, Blackstone (BX) and Carlyle Group (CG), sold off sharply—in our view, excessively— in reaction to general market concerns around private credit.

  • Our newest position in the portfolio, Strategy 8% Perpetual Preferred (STRK), now benefits from advantageous dividend tax treatment, which we explain.

  • While many Income Builder positions sit outside areas of market momentum, we view valuation levels across the portfolio as compelling and have high confidence in the positions.

  • The portfolio continues to deliver a weighted average 4% dividend yield, well above index averages.

Performance review

The Income Builder portfolio returned -6.1% in October, while the S&P 500 Index returned 2.3%. On a year to date basis, the portfolio has generated a total return of 0.3%, versus 17.5% for the index.


The top performing position in the portfolio in October was Prologis (PLD), which returned 8%.


Notable detractors to the portfolio this month were Carlyle Group (CG), which returned -15%; Blackstone (BX), which returned -14%; and Texas Instruments (TXN), which returned -11%.


Tech dominant again


We noted last month that the tech sector significantly outperformed. This trend continued in October.


The tech-heavy Nasdaq Composite Index returned 4.7% this month. Large-cap tech stocks helped drive the performance of the market-cap weighted S&P 500 into positive territory. Meanwhile, the S&P 500 Equal Weight Index, which essentially reflects the average stock in the index, declined, returning -1.0%.


S&P 500, NASDAQ, S&P 500 Equal Weight

Total Return (9/30/25 - 10/31/25)


Positioning around AI


Stock market activity in October struck us as somewhat unusual and potentially impacted by mutual fund “window dressing” in the final ten days of the month.


We can see in the chart above that through October 22, the Nasdaq, S&P 500 and S&P 500 Equal Weight had generated similar performance. Relative performance then began to deviate sharply as the Nasdaq surged.


Window dressing is a phenomenon that can occur in any month or quarter. The general idea is that fund managers have an incentive to end the period with winners in the portfolio rather than losers. Portfolio holdings are only revealed at the end of these periods.


October 31 is a particularly significant date, because many mutual funds use that as their fiscal year end (approximately half of all stock funds). The IRS requires funds to distribute nearly all of their realized capital gains through November 1, so October 31 is a natural cut-off date.


The annual reports of mutual funds provide full disclosure of portfolio holdings and get filed as of the fiscal year end cut-off date. So if there is ever a moment that fund managers want to make their portfolios look pretty, it is at the end of the fiscal year.


This activity can put pressure on stocks and entire sectors that were laggards over the prior year and elevate stocks and sectors that have performed well. However, the impact is temporary, as this source of market distortion goes away once the new fiscal year begins.


To the extent fund managers are worried about optics, their incentive is to move money into the best performing stocks prior to the books closing. This may have played a meaningful role in October, especially at the very end of the month.


The Technology sector generated a total return of 7% in October, while the majority of other industry sectors produced flat or negative performance.

Source: FactSet


Sorting AI winners and losers


AI continues to occupy the focus of most investors. There is a general concern about an AI bubble, which we recently addressed in the 76report (“So, Are We Headed for a Crash or What?”)


There are several dimensions to this concern. Investors are in part anxious because AI plays, like NVIDIA (NVDA), which now has a $5 trillion market cap and represents 8% of the S&P 500 Index, have become such a huge component of the overall market.


Investors seem to toggle between anxiety around AI overvaluation and fear of being underinvested in the market leaders of the technological trend that is reshaping the entire economy.


With so much uncertainty around AI, there is also a great deal of trepidation around whether any particular stock will ultimately benefit or suffer from the technological changes that are underway. No company wants to be perceived as an AI victim, and no fund manager wants to own one.


Meanwhile, stocks that are simply not seen as central to the AI theme, even ones that may be longer term AI beneficiaries, are arguably being neglected.


Broader economic concerns


As investors focus on the trajectory of AI and the best way to play it, they also have a lot of questions about what is going on across the rest of the economy.


AI-related capital spending is driving growth, but it is also diverting funds from hiring workers. On top of that, as AI actually gets implemented, it will inevitably replace workers.


Although classified within the Consumer Discretionary sector, Amazon (AMZN) is a tech stock that performed especially well in October, delivering an 11% total return.


Even with this strong performance, AMZN has actually underperformed this year. It was essentially flat on the year until late October, when the company reported solid third quarter results.


AMZN showed acceleration in its cloud business, but what really caught the market’s attention was its announcement that it would be laying off some 14,000 workers, a move driven by its goal of becoming a leaner organization that is empowered by AI tools.


As the second largest private employer in the United States behind Walmart (WMT), AMZN is an interesting company to watch from a labor market perspective—a potential canary in the coalmine.


The Fed cuts again


Against the backdrop of this emerging trend of companies demonstrating healthy earnings growth and a shrinking employee base, the Federal Reserve moved to cut interest rates again at the October 29 FOMC meeting. The Fed funds rate was reduced by 25 basis points to the 3.75% to 4.00% range.


New Fed Governor Stephen Miran, on leave from his position as Trump’s Chair of the Council of Economic Advisers, dissented like he did at the prior meeting. He again wanted to see a 50 basis point cut.


Miran’s dissent reminds the world that a new regime at the Fed likely awaits us next spring when Jerome Powell’s term as Chair comes to an end. Under new leadership, the Fed will almost certainly be inclined toward lower rates and easier monetary policy to promote growth.


At the late October meeting, the Fed also indicated it would end Quantitative Tightening (QT) on December 1. This policy shift relates to how it manages its own balance sheet.


While the mechanics behind QT can be complex, the key point is straightforward: by slowing or ending QT, the Fed is signaling a willingness to increase liquidity in financial markets. This complements the move toward lower interest rates and indicates a broader policy shift toward easing financial conditions.


The 25 basis point rate cut was fully expected, however, and Powell’s tone on the path of future rate cuts was interpreted as slightly hawkish. So short-term Treasury yields rose slightly at the end of the month following the meeting, which may have also put pressure on stocks in cyclical sectors.

1-Year Treasury Yields

(Last 12 months)


The main topic for the Fed remains jobs. Even though inflation remains “somewhat elevated,” the Fed has been reacting to slowing job gains and an unemployment rate that “has edged up.”  


While the pressure on the labor market understandably makes many investors uneasy, as it historically correlates with an economic slowdown, we continue to view it as a net positive for investors in stocks because it is the necessary pre-condition for easier monetary policy.


To the extent unemployment rises, the Fed will remain inclined to keep rates low, given its full employment mandate. A weak job market also takes the edge off inflation pressures, as wages inevitably moderate with workers losing bargaining power.


Higher unemployment also dampens consumer confidence and spending on the margin, which gives the Fed yet another reason to keep its foot on the gas pedal.


A massive spike in unemployment, like was saw in 2020 when the economy got shut down, is an entirely different matter, but moderate slack in the labor market helps keep the Fed biased toward making monetary conditions “less restrictive.”


Out of favor opportunities


We like to compare the S&P 500 to the S&P 500 Equal Weight Index because it shows the extent to which performance is being driven by the very large market cap leaders.


Over long periods of time, the two indexes tend to deliver similar performance, but there are phases when large cap names, which are skewed towards the big tech platforms, significantly outperform. The past few months have been one of those phases.


S&P 500 vs. S&P 500 Equal Weight

Total Return (Last 5 Years)


Investments in broad, passive index strategies, especially those tied to the S&P 500 and the Nasdaq, tend to perform well during periods of market concentration, when a relatively small group of large companies drives the majority of returns.


In these environments, capital crowds into the biggest winners, pushing valuations higher and reinforcing the momentum. For investors who own high-quality businesses outside of the prevailing narrative, this can be frustrating.


Solid companies with durable earnings power may underperform simply because they are not aligned with the hottest themes of the moment.


Over time, fundamentals tend to reassert themselves: leadership rotates, valuations normalize, and neglected areas of the market reprice. Periods of dispersion therefore create opportunity for investors who are steadily accumulating ownership in strong, well-positioned businesses that may be temporarily out of the spotlight.

Portfolio highlights

The top performing position within the portfolio in October was Prologis (PLD), which delivered an 8% total return.


The most notable detractors in the portfolio were Carlyle Group (CG), which returned -15%; Blackstone (BX), which returned -14%; and Texas Instruments (TXN), which returned -11%.

Turning the corner


As the world’s largest player in industrial real estate (warehouses and distribution centers), PLD shares have languished for several years, as we noted when we added PLD to the Income Builder portfolio back in February (refer to Prologis(PLD): Getting Back to Growth).


PLD vs. S&P 500

Total Return (Last 5 Years)

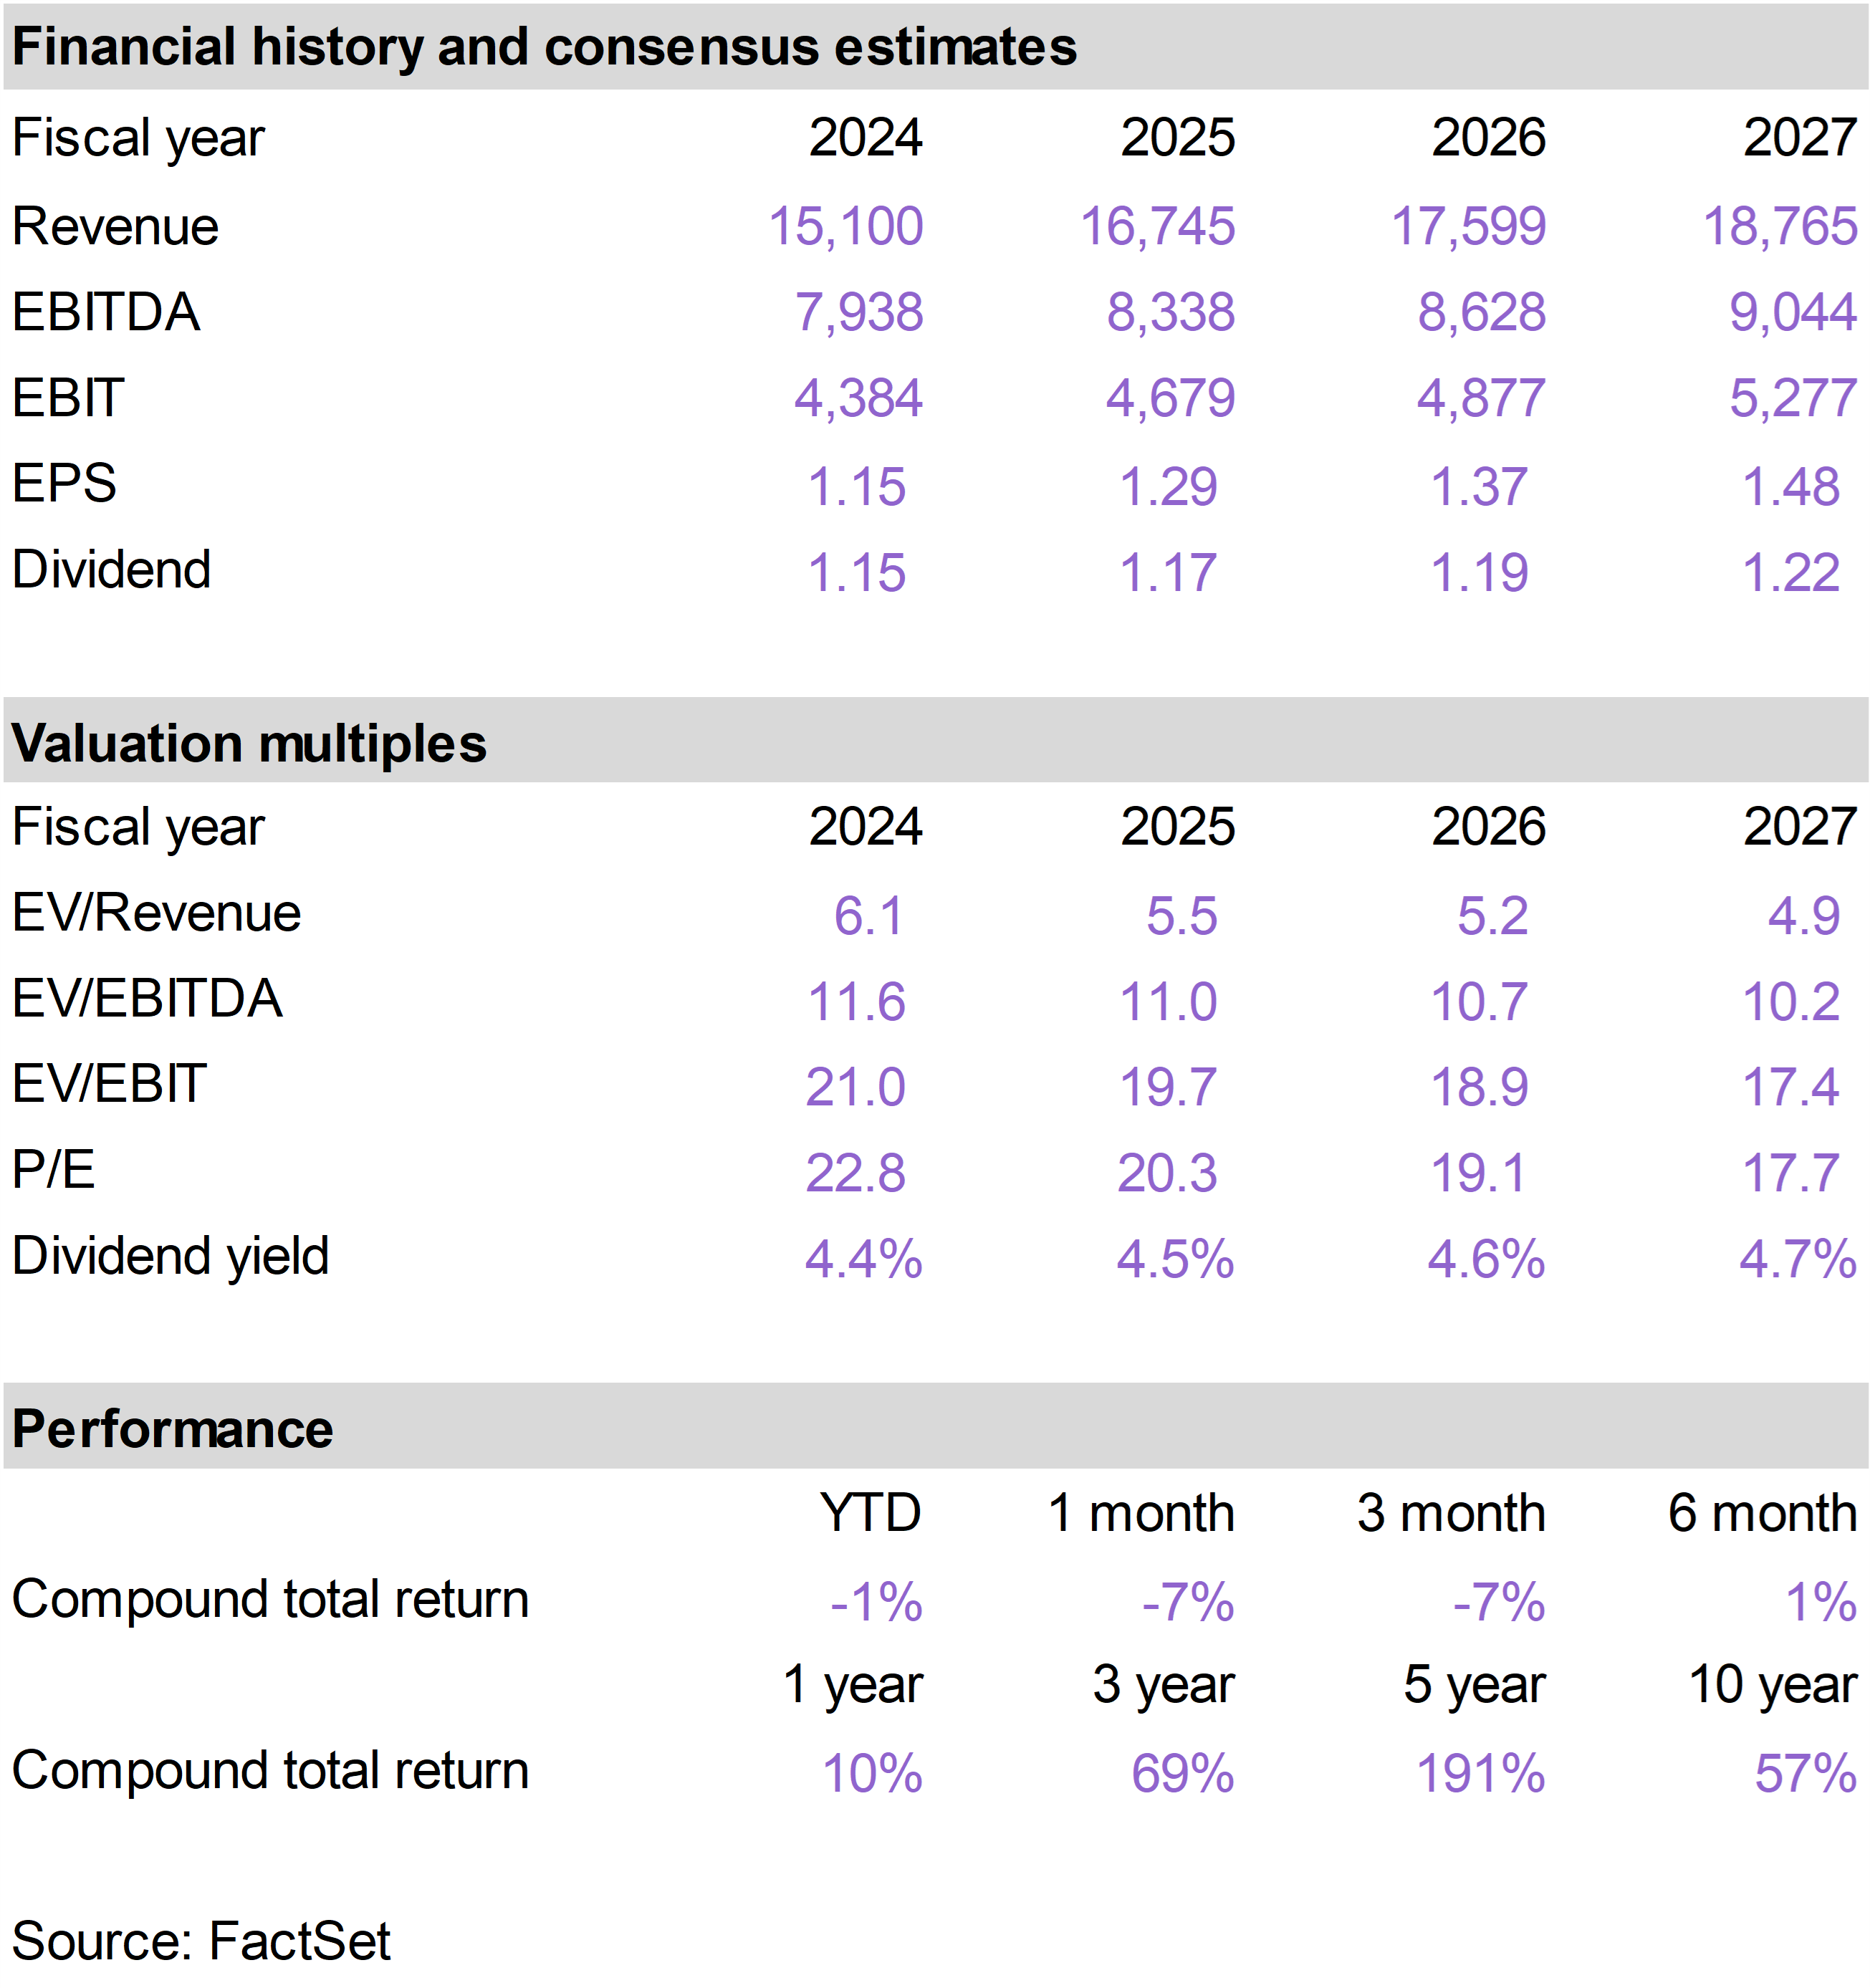
The surge in e-commerce with the onset of the pandemic led to massive global demand for warehouse capacity. PLD performed extremely well through early 2022 as warehouse rents surged.


The industry invested heavily in new space, however, and e-commerce demand soon moderated as Covid restrictions disappeared. This led to a sharp rebalancing of supply/demand conditions.


After several years of excess capacity absorption, the logistics space is now once again getting much tighter. In its mid-October third quarter earnings report, PLD reported record leasing activity and nudged up forward guidance.


Industrial real estate operates with long cycles. Just as it took several years to absorb the aggressive buildouts of the Covid-era, we are now looking at a multi-year period of tightening supply and rising rents.


Development pipelines have slowed meaningfully due to higher interest rates and construction costs, while demand has continued to rise steadily.


As a result, market vacancy is drifting lower again, and lease roll-ups are trending well above expiring rents. For PLD, whose portfolio is heavily weighted toward key logistics corridors and modern distribution facilities, this translates into strong pricing power, high occupancy, and steady internal cash flow growth.


There is now an additional growth driver as well… data centers.


PLD is of course primarily a logistics player, but it is now participating in the data center build-out because it already controls millions of square feet of strategically located real estate that data center developers need.


Modern data centers require large parcels close to cities, access to utility-scale power, and dense fiber connectivity—the exact locations where PLD has spent decades assembling and entitling logistics land.


Rather than becoming a data center operator, PLD is leveraging its existing land bank and warehouse footprint to offer “powered shells” and development sites to hyperscale cloud providers. This allows PLD to capture higher rents and multi-decade lease terms with minimal incremental risk.


PLD is early in this opportunity to convert warehouses and vacant land into “higher and better use” data centers, but investors are increasingly focused on it. Some analysts are already calculating the potential value creation from this additional growth driver, which was largely ignored twelve months ago, as approximately 10% to 15% of the current share price.


Cockroach phobia


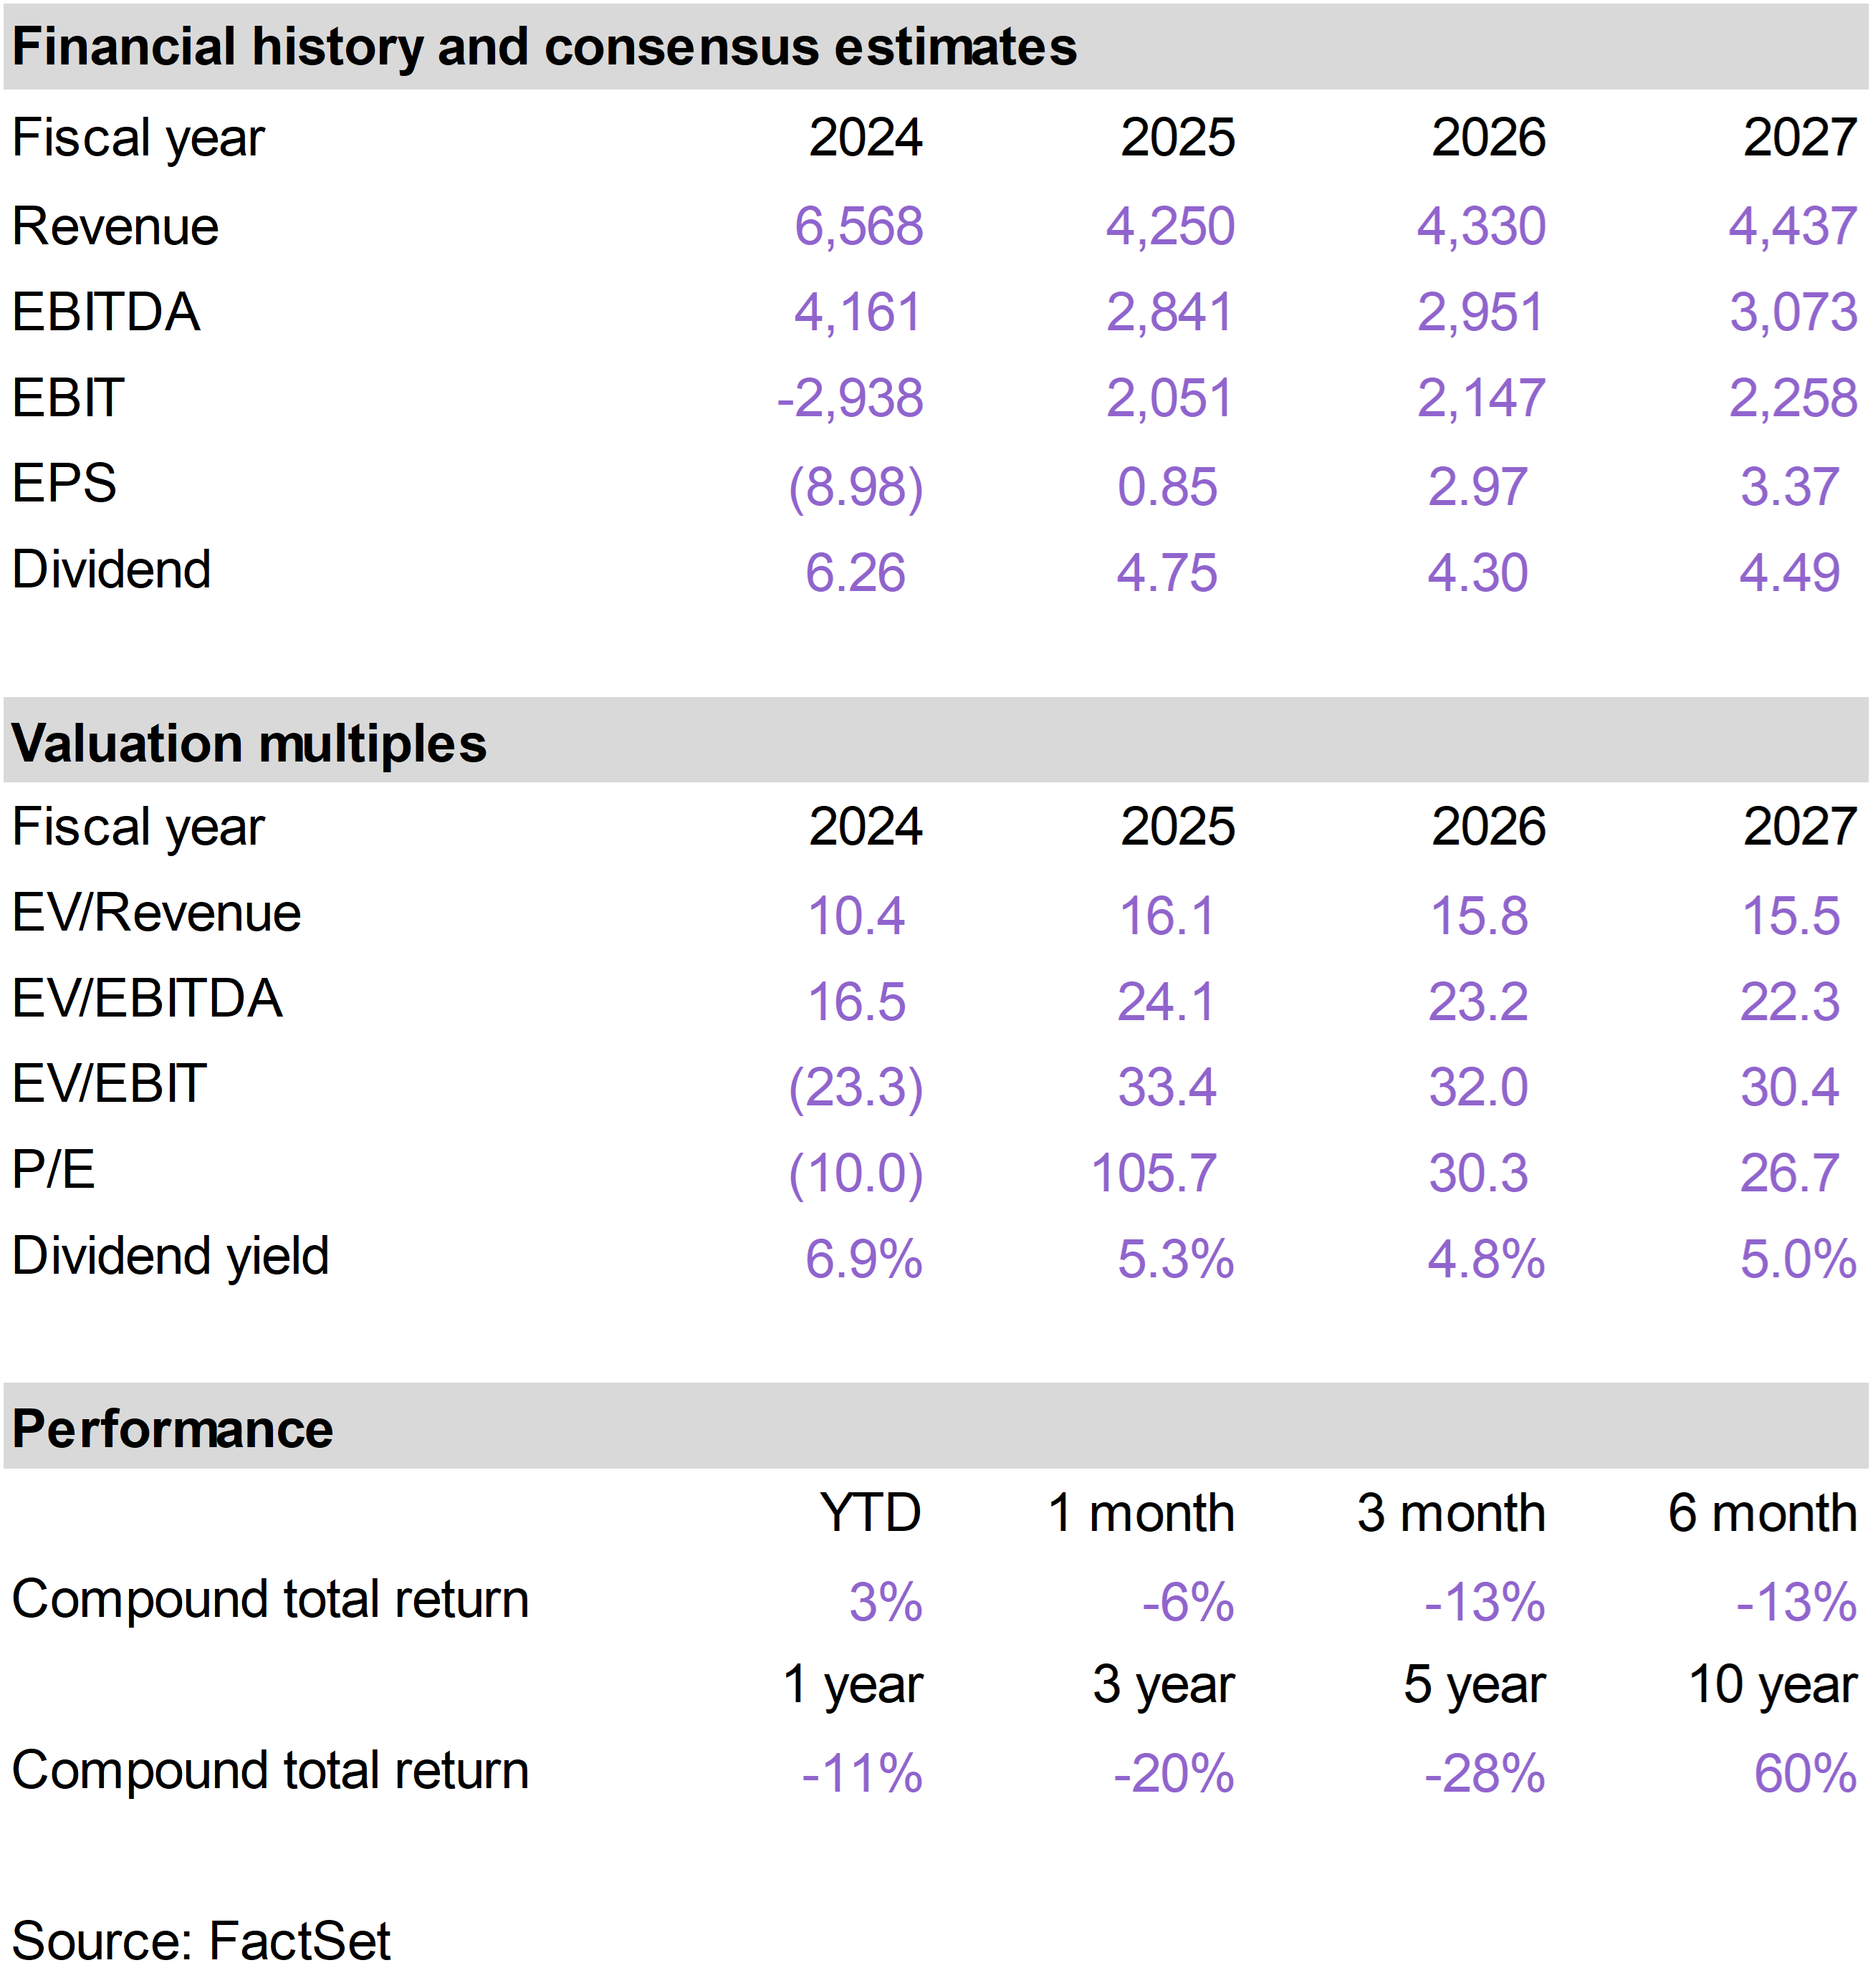
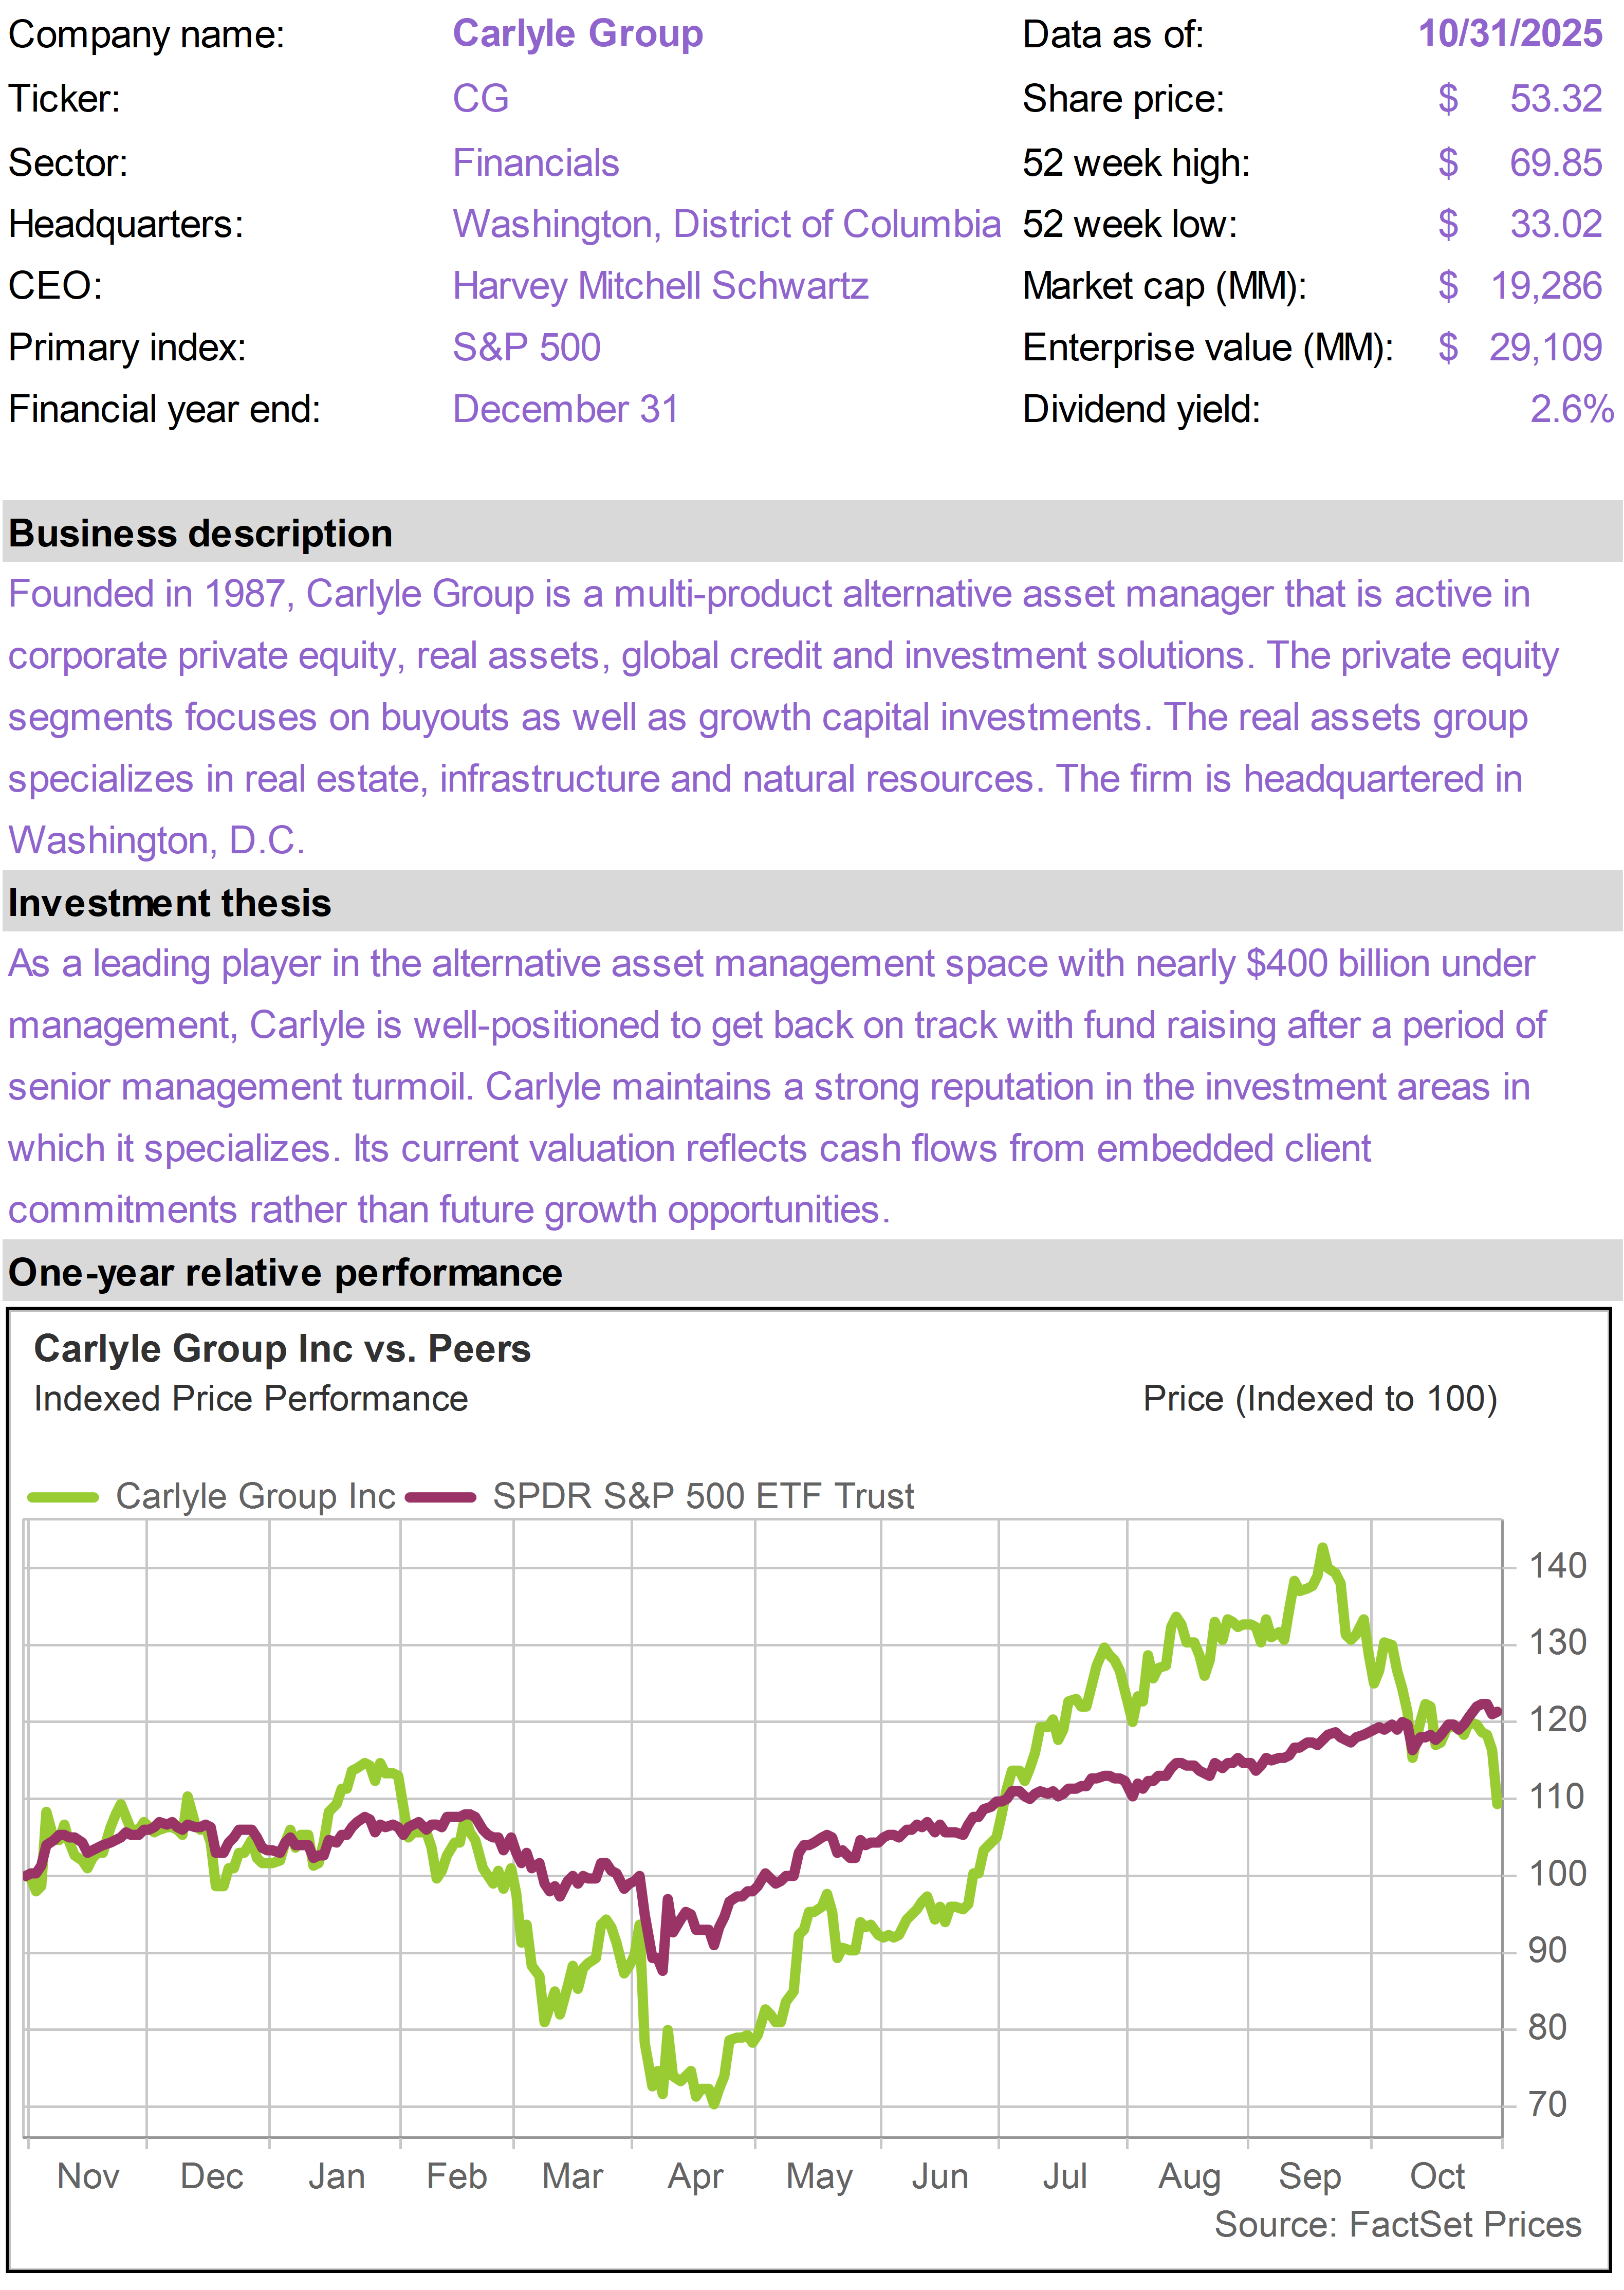
The portfolio’s alternative asset managers—BX and CG—sold off sharply in October after having reached or approached all-time highs in mid-September.


While the firms demonstrated strong asset gathering and earnings growth when they reported third quarter earnings, investors in financial stocks appear to have been rattled by emerging risks in private credit.


Investors have been specifically focused on comments made by JPMorgan Chase CEO Jamie Dimon, who in mid-October reacted to the bankruptcy of subprime auto lender Tricolor Holdings by observing that “when you see one cockroach, there are probably more.”


We view the sell-off in BX and CG as excessive, given the breadth and positive momentum of their businesses and the unique challenges of the subprime auto market.


These are strong franchises benefiting from durable trends in the financial services industry; we see investor skittishness around these names as an opportunity.


Undervalued AI beneficiary


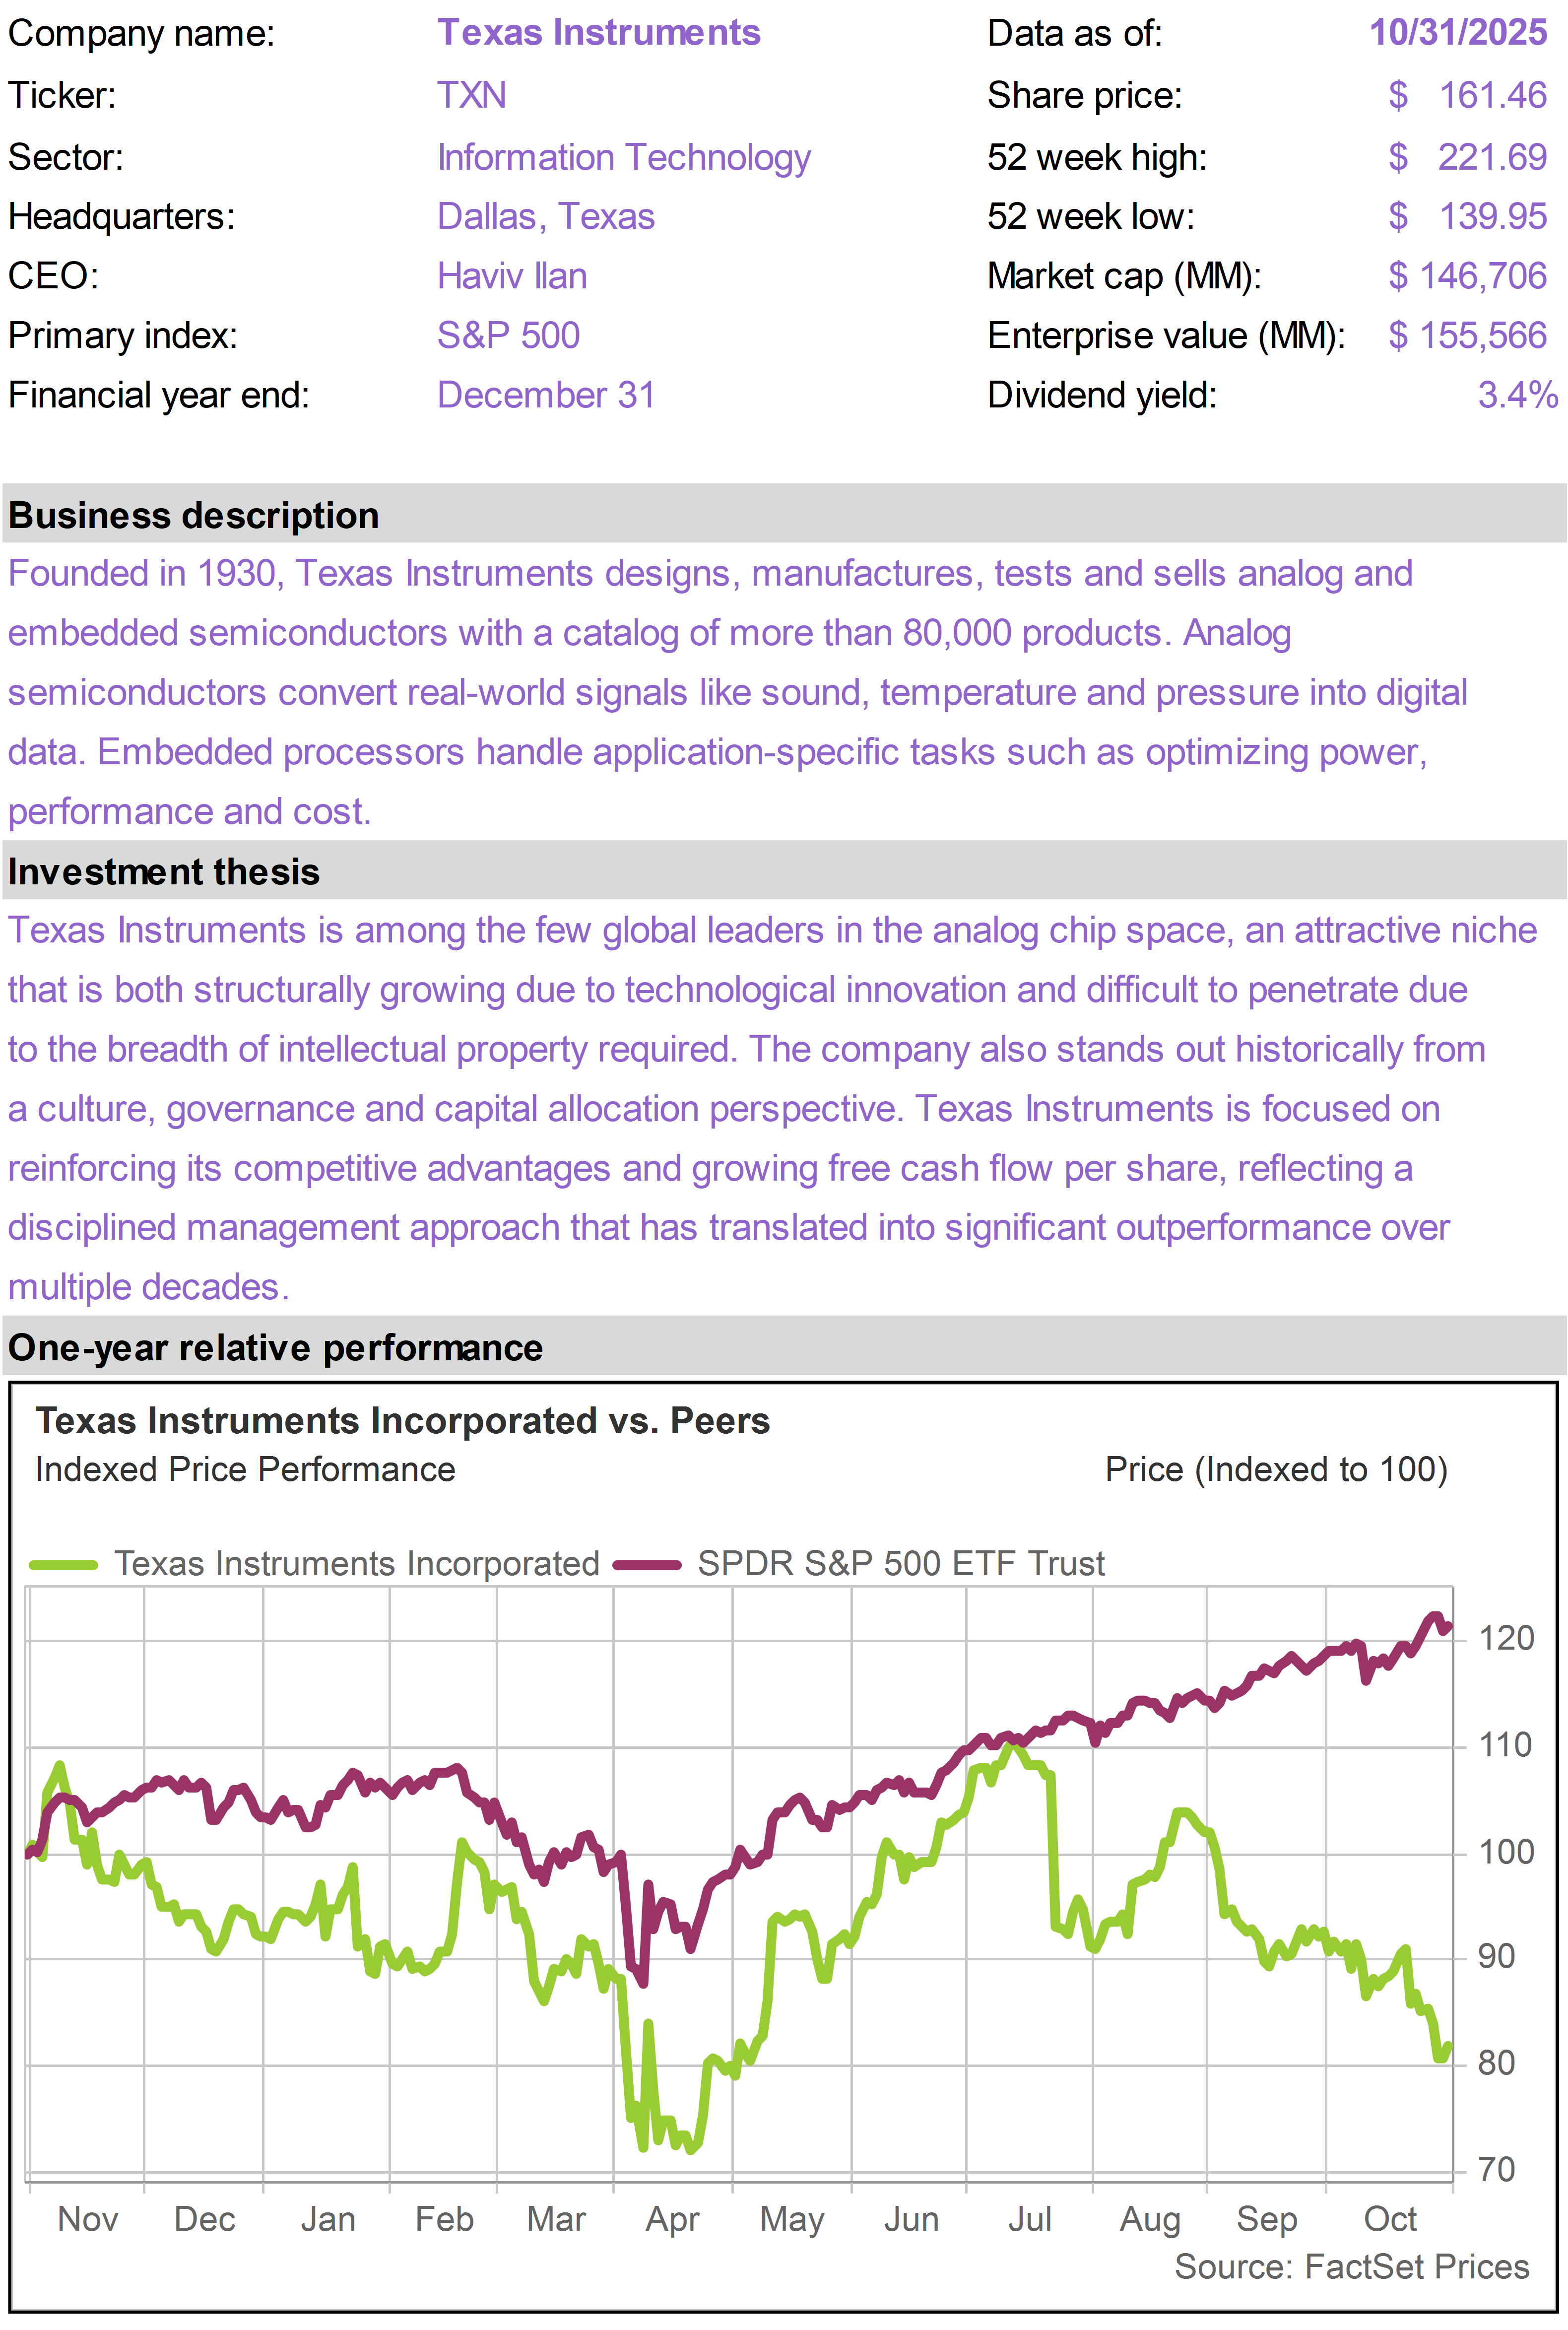
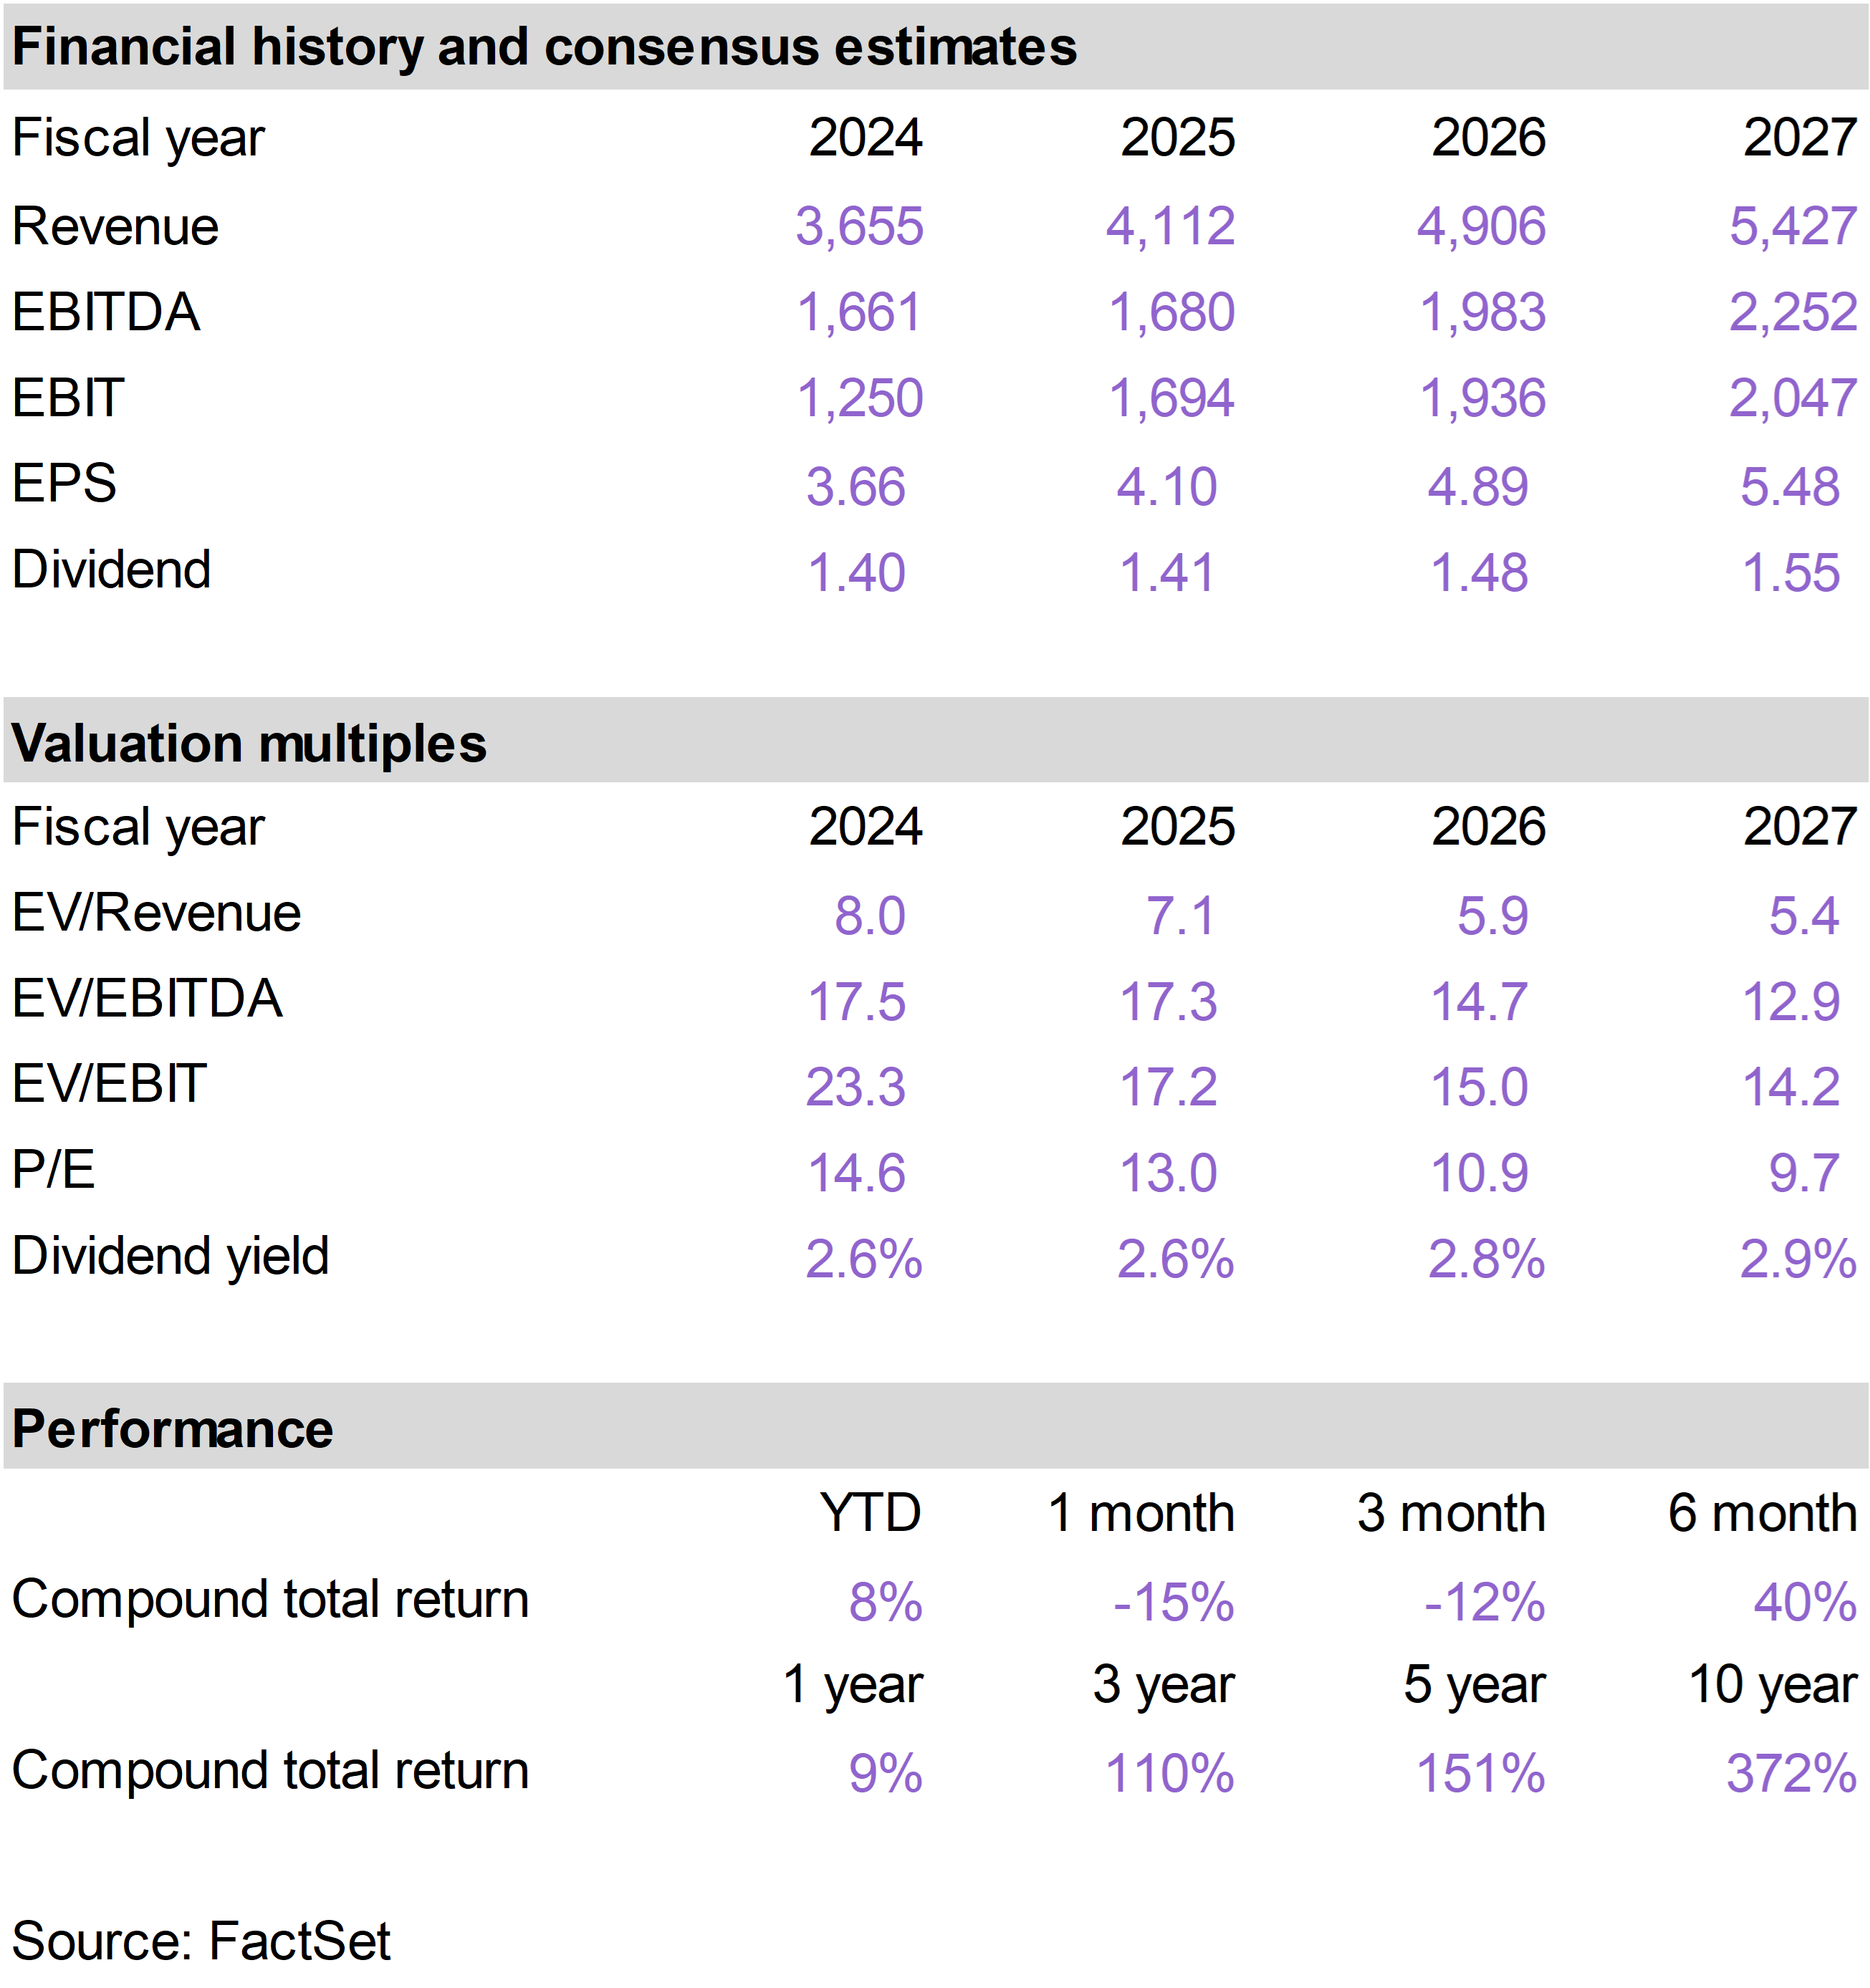
The market’s view of TXN is similarly too pessimistic, in our view—placing too much emphasis on short-term challenges as opposed to compelling long-term opportunities.


TXN shares declined following its third-quarter earnings report. While results largely met expectations, management guided to softer demand in the industrial end market for the upcoming quarter.


In a market where many technology companies are reporting accelerating growth tied to AI adoption, TXN’s slower cyclical recovery has tested investor patience. The near-term backdrop remains mixed, but the long-term strategic position is still highly attractive.


TXN is a market-leading supplier of analog and embedded processing chips that are essential for powering and controlling real-world systems. These are critical to data centers, robotics, factory automation, electric vehicles, and autonomous driving—all of which are long-duration AI-driven growth trends.


TXN has the world’s most advanced and efficient analog chip fabs located within U.S. borders. This positions it to be the low-cost, high-reliability supplier of choice to manufacturers in these growth areas.


As the industrial cycle stabilizes, TXN remains well-placed to expand margins and move closer to its long-term free cash flow targets. For investors seeking long-term exposure to AI without paying premium valuations, TXN offers a compelling setup at current levels.


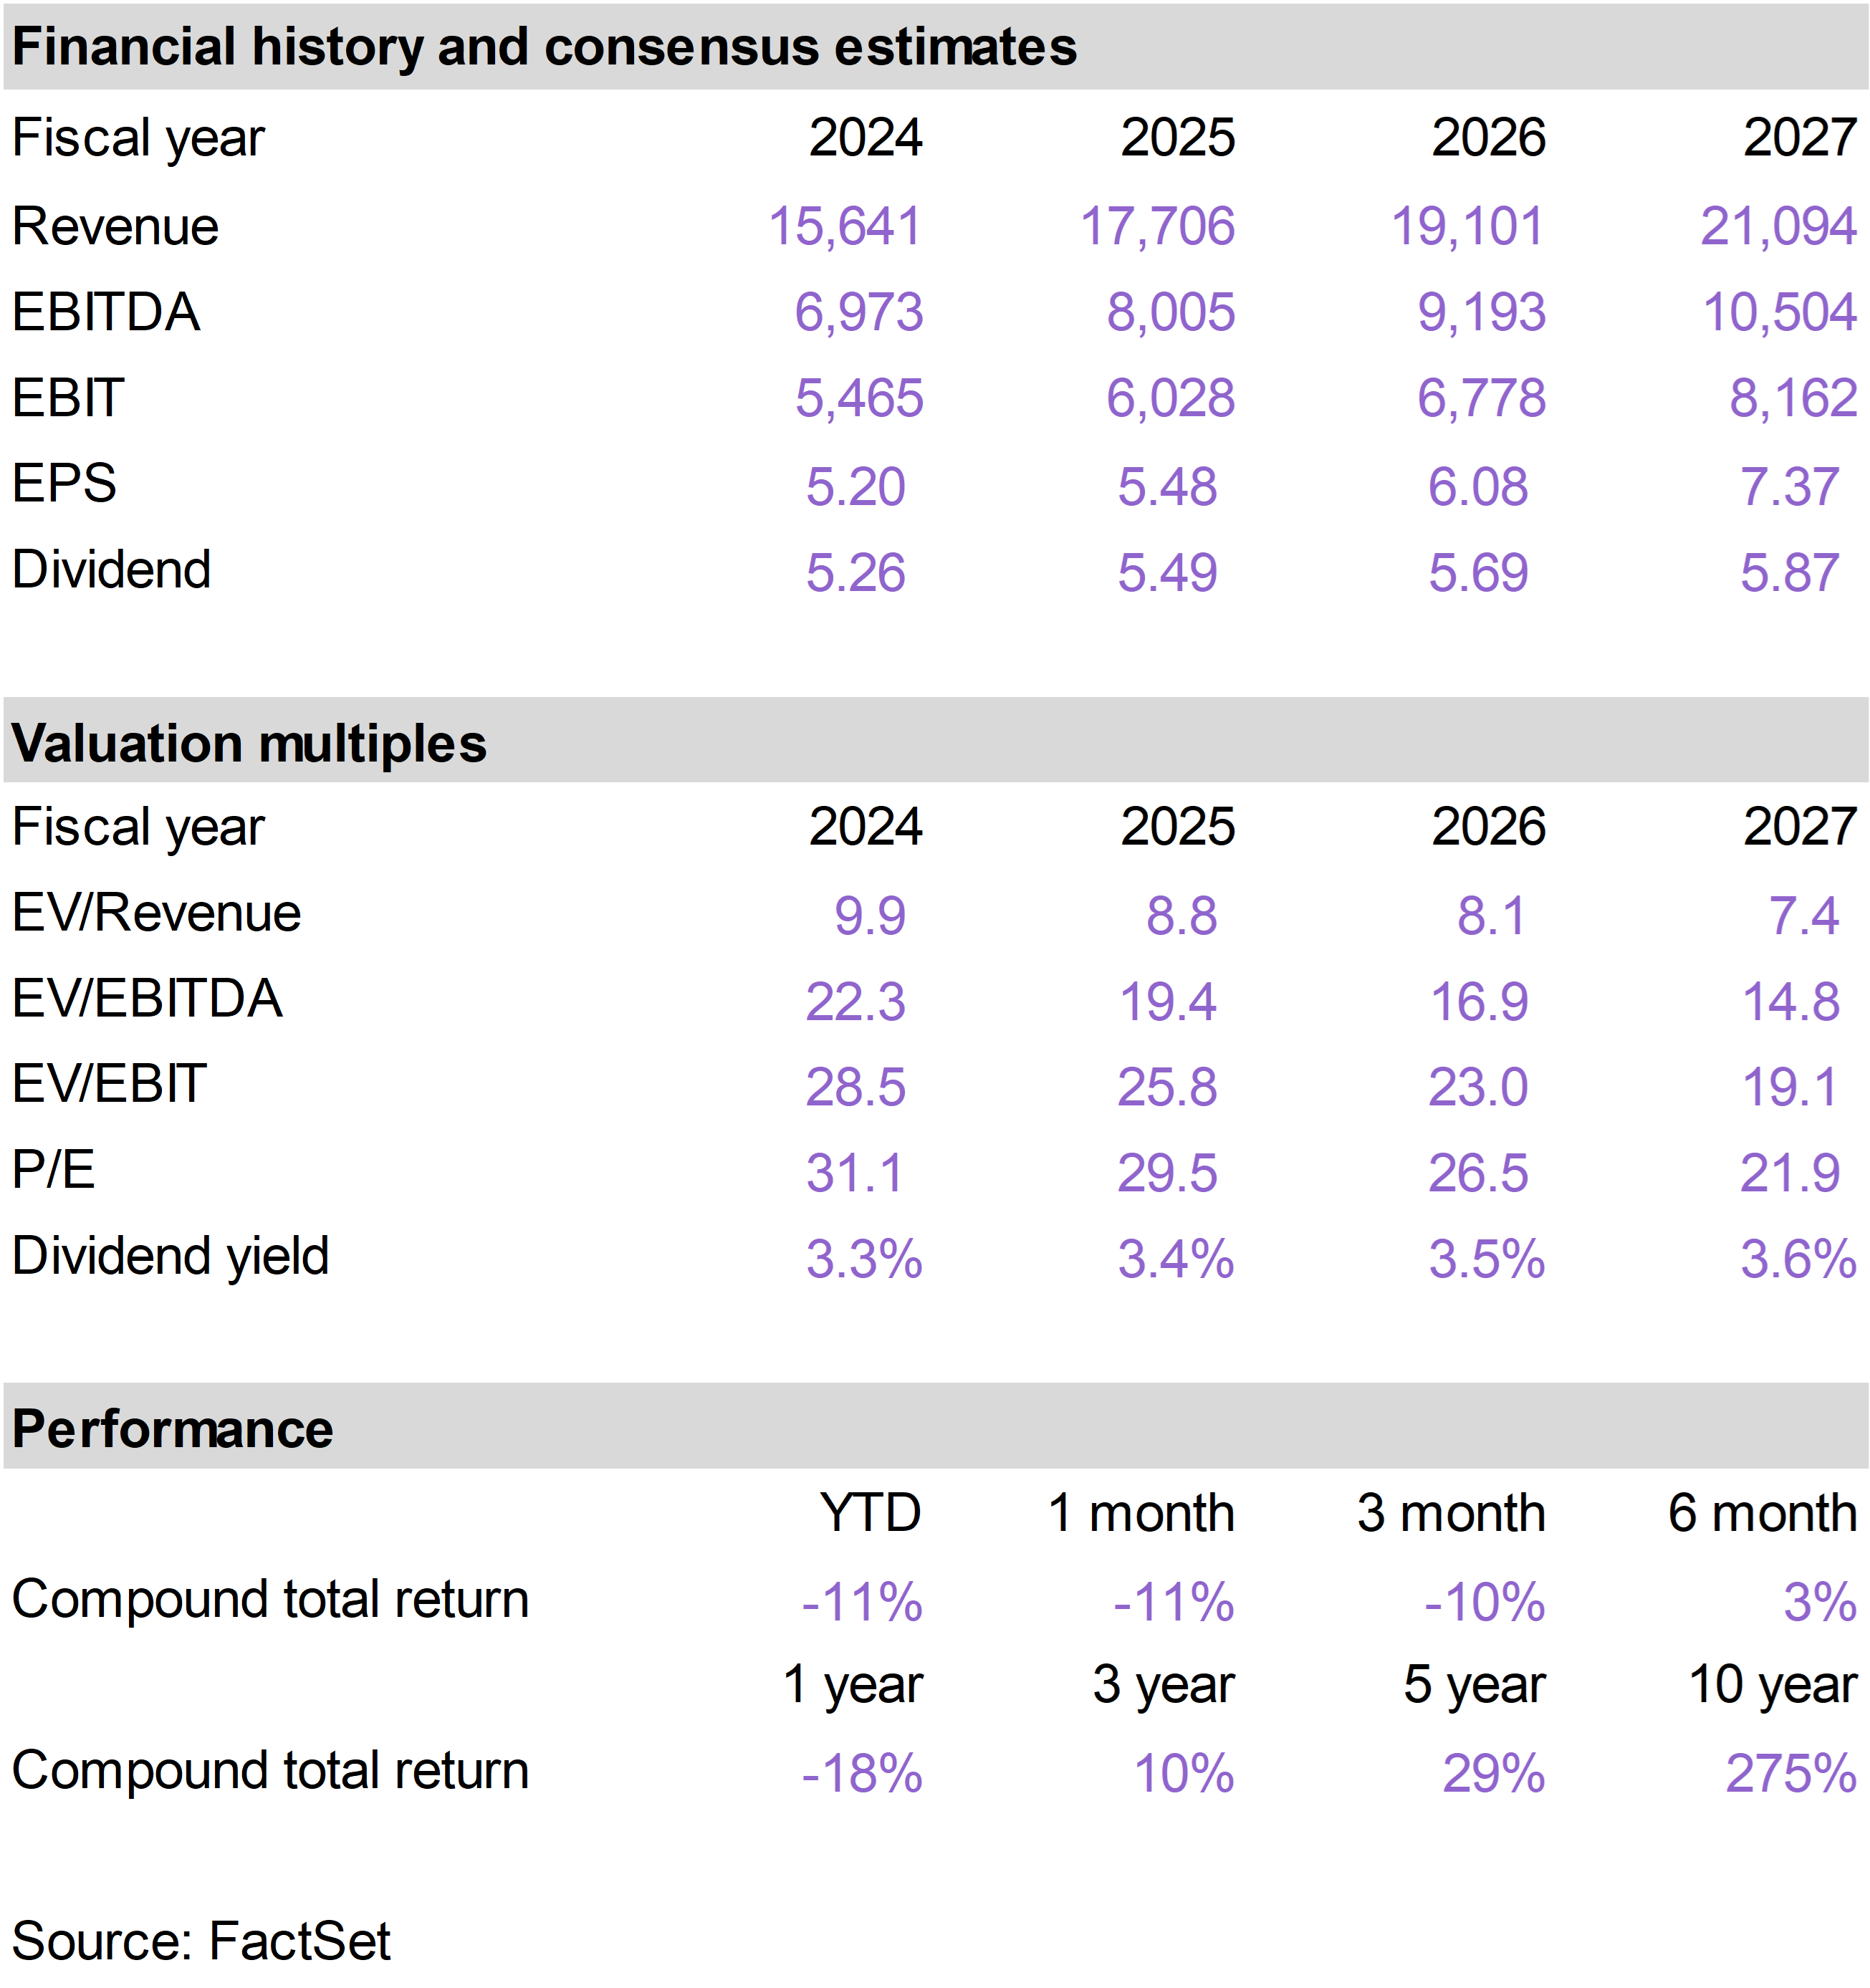
As the company’s major fab expansion cycle winds down, capital expenditures are poised to decline meaningfully. At the same time, revenues are expected to grow steadily as industrial and auto demand stabilize. Together, these dynamics support analyst forecasts that call for free cash flow to nearly triple over the next two years.


Looking further ahead, AI-intensive markets—data centers, robotics, factory automation, EVs, and autonomous systems—will represent an increasingly large share of TXN’s business mix. As this transition unfolds, TXN’s long-term growth profile should improve, with structurally higher margins and more durable long-term demand.


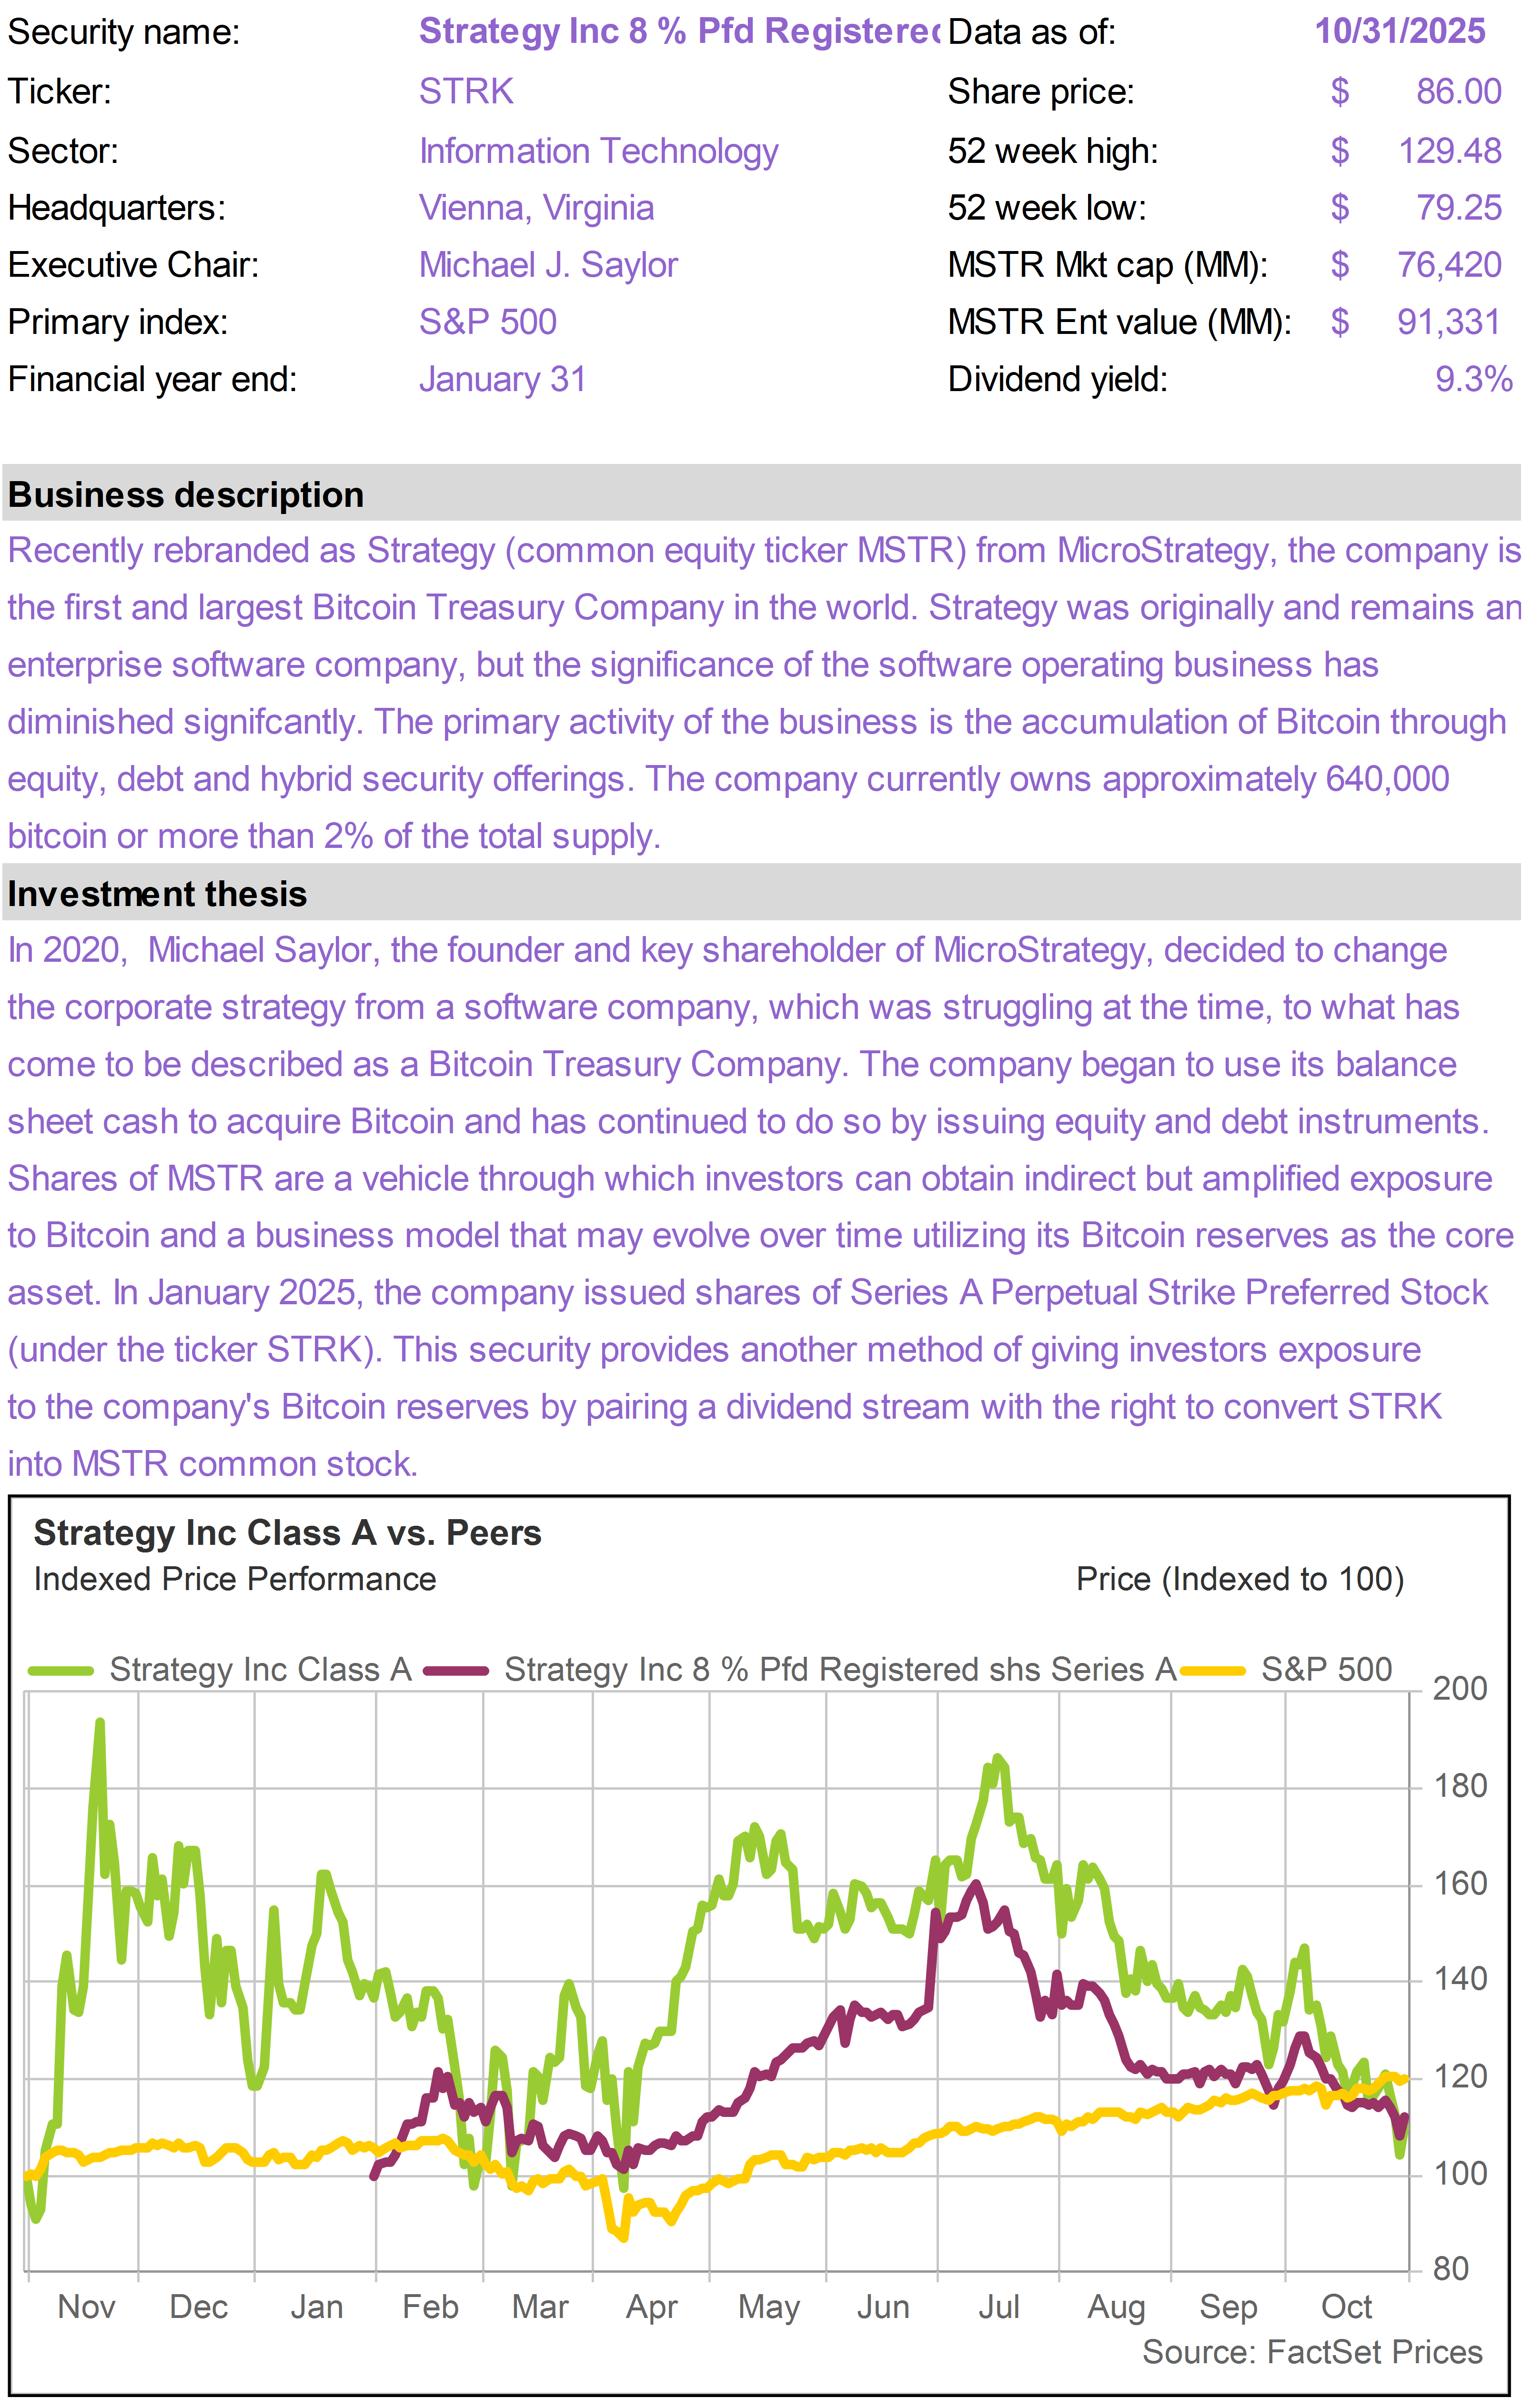
STRK dividend tax treatment


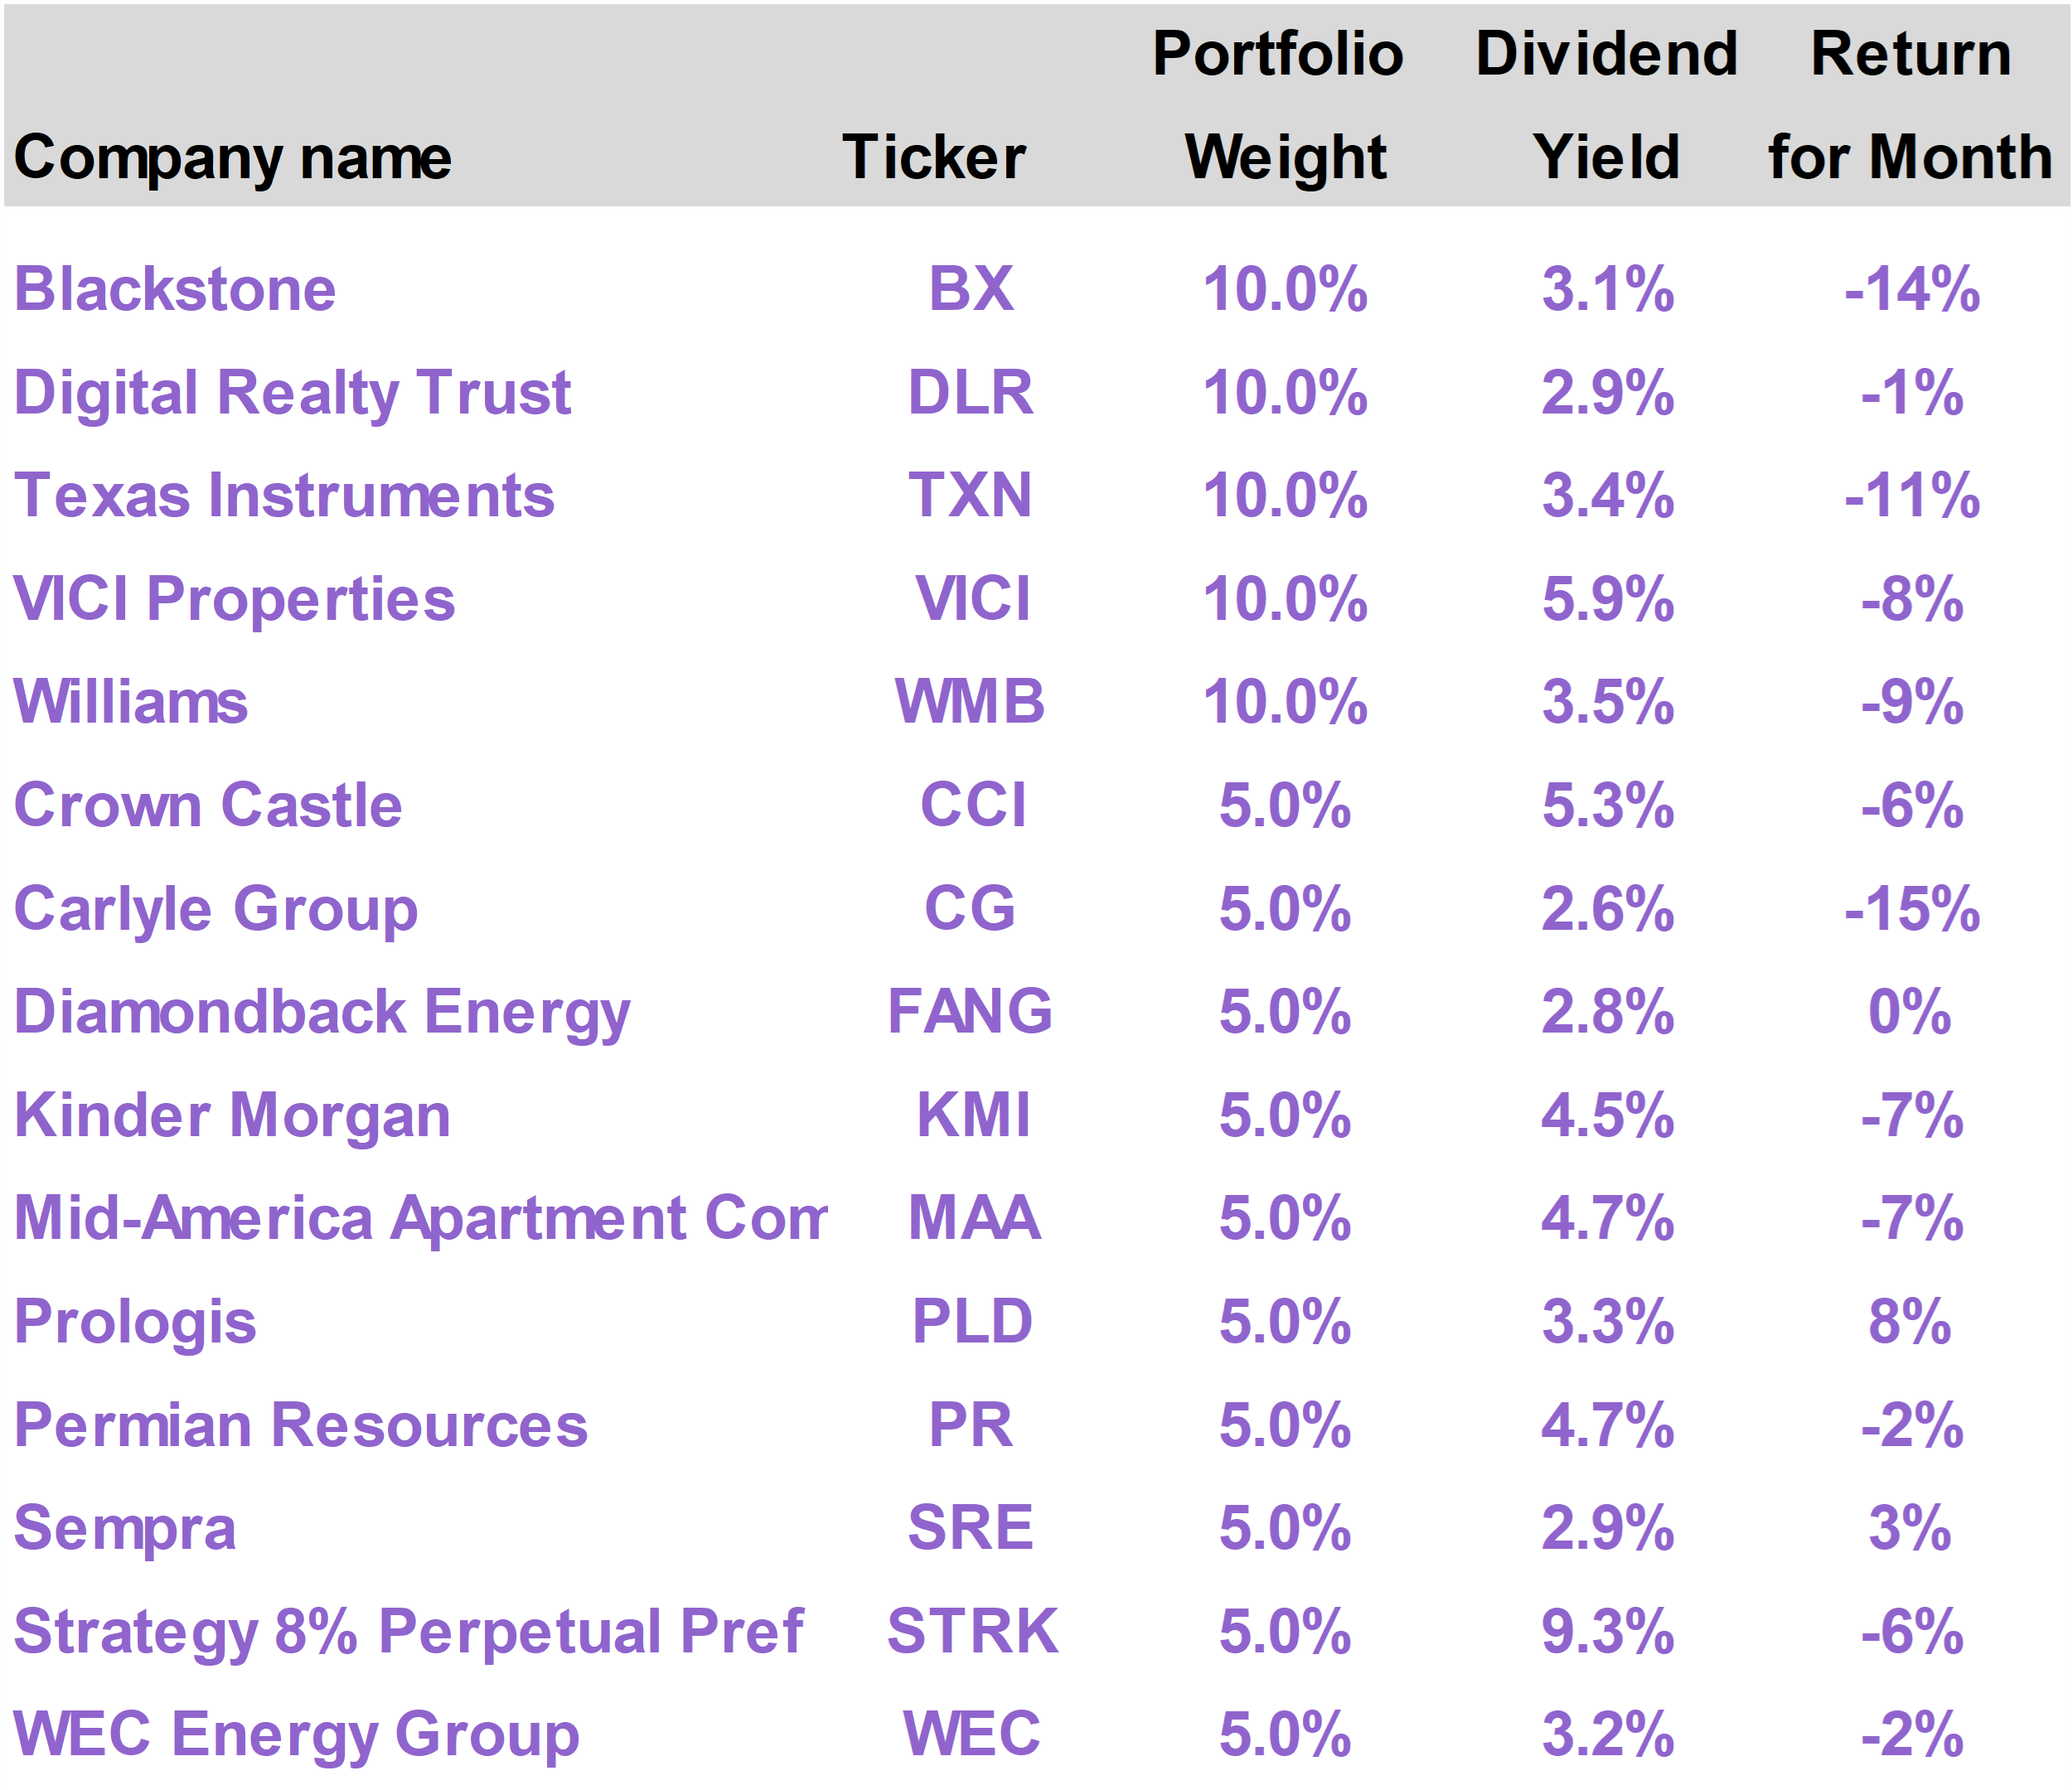
In last month’s report, we added Strategy 8% Perpetual Pref (STRK) to the portfolio to take advantage of weakness in the share price. STRK now offers an effective yield of approximately 9%.


Since adding STRK to the portfolio, we learned of an interesting wrinkle to how the IRS will classify the $2 per quarter dividend distributions that STRK pays out. Because these will largely be funded by the sale of MSTR stock, the dividends, according to statements made by the parent company Strategy, will be regarded as “return of capital.”


This tax treatment is expected to persist for as long as ten years.


In taxable accounts, this means investors will not have to pay taxes on the dividends they receive. What happens is the cost basis in their investment in the security is effectively reduced, so if a shareholder were to sell the security later on for a gain, the taxable capital gain would be higher.


For income-seeking investors, this determination of the tax treatment of Strategy’s preferred stock dividends is very attractive.


In addition to the ~9% dividend yield, STRK investors get the benefit of the permanent convertibility of STRK into MSTR common stock. In a scenario where Bitcoin appreciates substantially, the value of the conversion option could increase substantially as well.


While many of the holdings of the Income Builder have not participated in the areas of the market that have had momentum recently, we view current valuation levels across the portfolio as highly attractive. The best investment opportunities are often available when sentiment is weakest.


In the meantime, the portfolio holdings continue to generate steady income, offering a weighted average 4% dividend yield.

Key metrics

Valuation detail

Performance detail

Company snapshots

Blackstone (BX)

Digital Realty Trust (DLR)

Texas Instruments (TXN)

VICI Properties (VICI)

Williams (WMB)

Crown Castle (CCI)

Carlyle Group (CG)

Diamondback Energy (FANG)

Kinder Morgan (KMI)

Mid-America Apartment (MAA)

Prologis (PLD)

Permian Resources (PR)

Sempra (SRE)

Strategy 8% Perpetual Pref (STRK)

WEC Energy Group (WEC)

The 76research Income Builder Model Portfolio is intended for income-oriented investors and managed to generate an overall yield that is materially higher than broad equity indices. The portfolio includes stocks with above average dividend yields from a cross section of industries. While investments are screened for their income and income growth characteristics, specific holdings are chosen based on valuation and general business quality, growth and risk considerations.

FOR SUBSCRIBER USE ONLY. DO NOT FORWARD OR SHARE.