|
| Inflation Protection Model Portfolio |
|
| Monthly Portfolio Review: October 2025Publication date: November 3, 2025 |
|
| | | Current portfolio holdings |
|
|
| | FOR SUBSCRIBER USE ONLY. DO NOT FORWARD OR SHARE. |
|
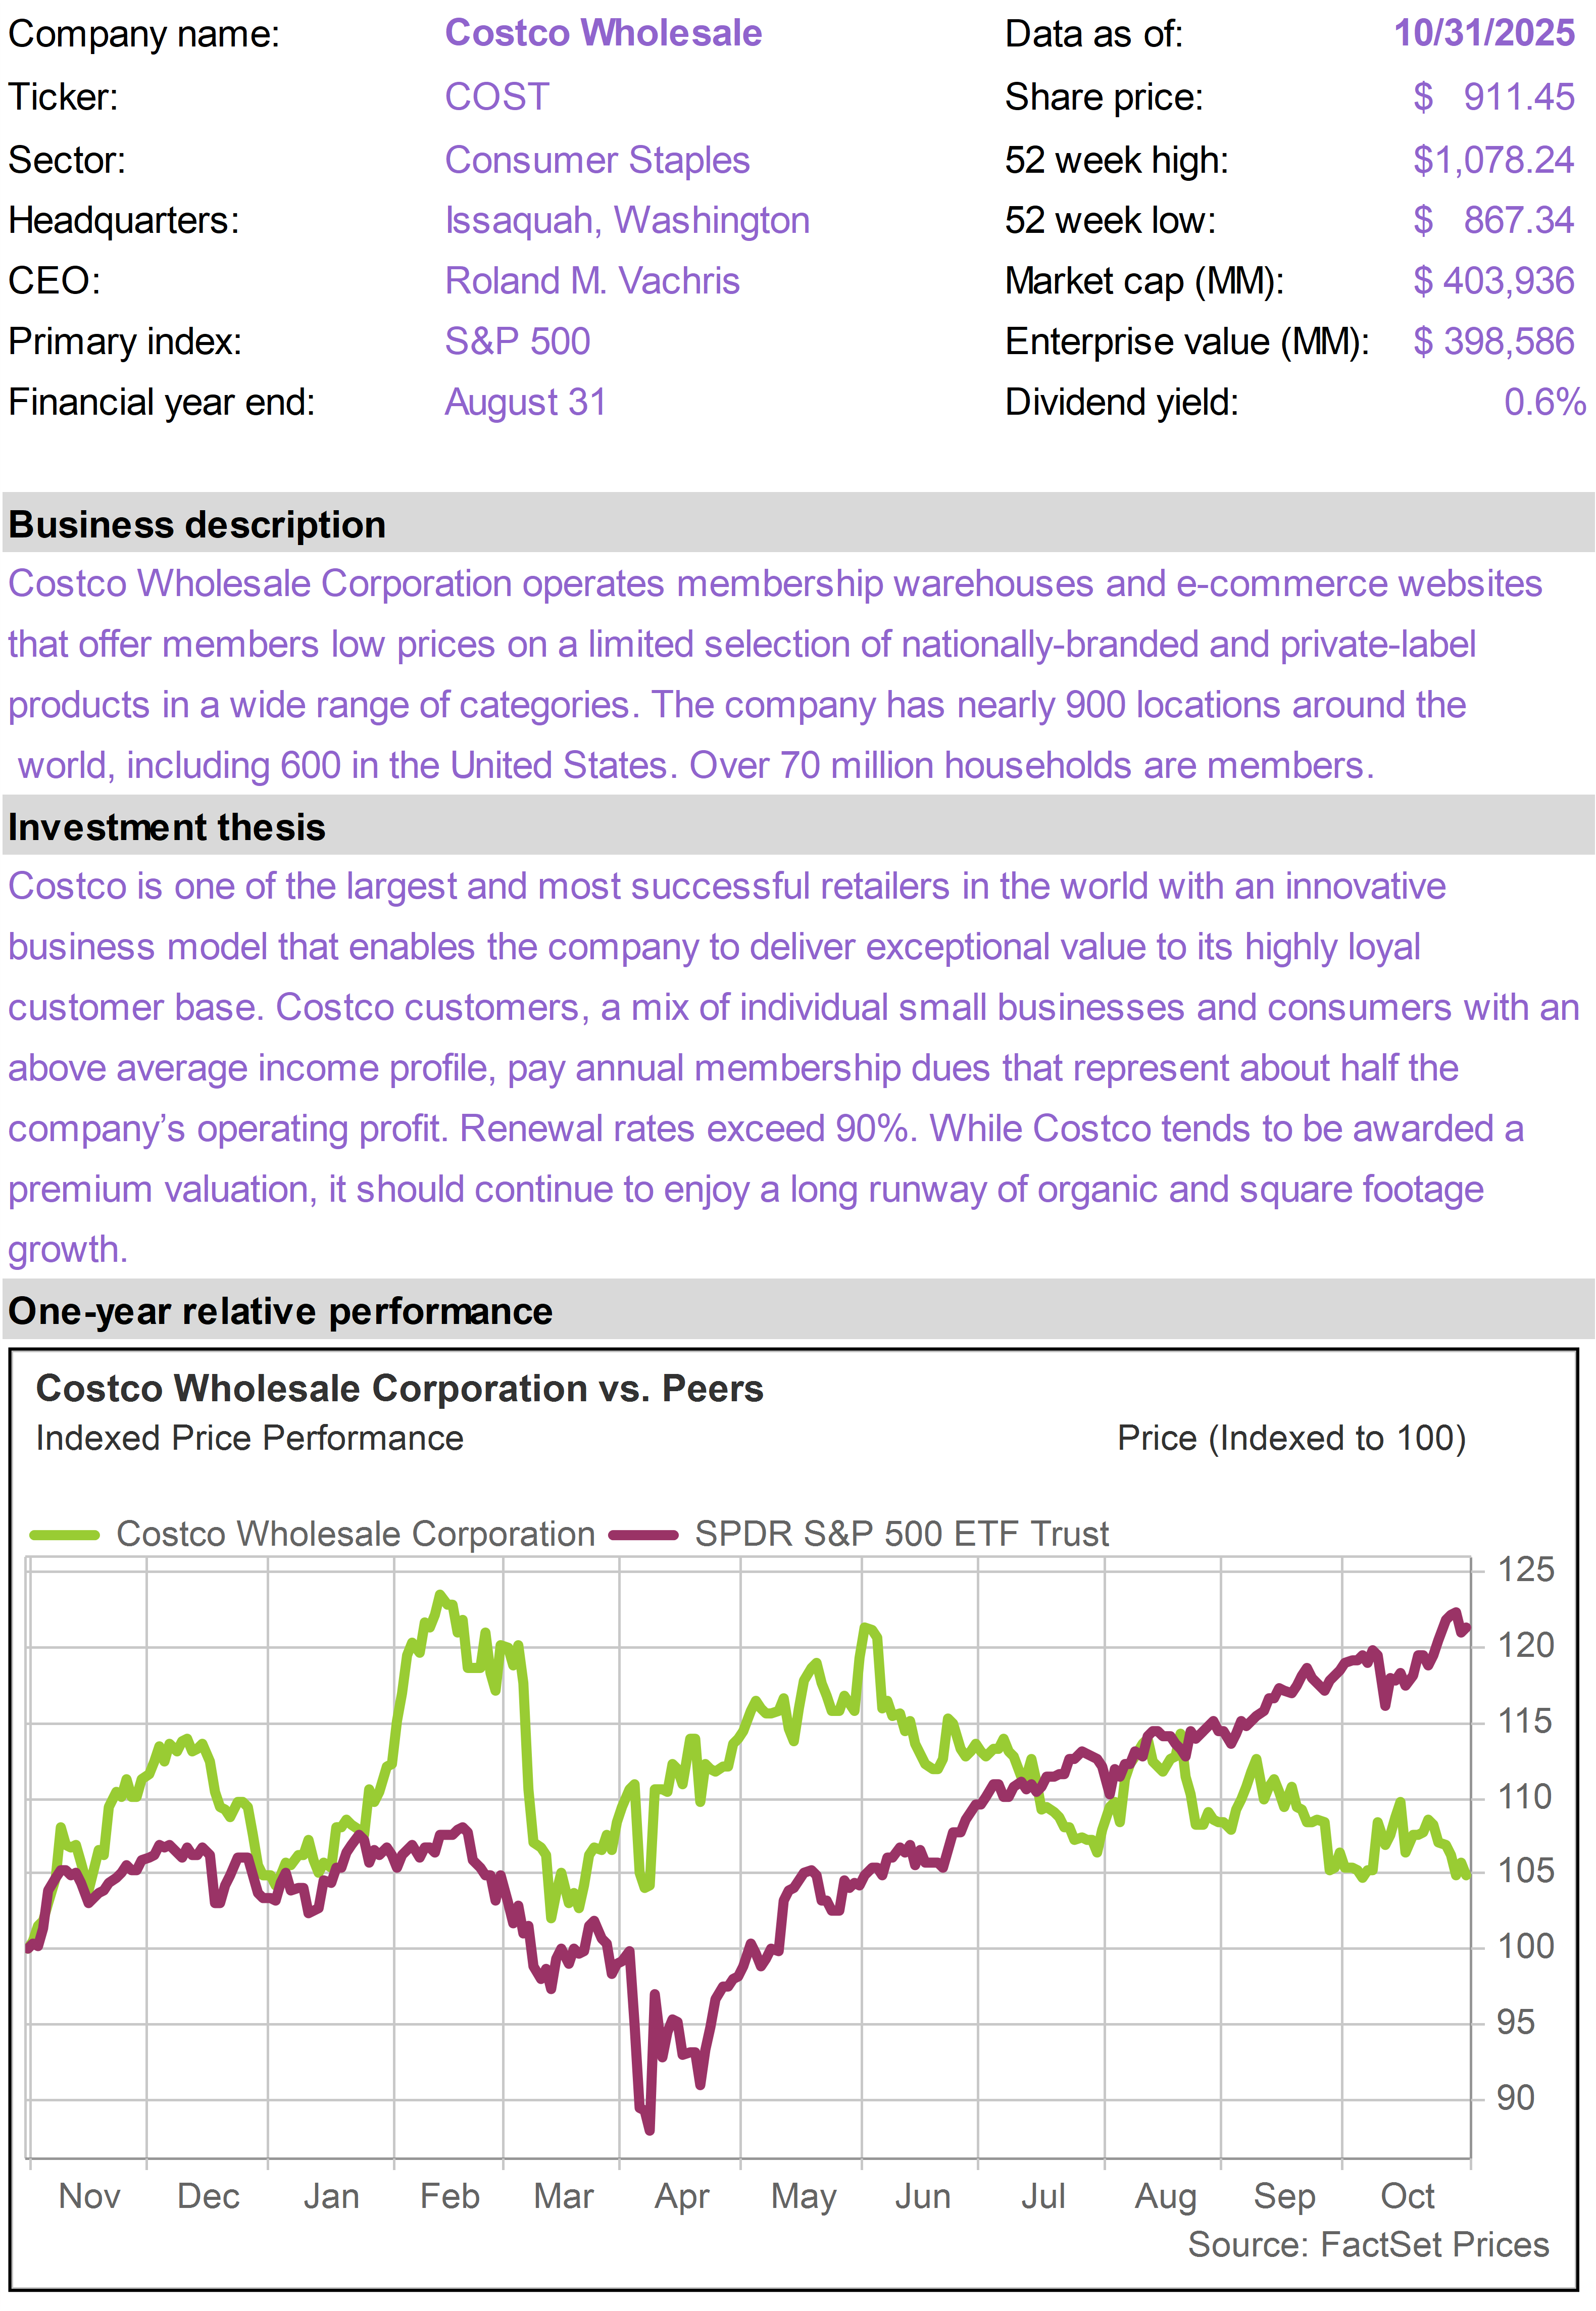
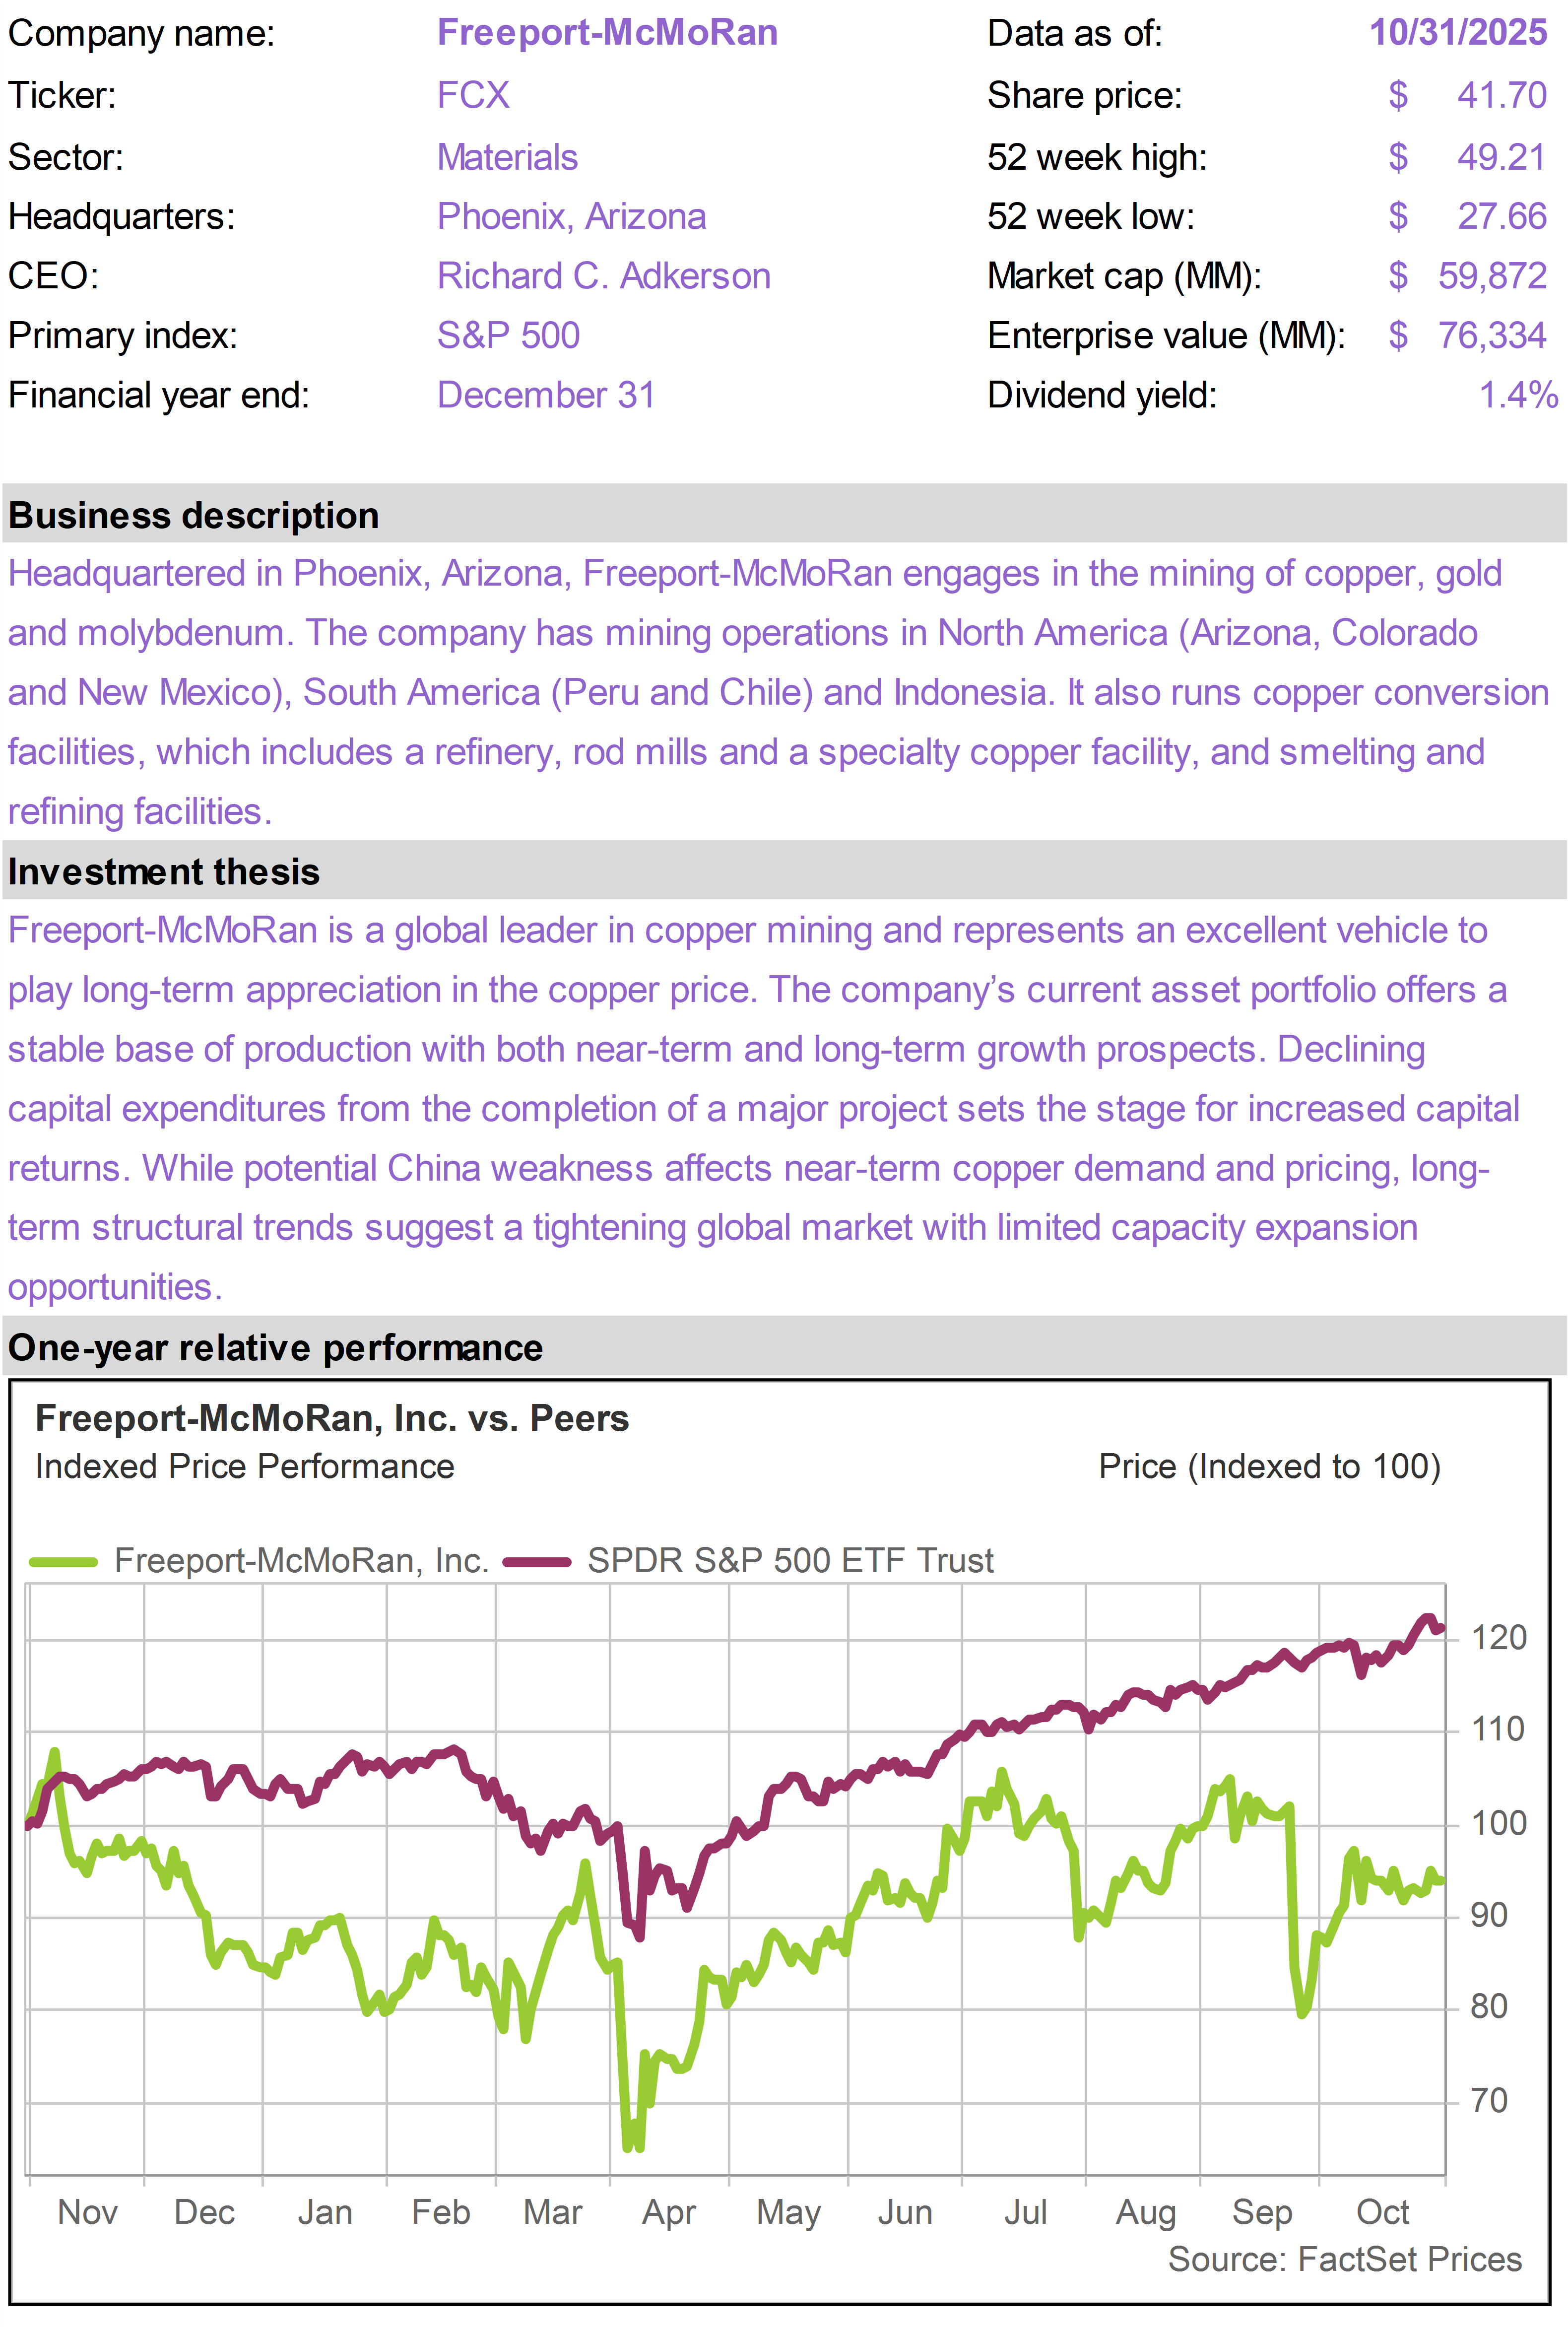
| | | Large cap tech stocks led the S&P 500 higher in October, although the average stock within the index declined and most industry sectors were weak. The Inflation Protection portfolio had moderately negative returns this month, primarily as a result of declines in gold-related stocks. Although gold surged through $4,300 in the middle of the month, its subsequent retreat to $4,000 led to significant volatility in the gold space and pressure on gold-related equities. A bright spot for the portfolio was WESCO International (WCC), which advanced 23%. WCC is a distribution business that is well-aligned with AI demand trends. Shares of Freeport-McMoRan (FCX) also recovered as management comforted investors about the impact of last month’s mining accident in Indonesia. At the late October Fed meeting, Chairman Jerome Powell’s commentary was incrementally negative on the trajectory of future rate cuts, which led to some pressure on gold. While Powell may have appeared slightly more hawkish, with Trump replacing Powell by next spring, we believe inflation sensitive stocks stand to benefit from the forthcoming regime change at the Fed.
|
|
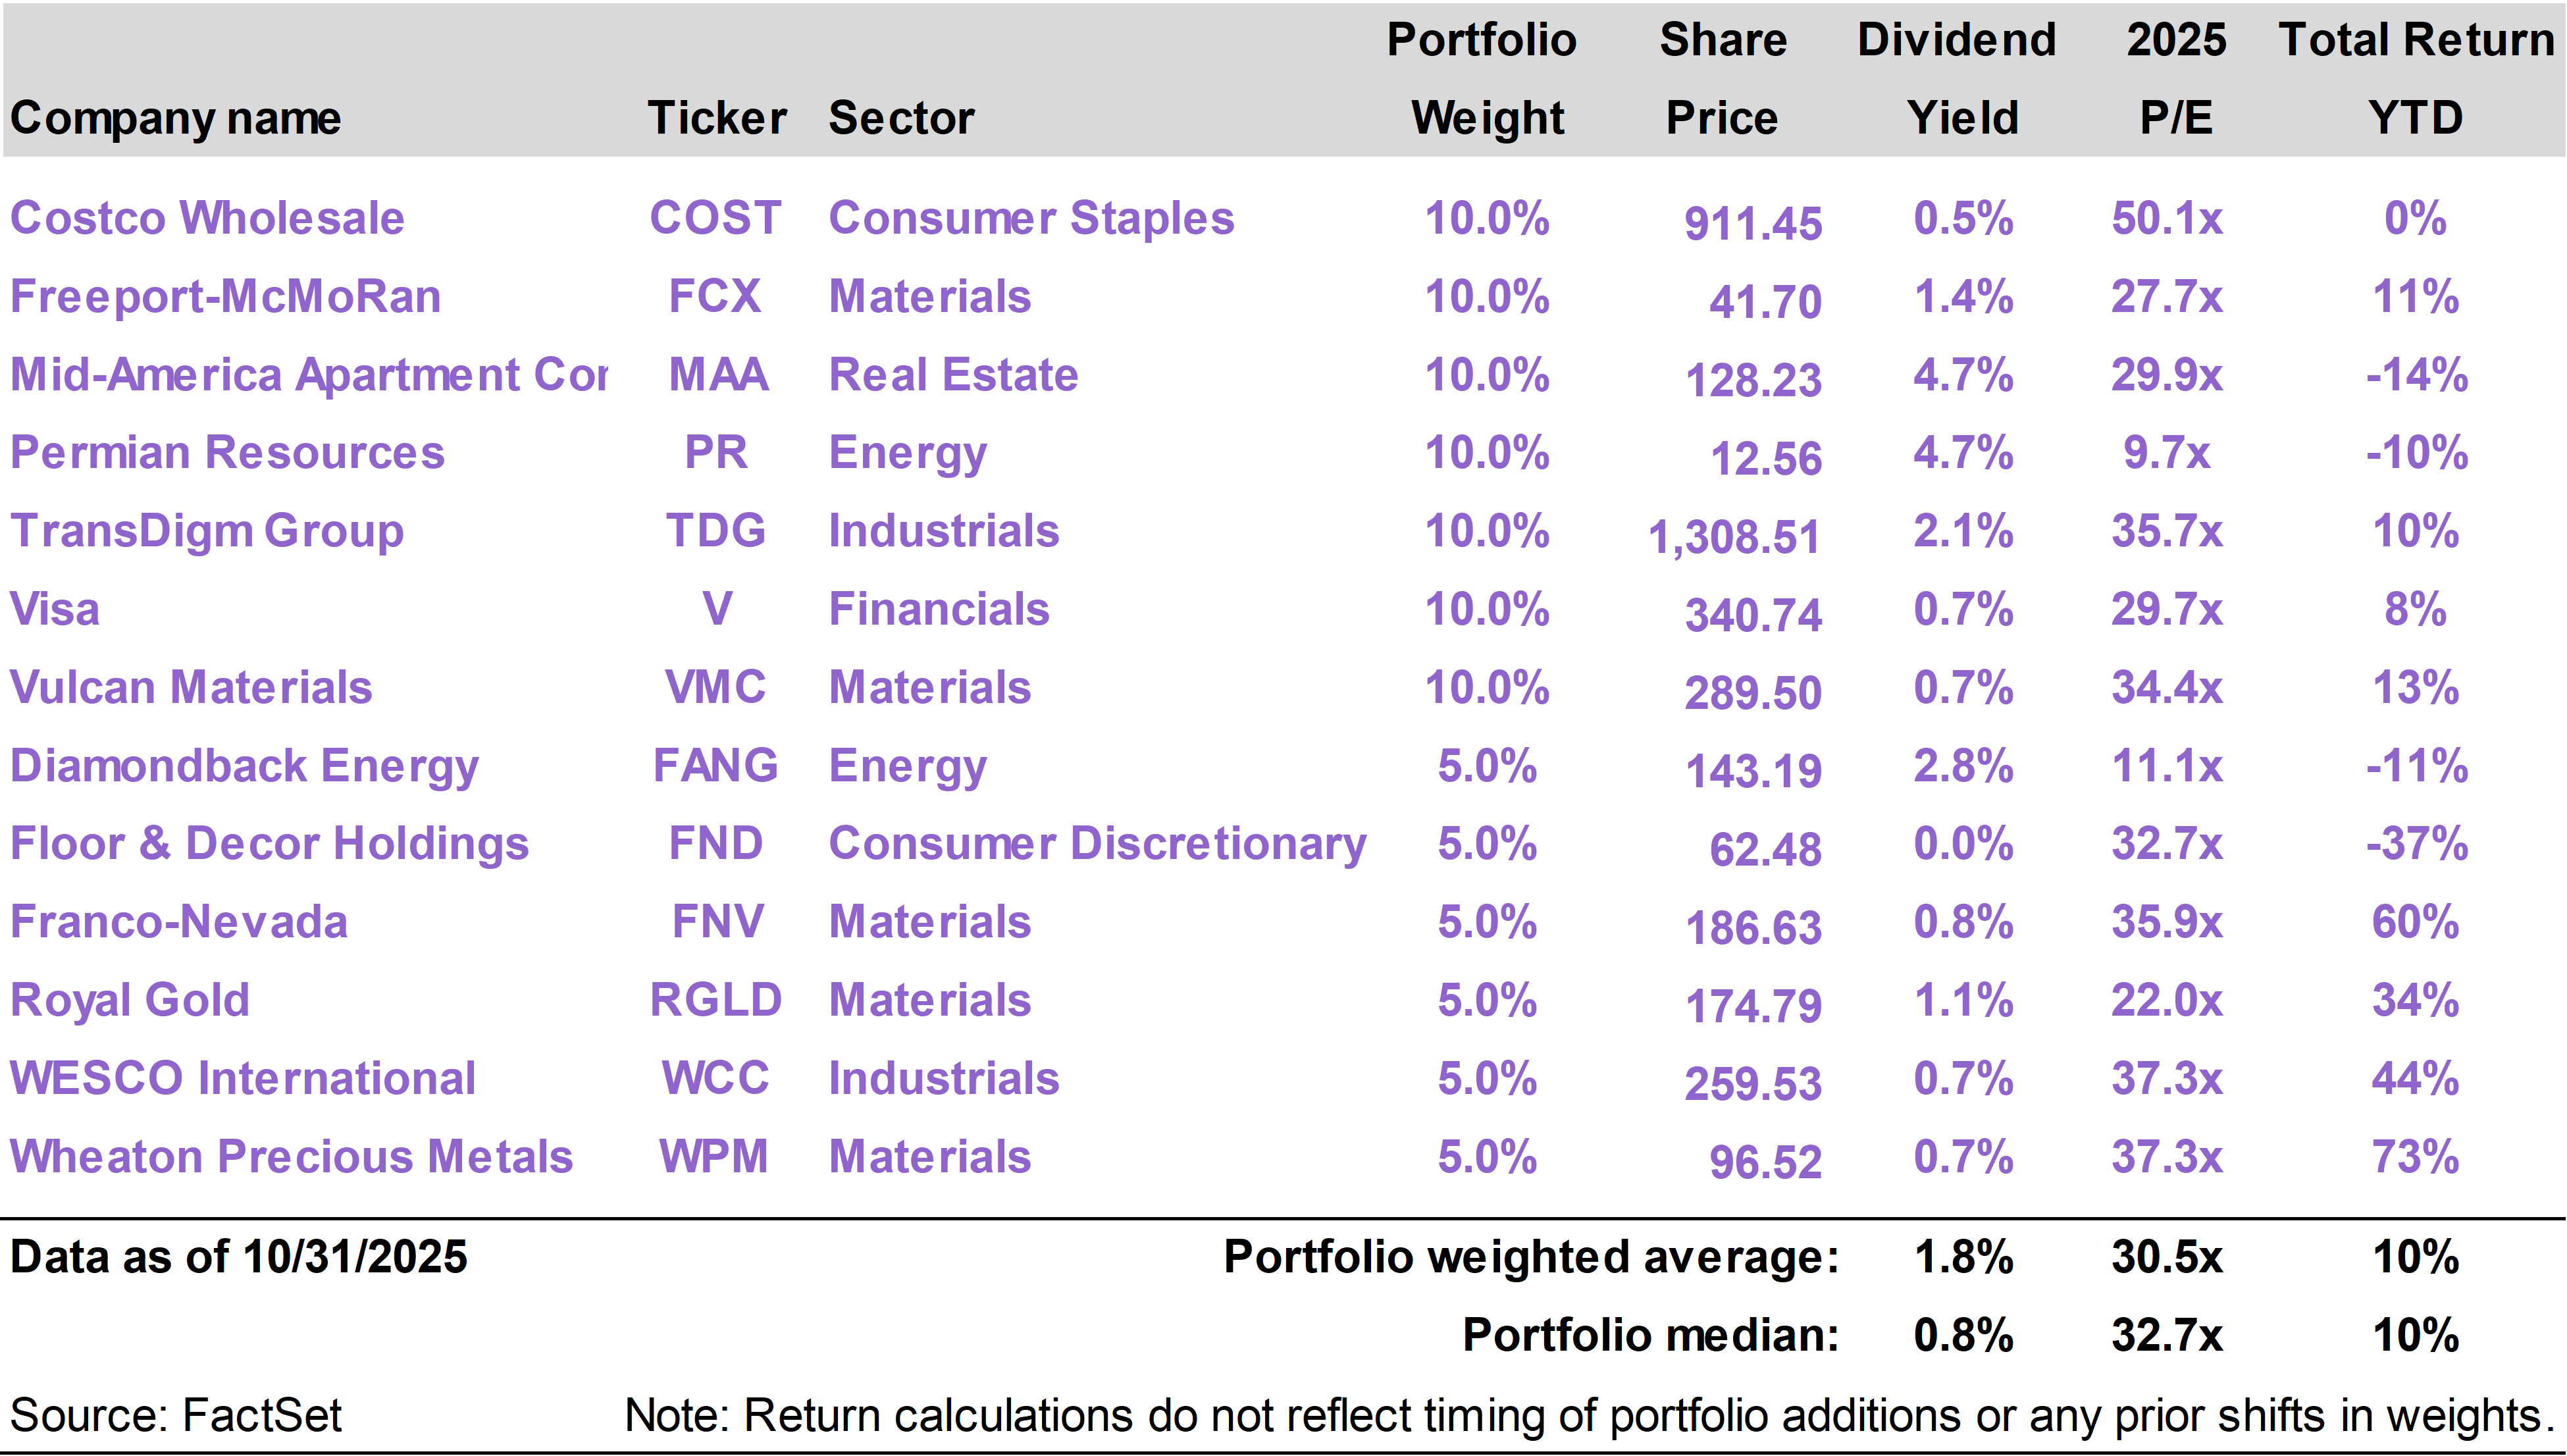
| | | The Inflation Protection portfolio returned -2.8% in October, versus a total return of 2.3% for the S&P 500 Index. On a year to date basis through the end of the month, the portfolio has generated a total return of 7.3%, versus a 17.5% return for the S&P 500.
The portfolio’s top performing stocks this month were WESCO International (WCC), which returned 23%, and Freeport-McMoRan (FCX), which returned 7%.
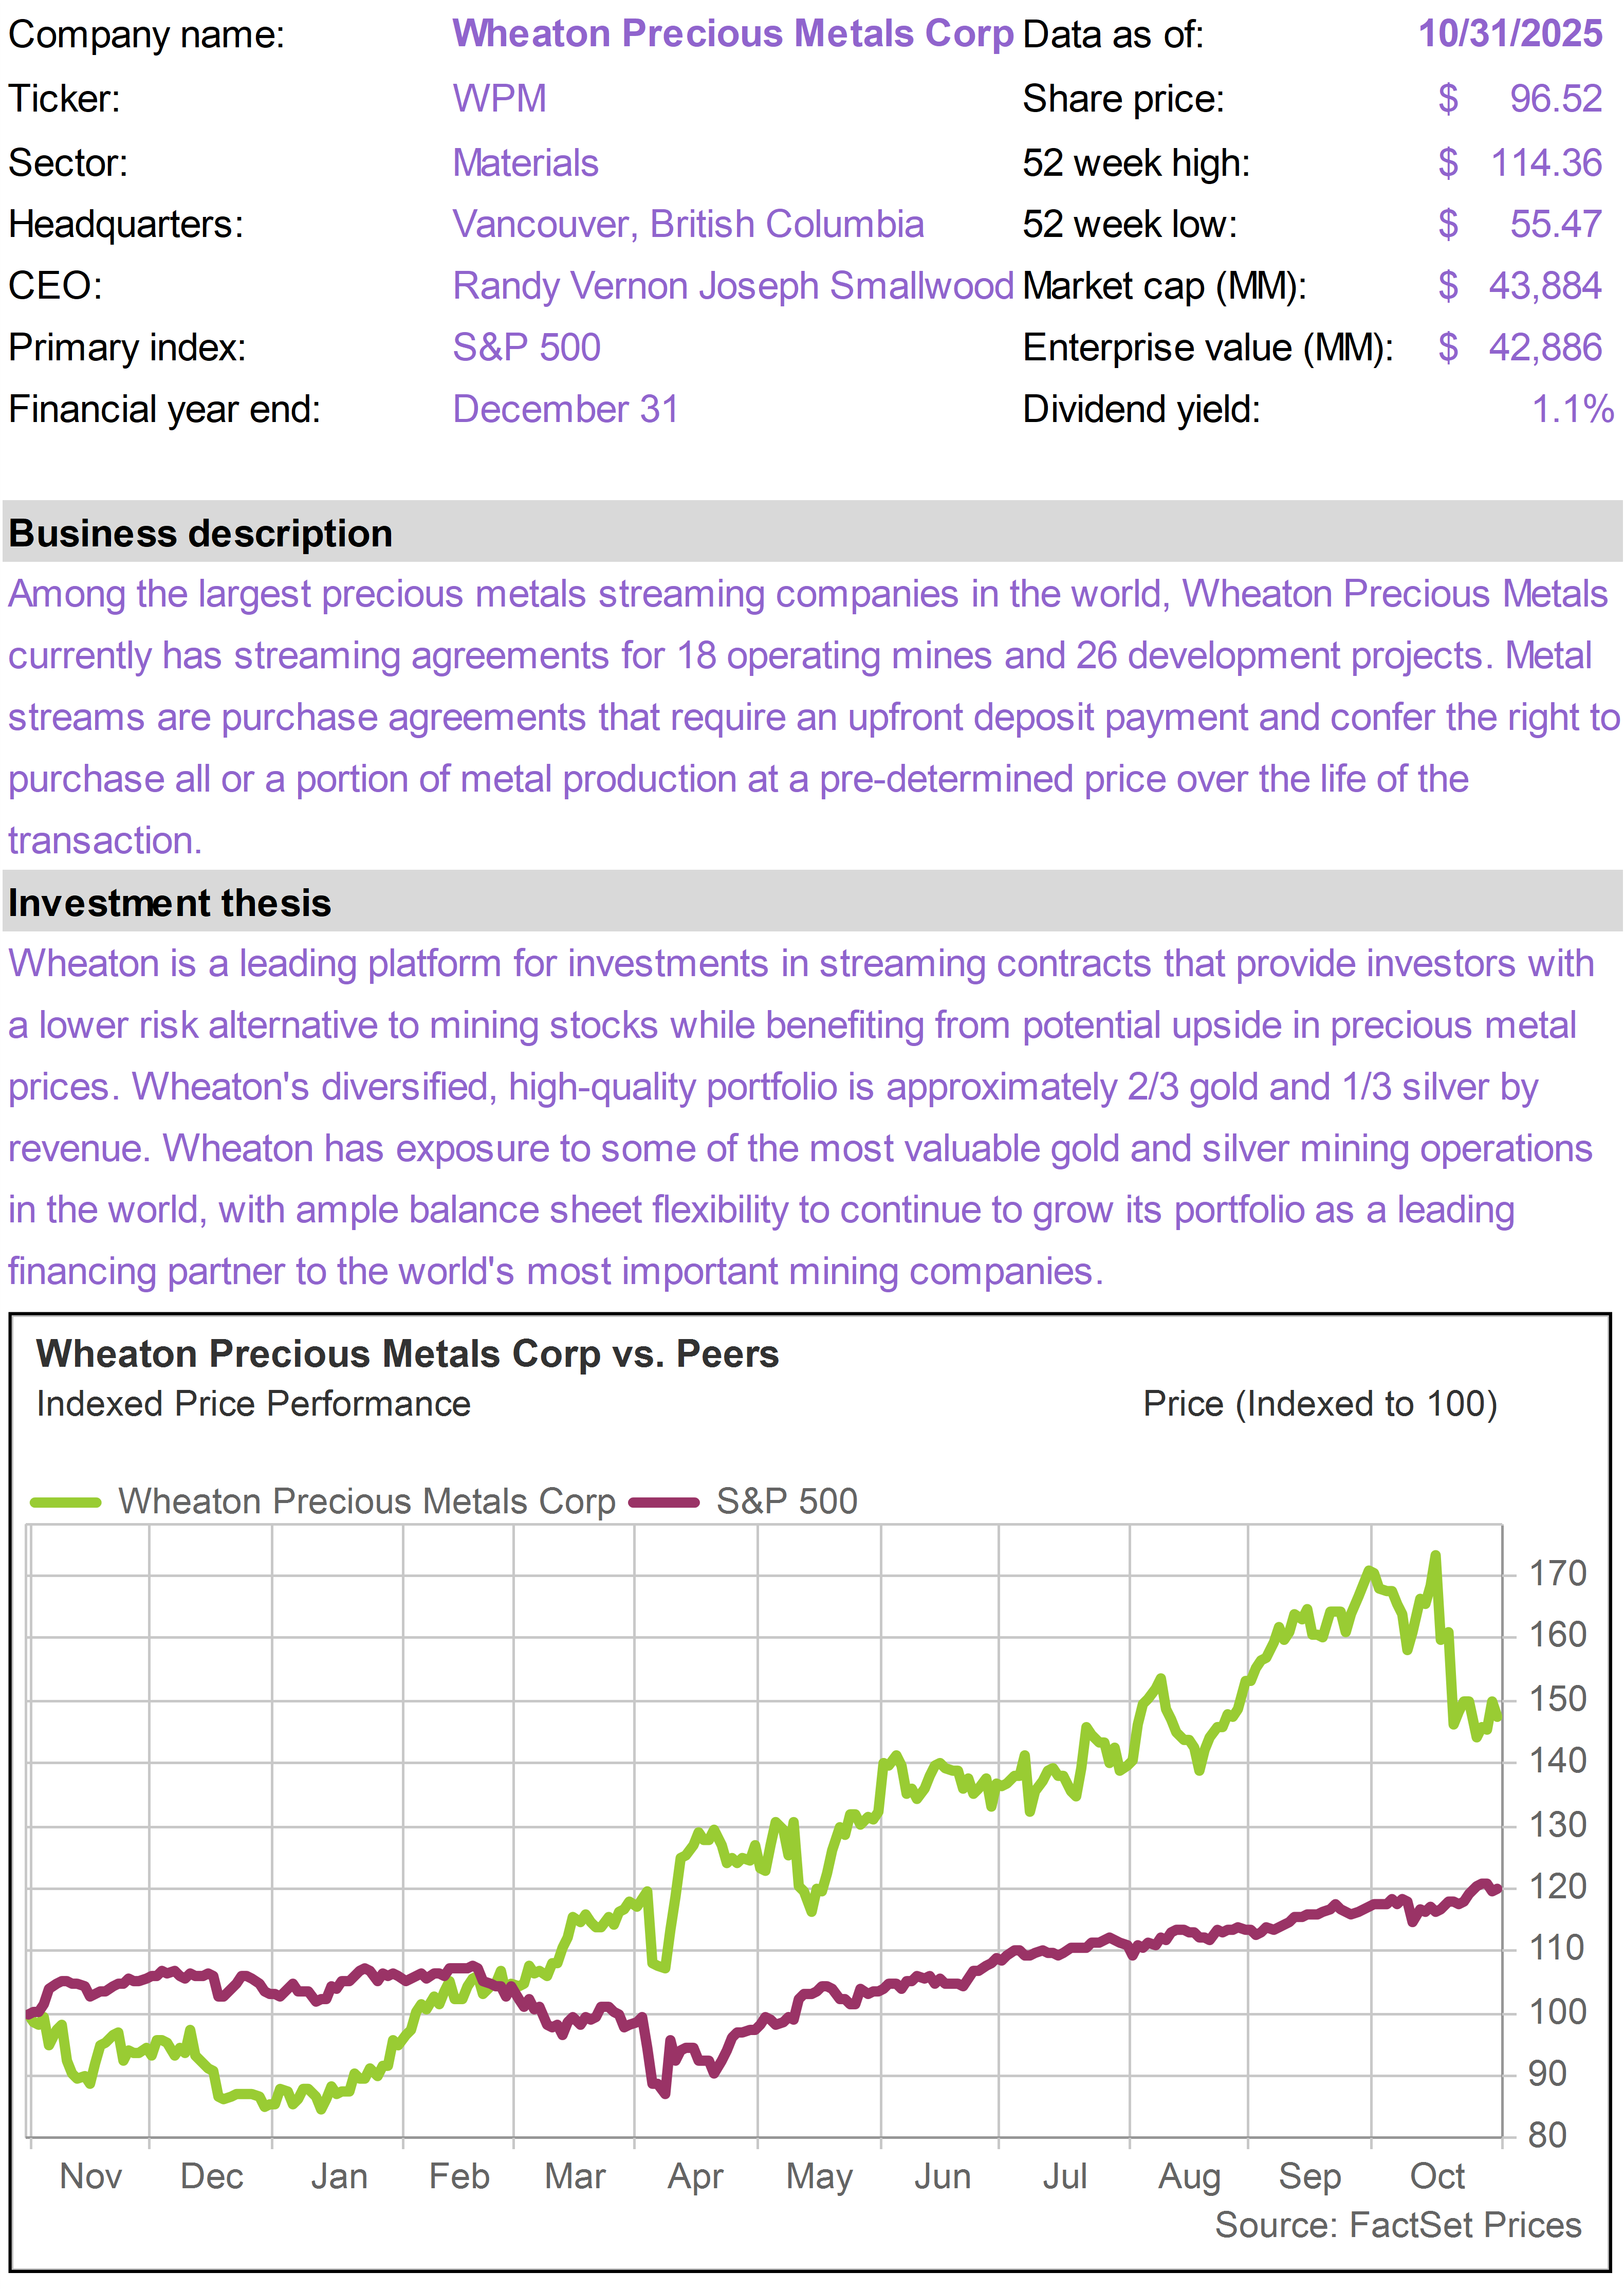
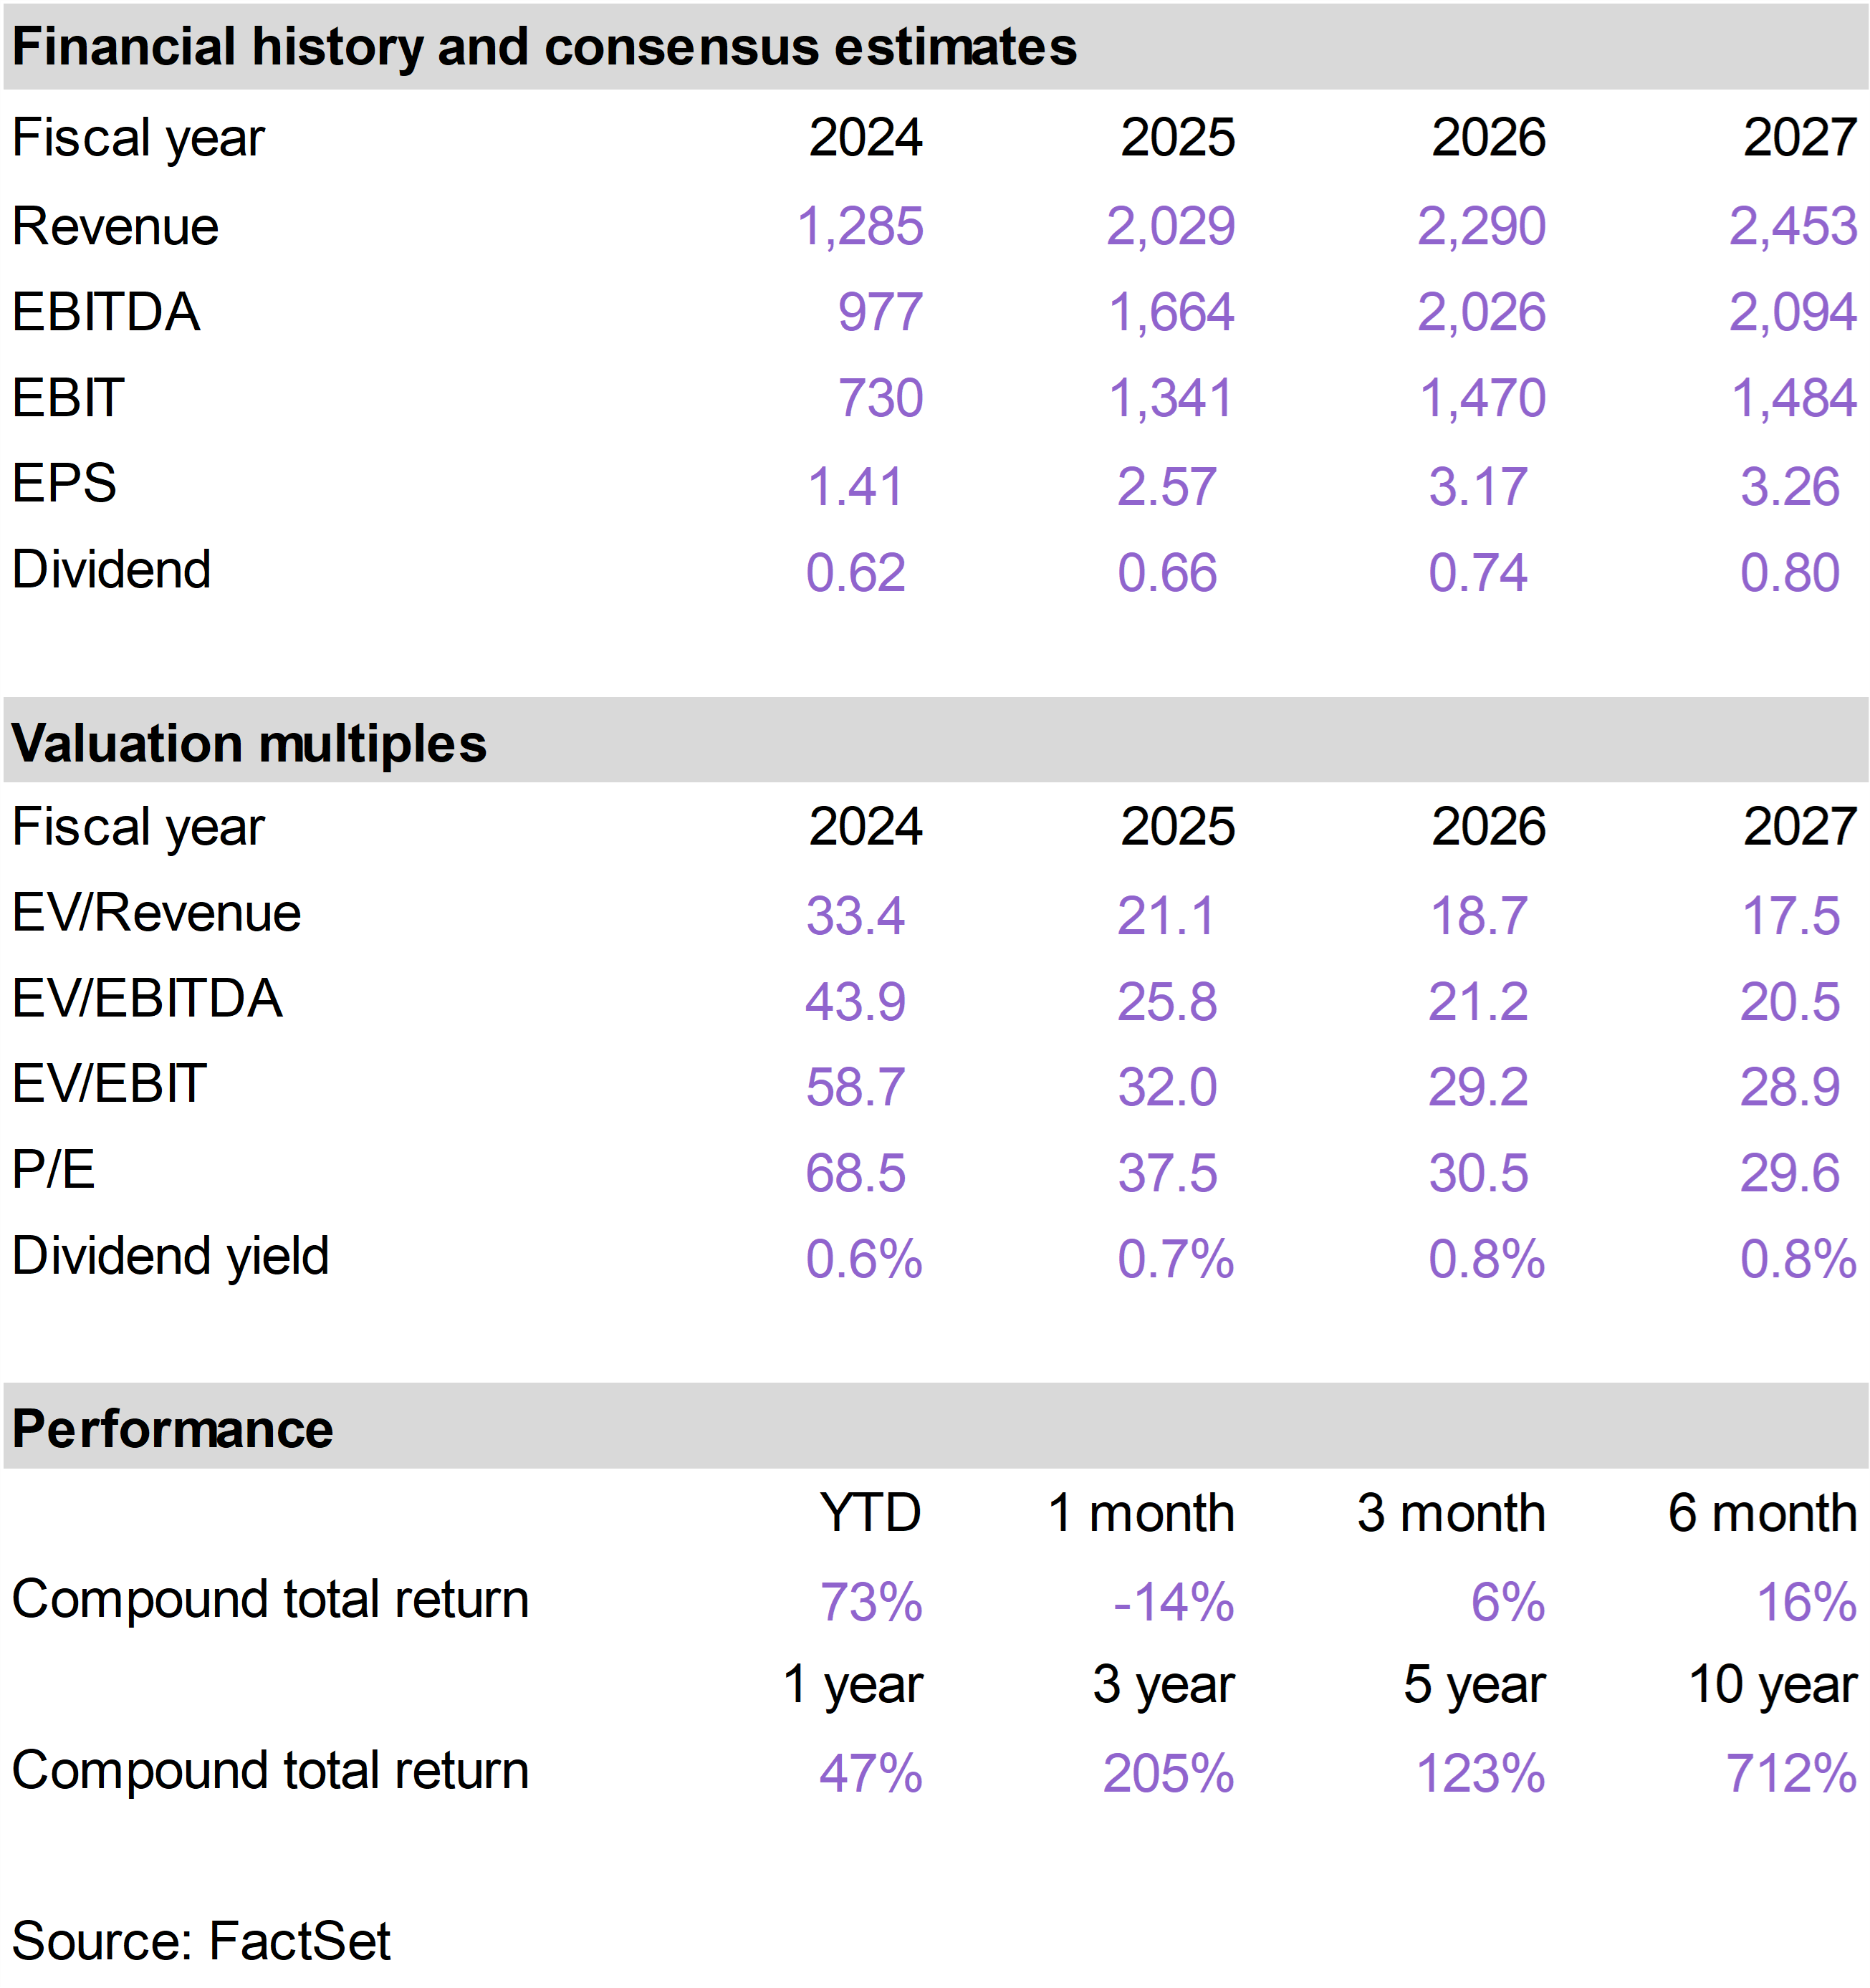
The portfolio’s worst performers were Franco-Nevada (FNV), which returned -16%; Floor & Decor (FND), which returned -15%; and Wheaton Precious Metals (WPM), which returned -14%. |
|
|
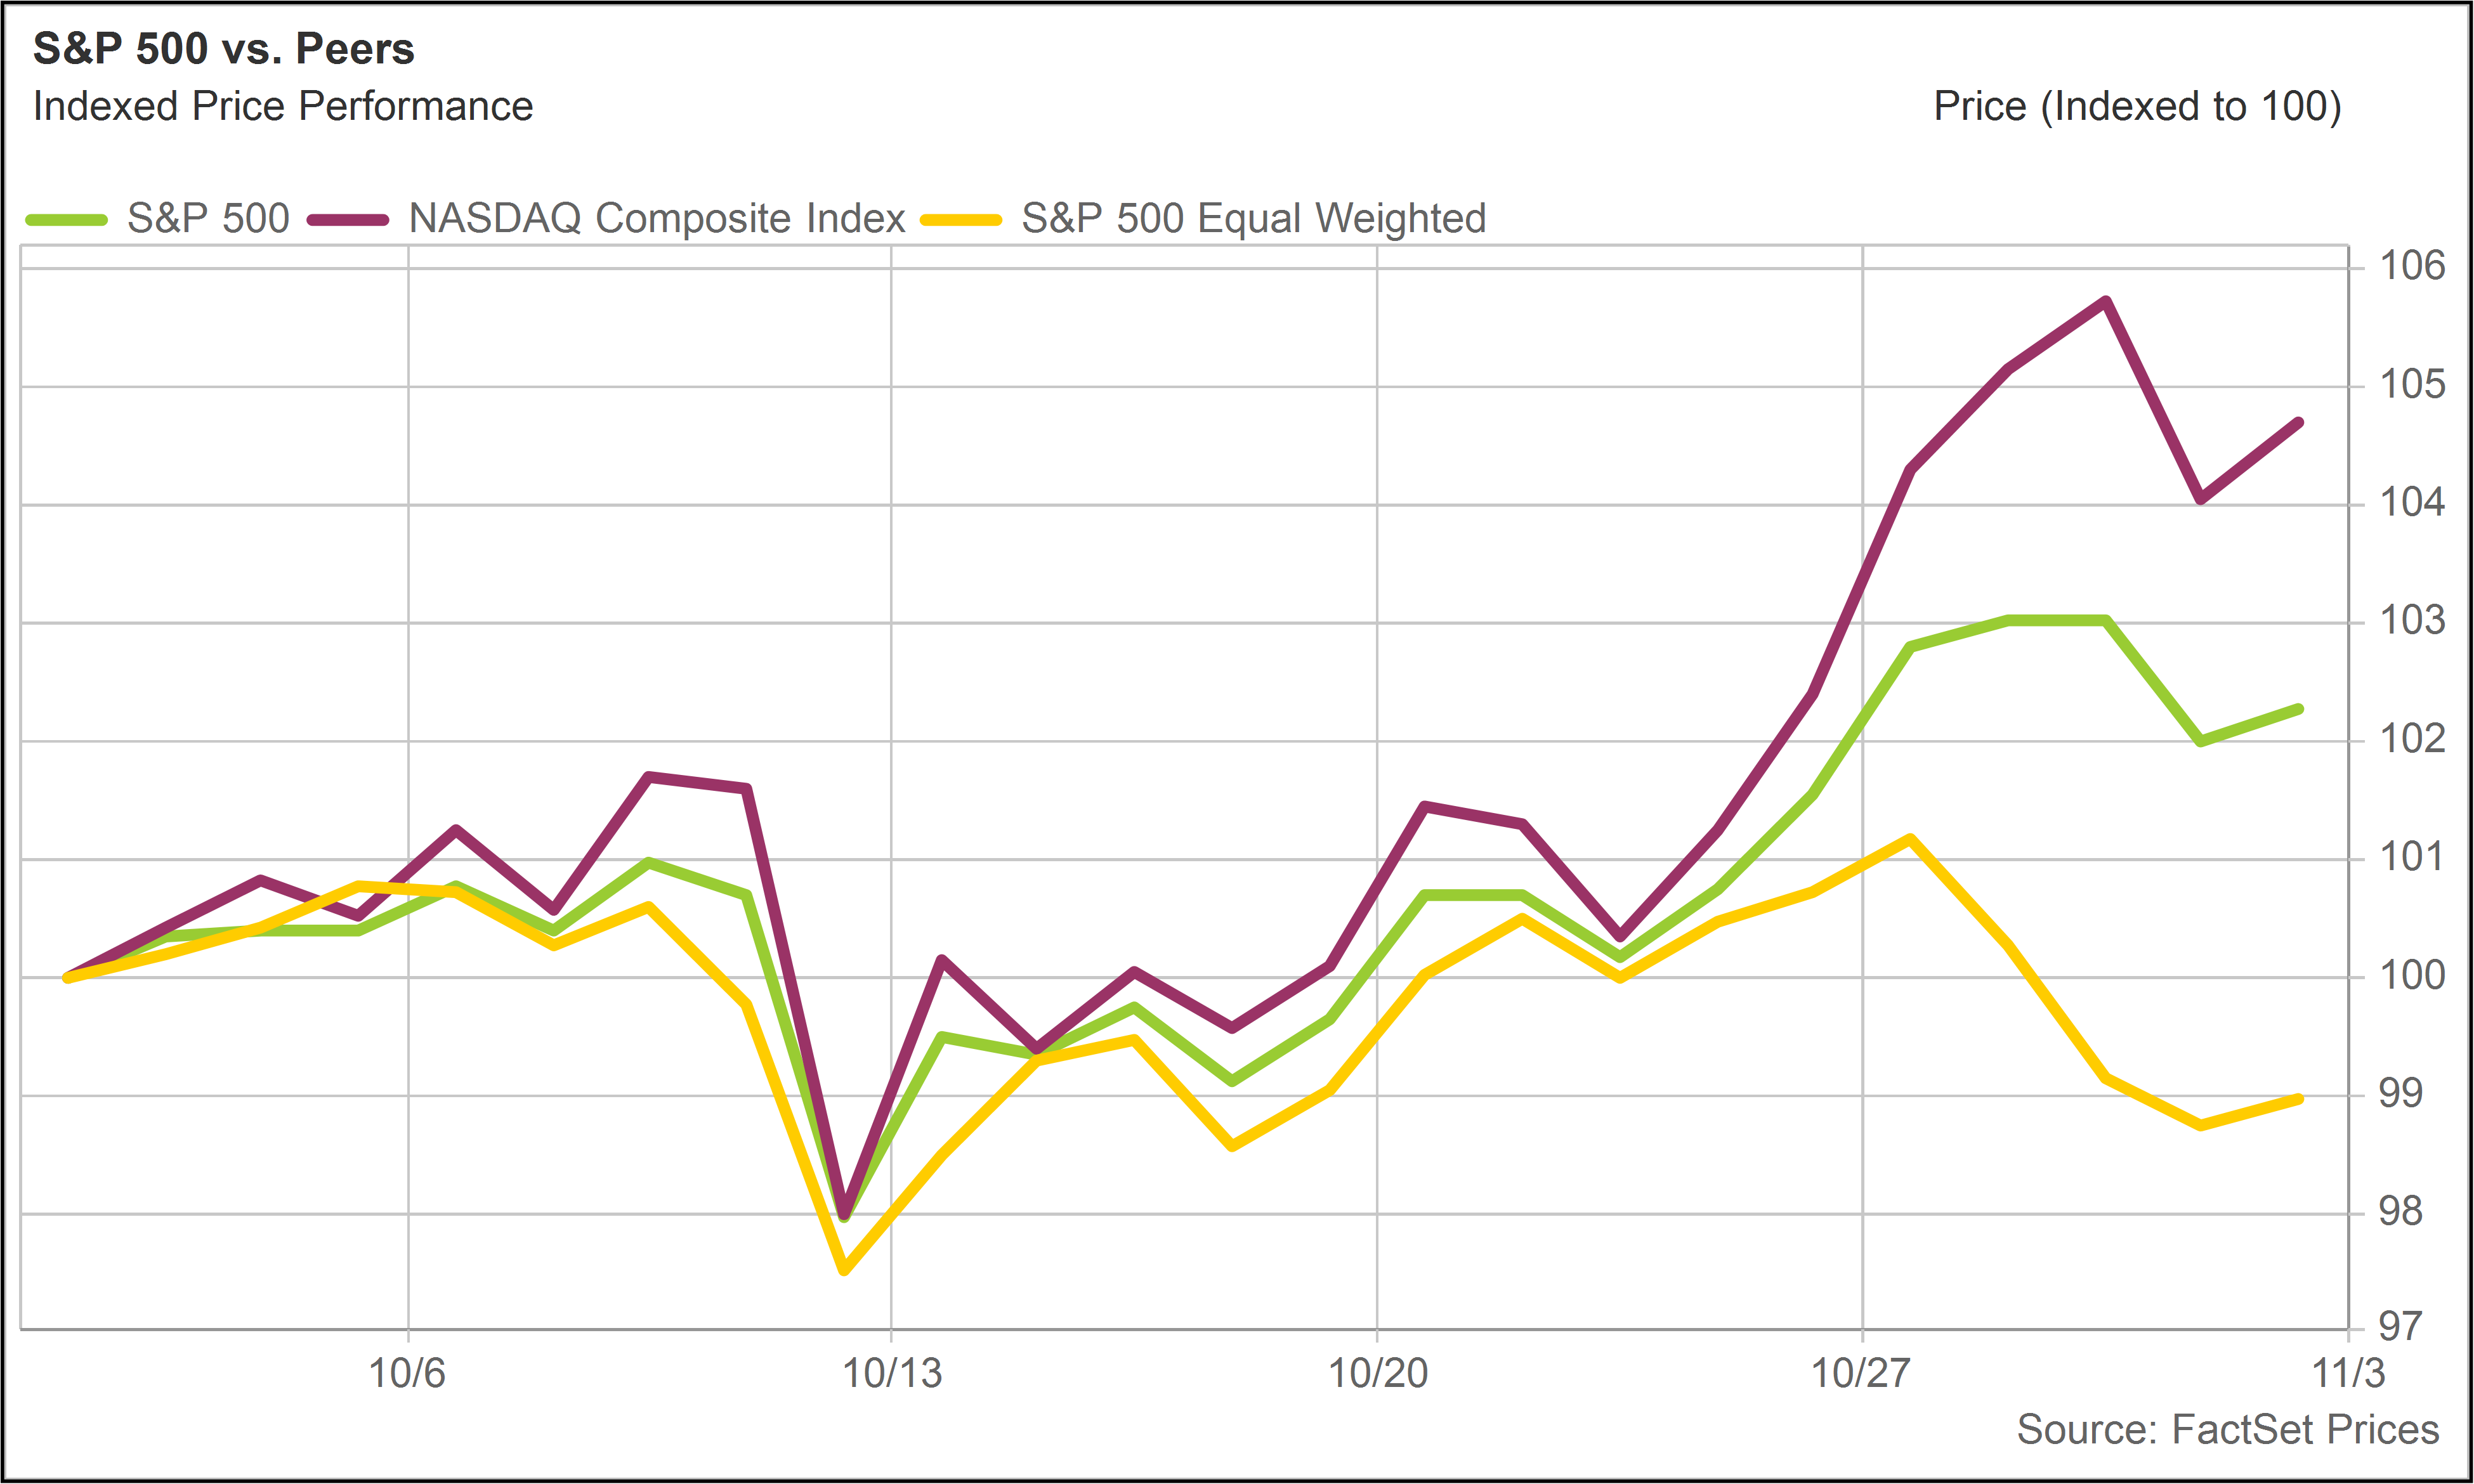
Tech dominant again
We noted last month that the tech sector significantly outperformed. This trend continued in October.
The tech-heavy Nasdaq Composite Index returned 4.7% this month. Large-cap tech stocks helped drive the performance of the market-cap weighted S&P 500 into positive territory. Meanwhile, the S&P 500 Equal Weight Index, which essentially reflects the average stock in the index, declined, returning -1.0%. |
|
|
|
S&P 500, NASDAQ, S&P 500 Equal WeightTotal Return (9/30/25 - 10/31/25) |
|
|
Positioning around AI
Stock market activity in October struck us as somewhat unusual and potentially impacted by mutual fund “window dressing” in the final ten days of the month.
We can see in the chart above that through October 22, the Nasdaq, S&P 500 and S&P 500 Equal Weight had generated similar performance. Relative performance then began to deviate sharply as the Nasdaq surged.
Window dressing is a phenomenon that can occur in any month or quarter. The general idea is that fund managers have an incentive to end the period with winners in the portfolio rather than losers. Portfolio holdings are only revealed at the end of these periods.
October 31 is a particularly significant date, because many mutual funds use that as their fiscal year end (approximately half of all stock funds). The IRS requires funds to distribute nearly all of their realized capital gains through November 1, so October 31 is a natural cut-off date.
The annual reports of mutual funds provide full disclosure of portfolio holdings and get filed as of the fiscal year end cut-off date. So if there is ever a moment that fund managers want to make their portfolios look pretty, it is at the end of the fiscal year.
This activity can put pressure on stocks and entire sectors that were laggards over the prior year and elevate stocks and sectors that have performed well. However, the impact is temporary, as this source of market distortion goes away once the new fiscal year begins.
To the extent fund managers are worried about optics, their incentive is to move money into the best performing stocks prior to the books closing. This may have played a meaningful role in October, especially at the very end of the month.
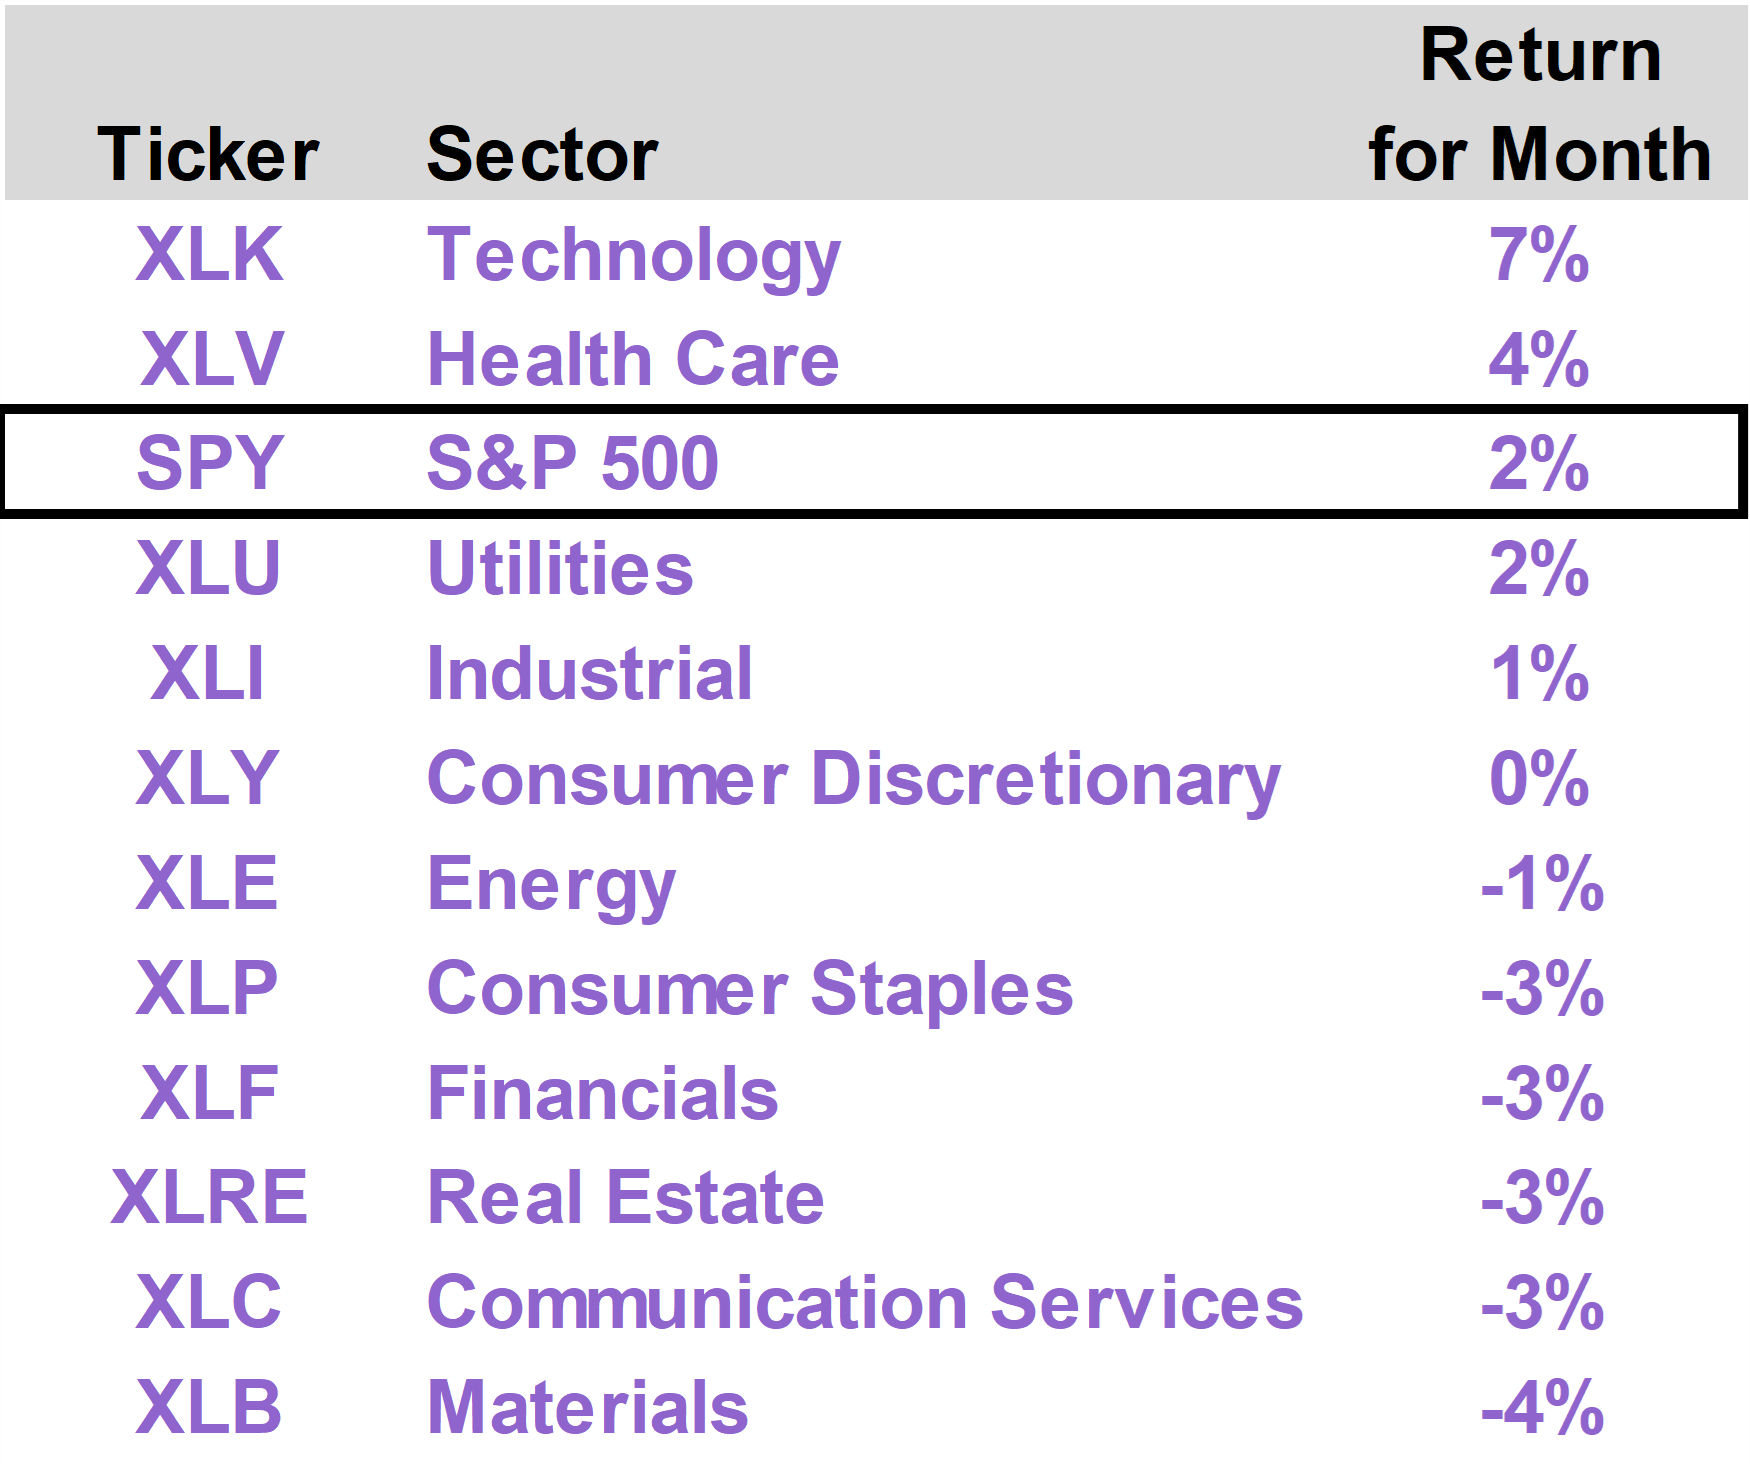
The Technology sector generated a total return of 7% in October, while the majority of other industry sectors produced flat or negative performance. |
|
|
| |
Sorting AI winners and losers
AI continues to occupy the focus of most investors. There is a general concern about an AI bubble, which we recently addressed in the 76report (“So, Are We Headed for a Crash or What?”)
There are several dimensions to this concern. Investors are in part anxious because AI plays, like NVIDIA (NVDA), which now has a $5 trillion market cap and represents 8% of the S&P 500 Index, have become such a huge component of the overall market.
Investors seem to toggle between anxiety around AI overvaluation and fear of being underinvested in the market leaders of the technological trend that is reshaping the entire economy.
With so much uncertainty around AI, there is also a great deal of trepidation around whether any particular stock will ultimately benefit or suffer from the technological changes that are underway. No company wants to be perceived as an AI victim, and no fund manager wants to own one.
Meanwhile, stocks that are simply not seen as central to the AI theme, even ones that may be longer term AI beneficiaries, are arguably being neglected.
Broader economic concerns
As investors focus on the trajectory of AI and the best way to play it, they also have a lot of questions about what is going on across the rest of the economy.
AI-related capital spending is driving growth, but it is also diverting funds from hiring workers. On top of that, as AI actually gets implemented, it will inevitably replace workers.
Although classified within the Consumer Discretionary sector, Amazon (AMZN) is a tech stock that performed especially well in October, delivering an 11% total return.
Even with this strong performance, AMZN has actually underperformed this year. It was essentially flat on the year until late October, when the company reported solid third quarter results.
AMZN showed acceleration in its cloud business, but what really caught the market’s attention was its announcement that it would be laying off some 14,000 workers, a move driven by its goal of becoming a leaner organization that is empowered by AI tools.
As the second largest private employer in the United States behind Walmart (WMT), AMZN is an interesting company to watch from a labor market perspective—a potential canary in the coalmine.
The Fed cuts again
Against the backdrop of this emerging trend of companies demonstrating healthy earnings growth and a shrinking employee base, the Federal Reserve moved to cut interest rates again at the October 29 FOMC meeting. The Fed funds rate was reduced by 25 basis points to the 3.75% to 4.00% range.
New Fed Governor Stephen Miran, on leave from his position as Trump’s Chair of the Council of Economic Advisers, dissented like he did at the prior meeting. He again wanted to see a 50 basis point cut.
Miran’s dissent reminds the world that a new regime at the Fed likely awaits us next spring when Jerome Powell’s term as Chair comes to an end. Under new leadership, the Fed will almost certainly be inclined toward lower rates and easier monetary policy to promote growth.
At the late October meeting, the Fed also indicated it would end Quantitative Tightening (QT) on December 1. This policy shift relates to how it manages its own balance sheet.
While the mechanics behind QT can be complex, the key point is straightforward: by slowing or ending QT, the Fed is signaling a willingness to increase liquidity in financial markets. This complements the move toward lower interest rates and indicates a broader policy shift toward easing financial conditions.
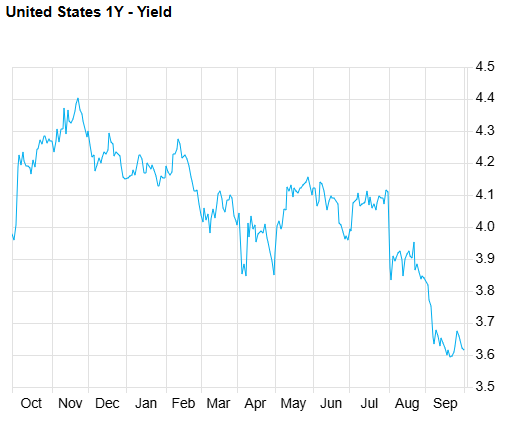
The 25 basis point rate cut was fully expected, however, and Powell’s tone on the path of future rate cuts was interpreted as slightly hawkish. So short-term Treasury yields rose slightly at the end of the month following the meeting, which may have also put pressure on stocks in cyclical sectors. |
|
|
| 1-Year Treasury Yield(Last 12 Months) |
|
|
The main topic for the Fed remains jobs. Even though inflation remains “somewhat elevated,” the Fed has been reacting to slowing job gains and an unemployment rate that “has edged up.”
While the pressure on the labor market understandably makes many investors uneasy, as it historically correlates with an economic slowdown, we continue to view it as a net positive for investors in stocks because it is the necessary pre-condition for easier monetary policy.
To the extent unemployment rises, the Fed will remain inclined to keep rates low, given its full employment mandate. A weak job market also takes the edge off inflation pressures, as wages inevitably moderate with workers losing bargaining power.
Higher unemployment also dampens consumer confidence and spending on the margin, which gives the Fed yet another reason to keep its foot on the gas pedal.
A massive spike in unemployment, like was saw in 2020 when the economy got shut down, is an entirely different matter, but moderate slack in the labor market helps keep the Fed biased toward making monetary conditions “less restrictive.”
Out of favor opportunities
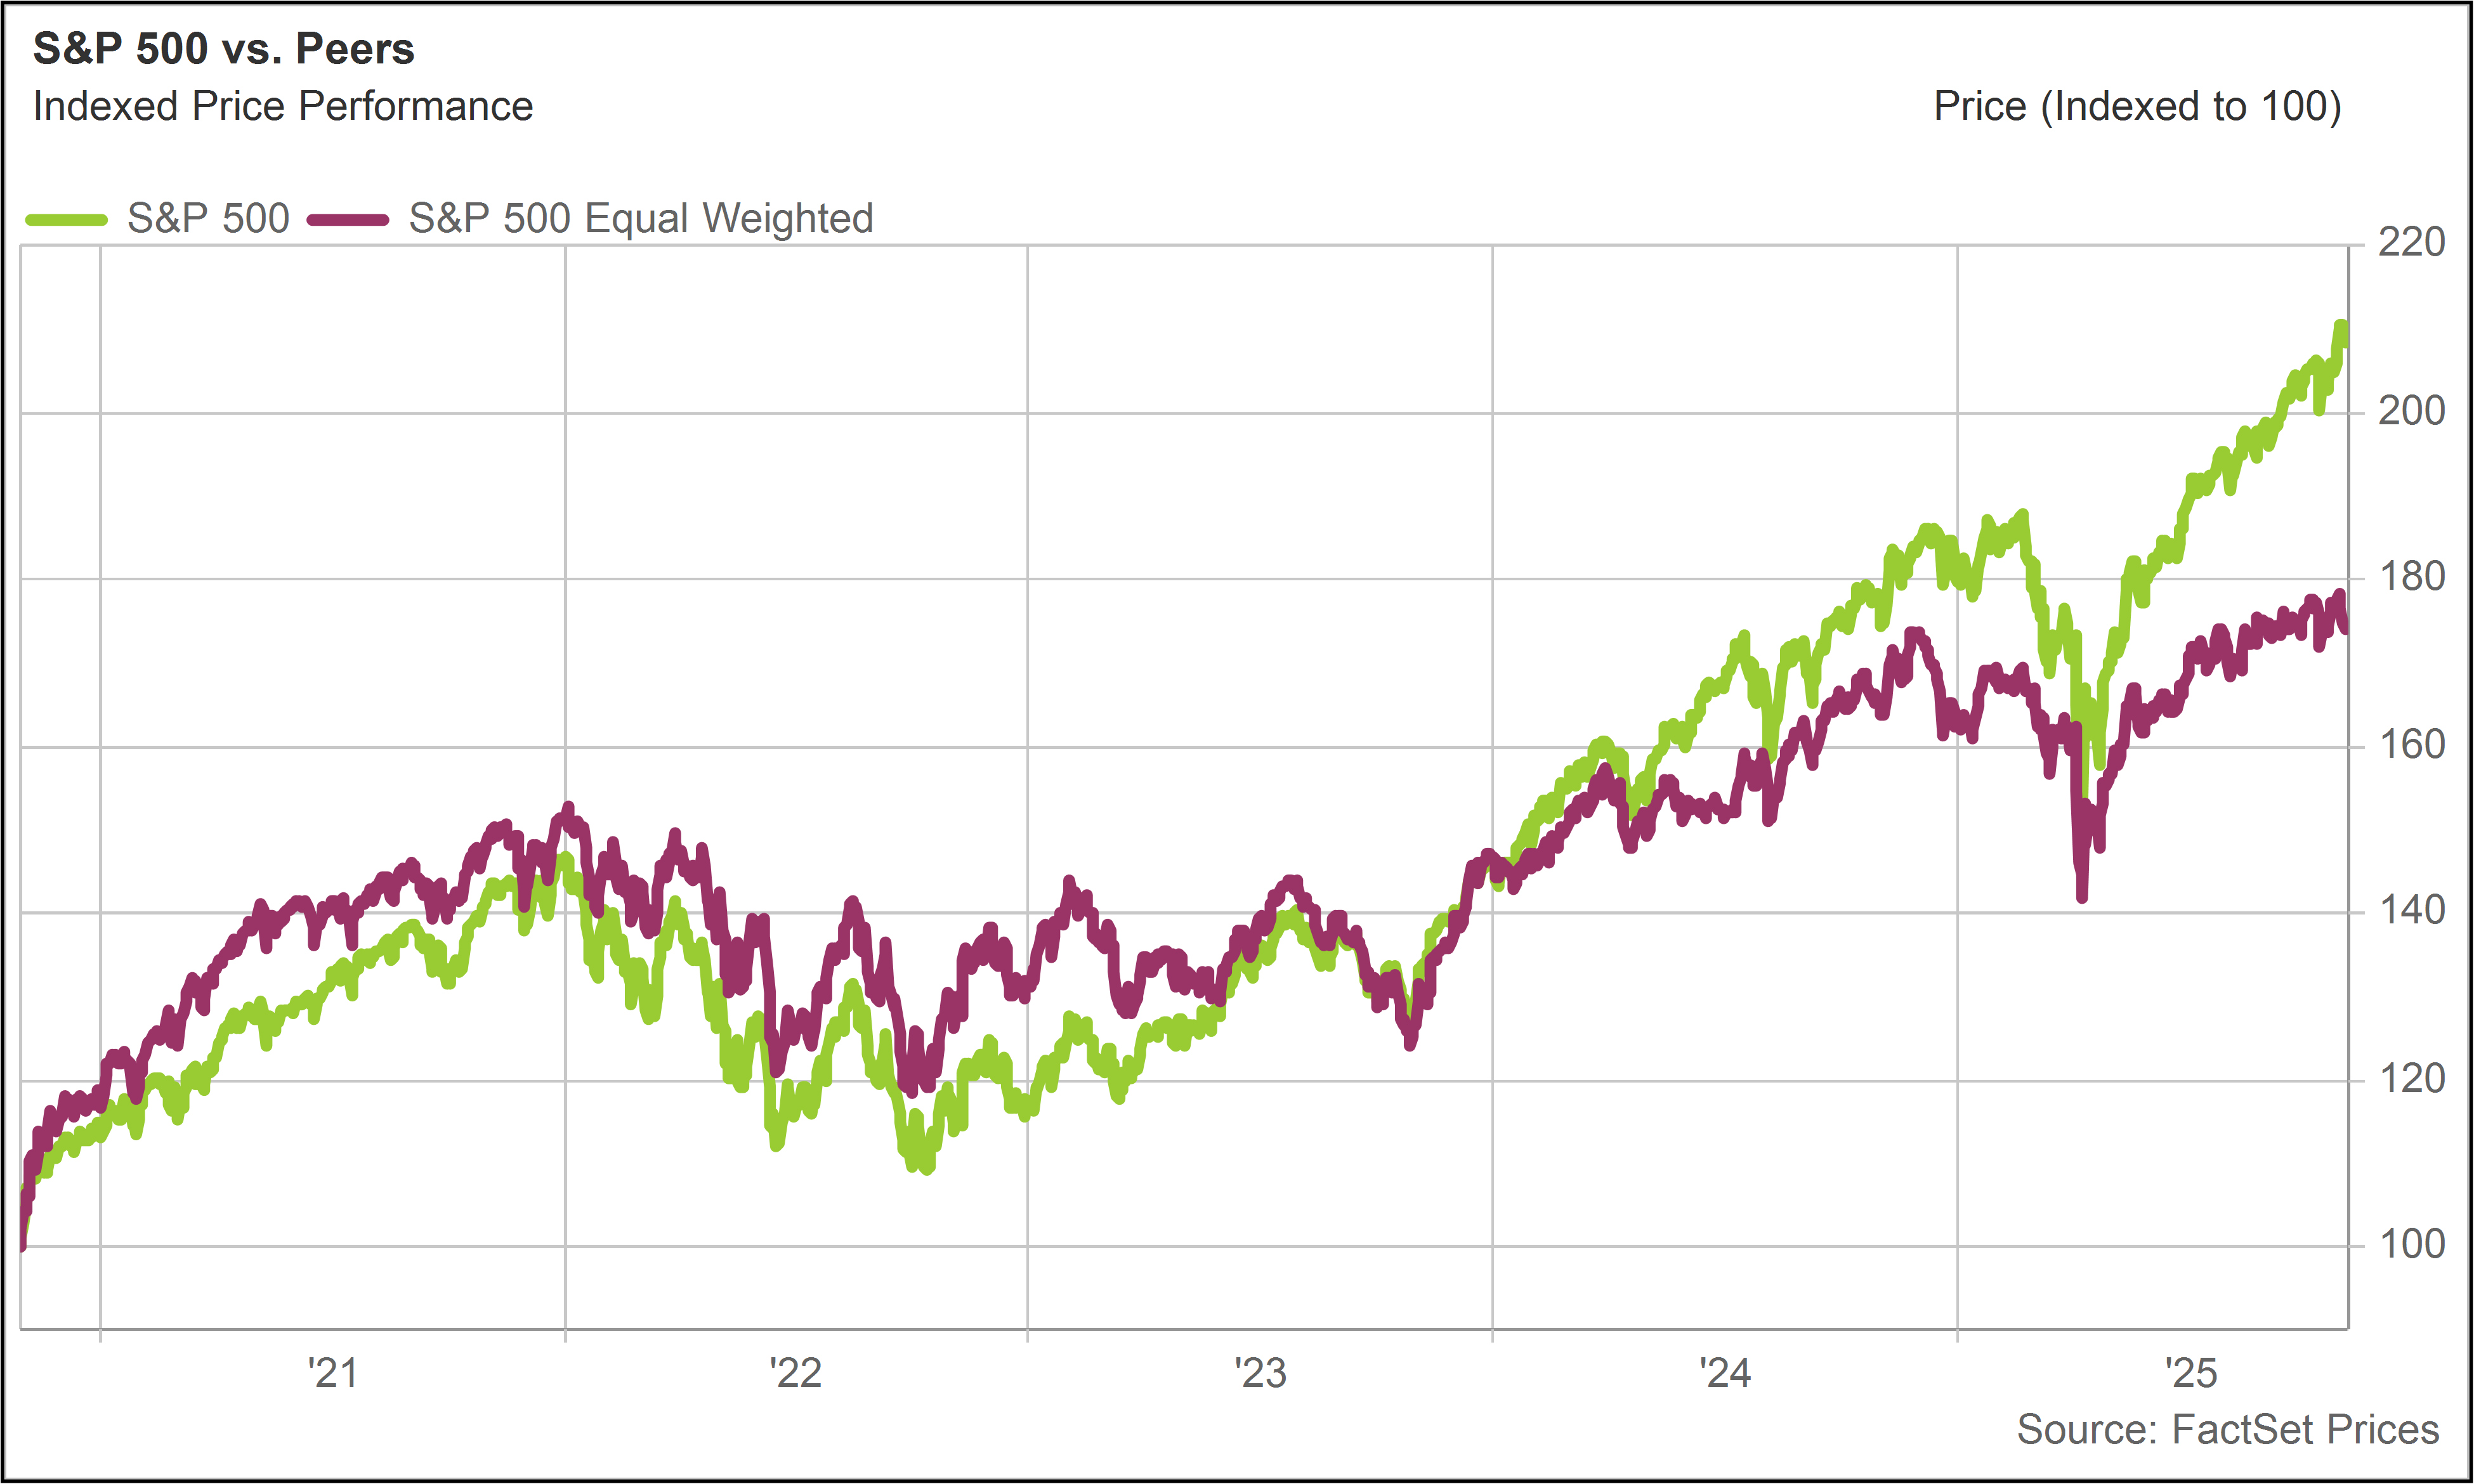
We like to compare the S&P 500 to the S&P 500 Equal Weight Index because it shows the extent to which performance is being driven by the very large market cap leaders.
Over long periods of time, the two indexes tend to deliver similar performance, but there are phases when large cap names, which are skewed towards the big tech platforms, significantly outperform. The past few months have been one of those phases. |
|
|
|
S&P 500 vs. S&P 500 Equal WeightTotal Return (Last 5 Years) |
|
|
Investments in broad, passive index strategies, especially those tied to the S&P 500 and the Nasdaq, tend to perform well during periods of market concentration, when a relatively small group of large companies drives the majority of returns.
In these environments, capital crowds into the biggest winners, pushing valuations higher and reinforcing the momentum. For investors who own high-quality businesses outside of the prevailing narrative, this can be frustrating.
Solid companies with durable earnings power may underperform simply because they are not aligned with the hottest themes of the moment.
Over time, fundamentals tend to reassert themselves: leadership rotates, valuations normalize, and neglected areas of the market reprice. Periods of dispersion therefore create opportunity for investors who are steadily accumulating ownership in strong, well-positioned businesses that may be temporarily out of the spotlight. |
|
| | | The top performing stocks in the Inflation Protection portfolio this month were WESCO International (WCC), which returned 23%, and Freeport-McMoRan (FCX), which returned 7%.
The worst performing stocks in the portfolio were Franco-Nevada (FNV), which returned -16%; Floor & Decor (FND), which returned -15%; and Wheaton Precious Metals (WPM), which returned -14%. |
|
|
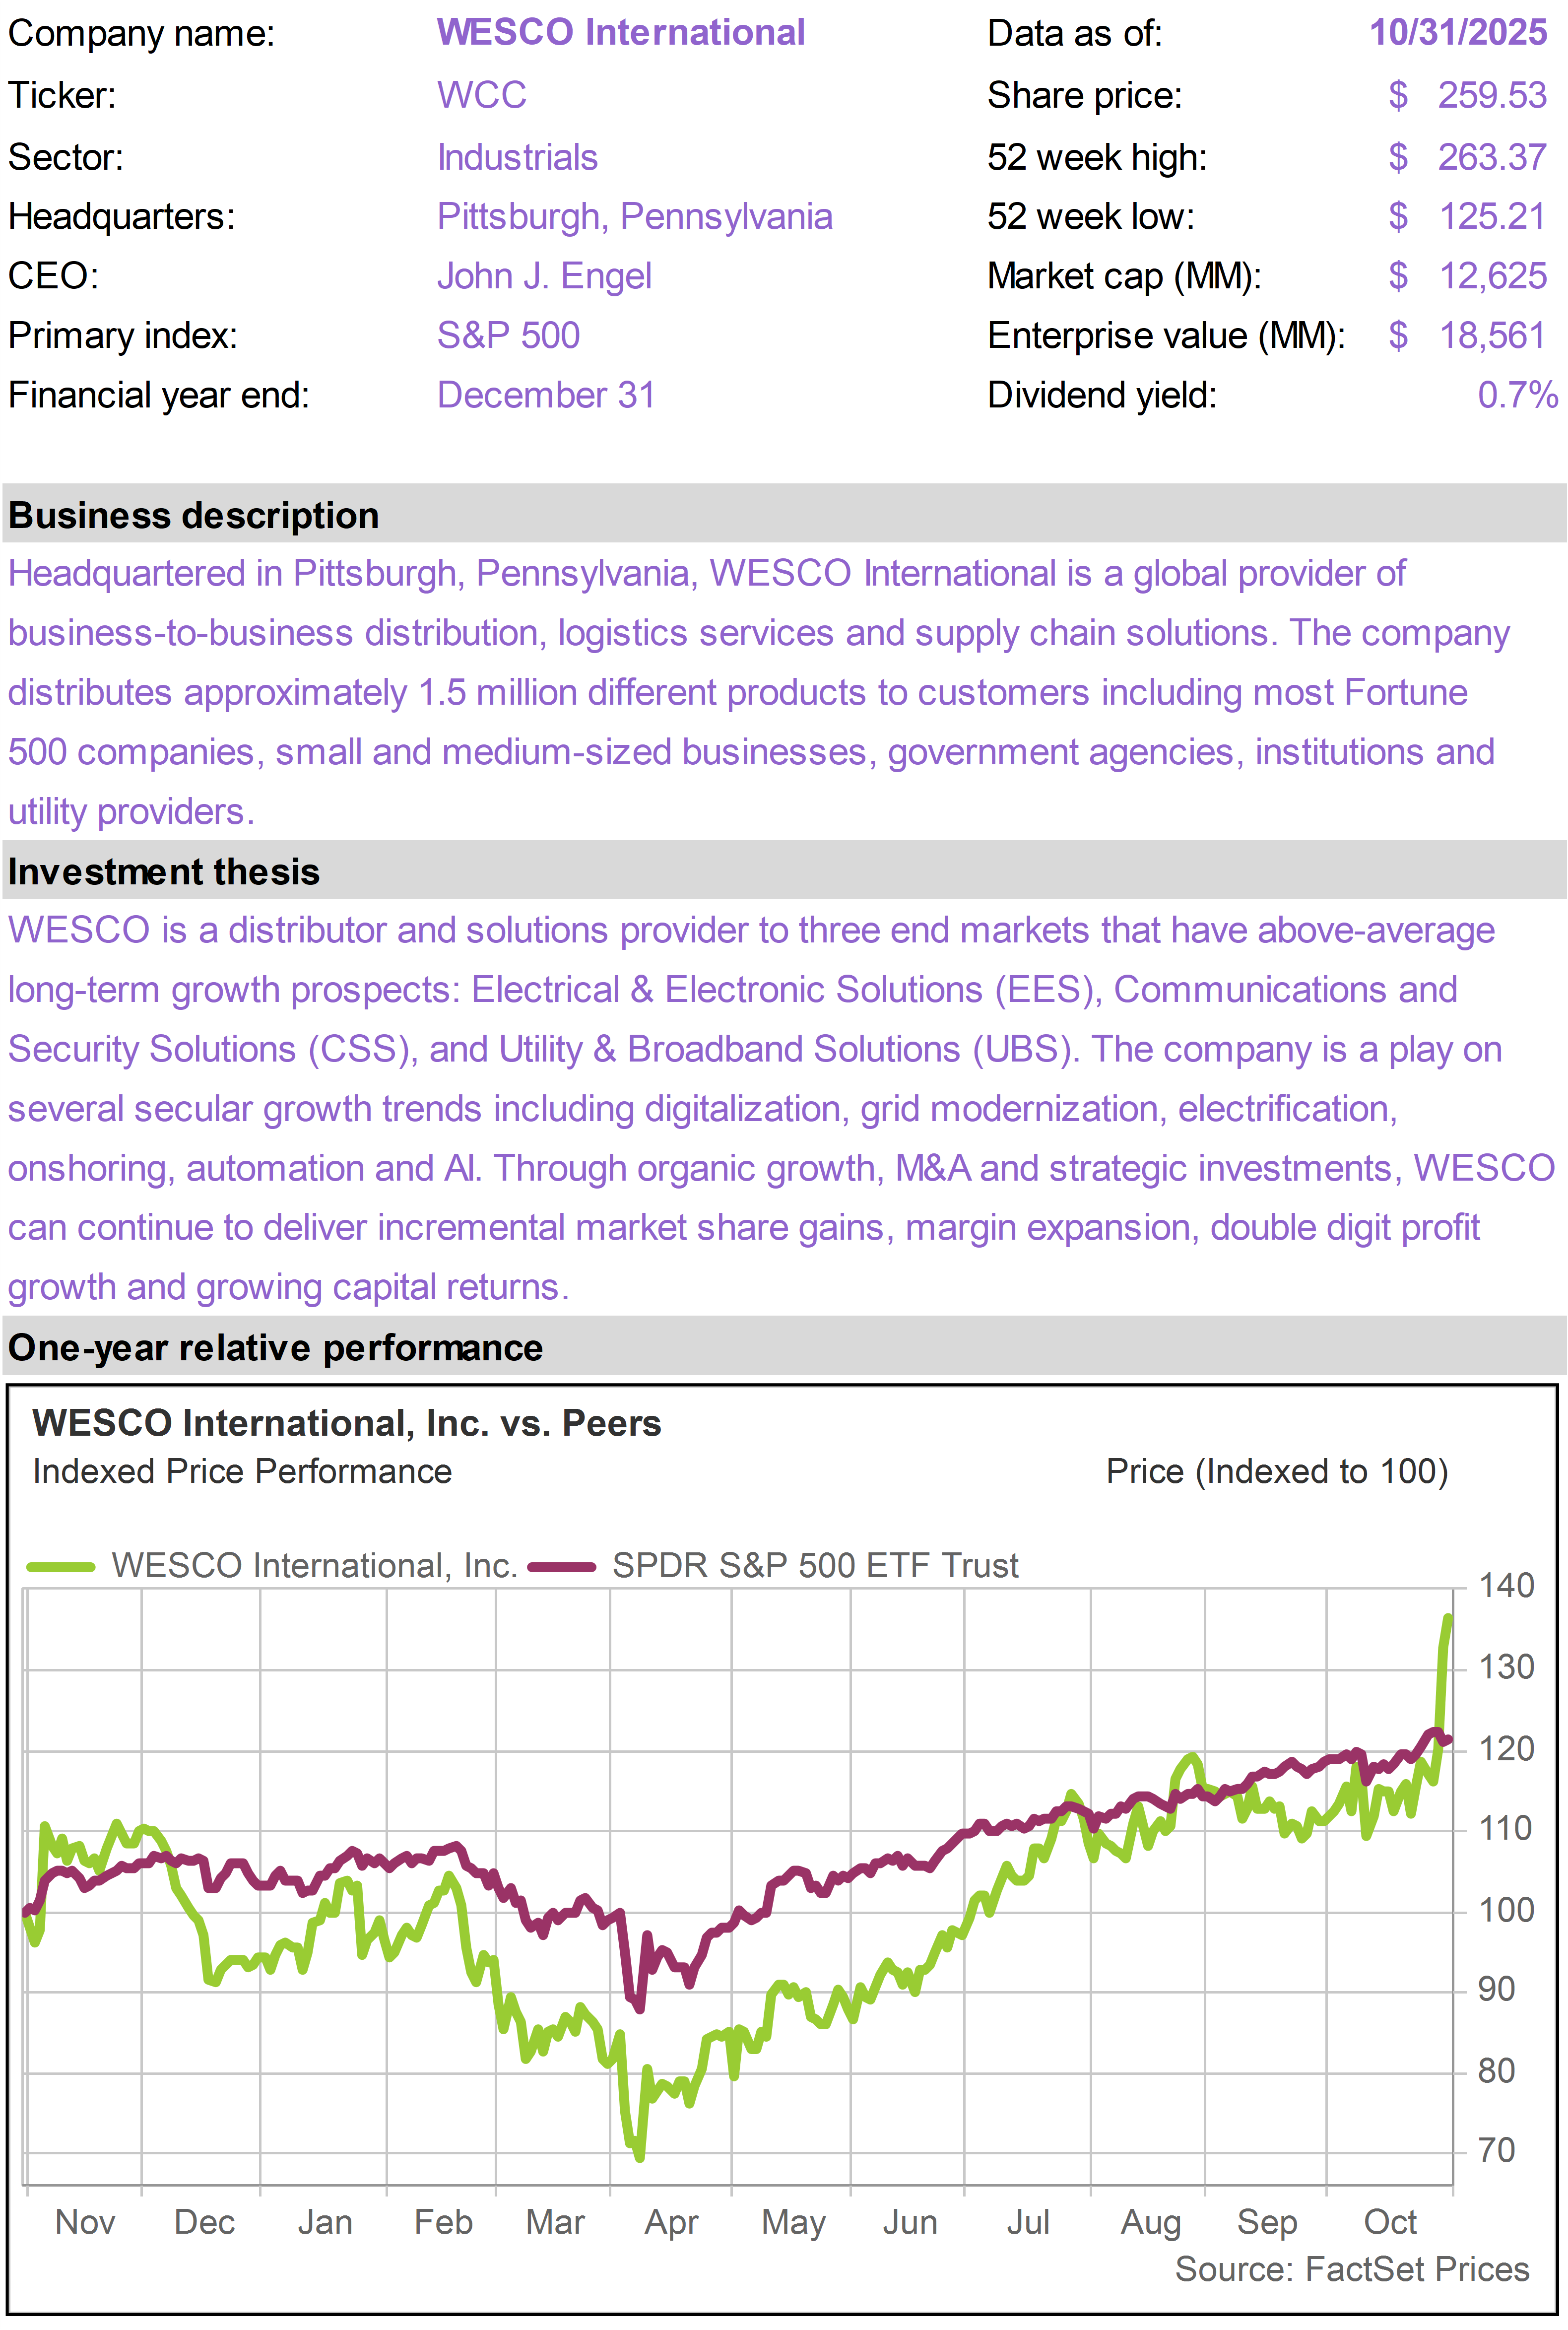
WCC is a distributor of electrical, data networking, security, and industrial products. Distribution businesses tend to have good inflation protection characteristics because they are essentially middlemen that can pass through higher costs to customers.
This particular distribution business was chosen for the portfolio because it is extremely well-aligned with AI structural growth trends. Investors are increasingly recognizing the value of this alignment, especially after WCC reported third quarter results at the end of October.
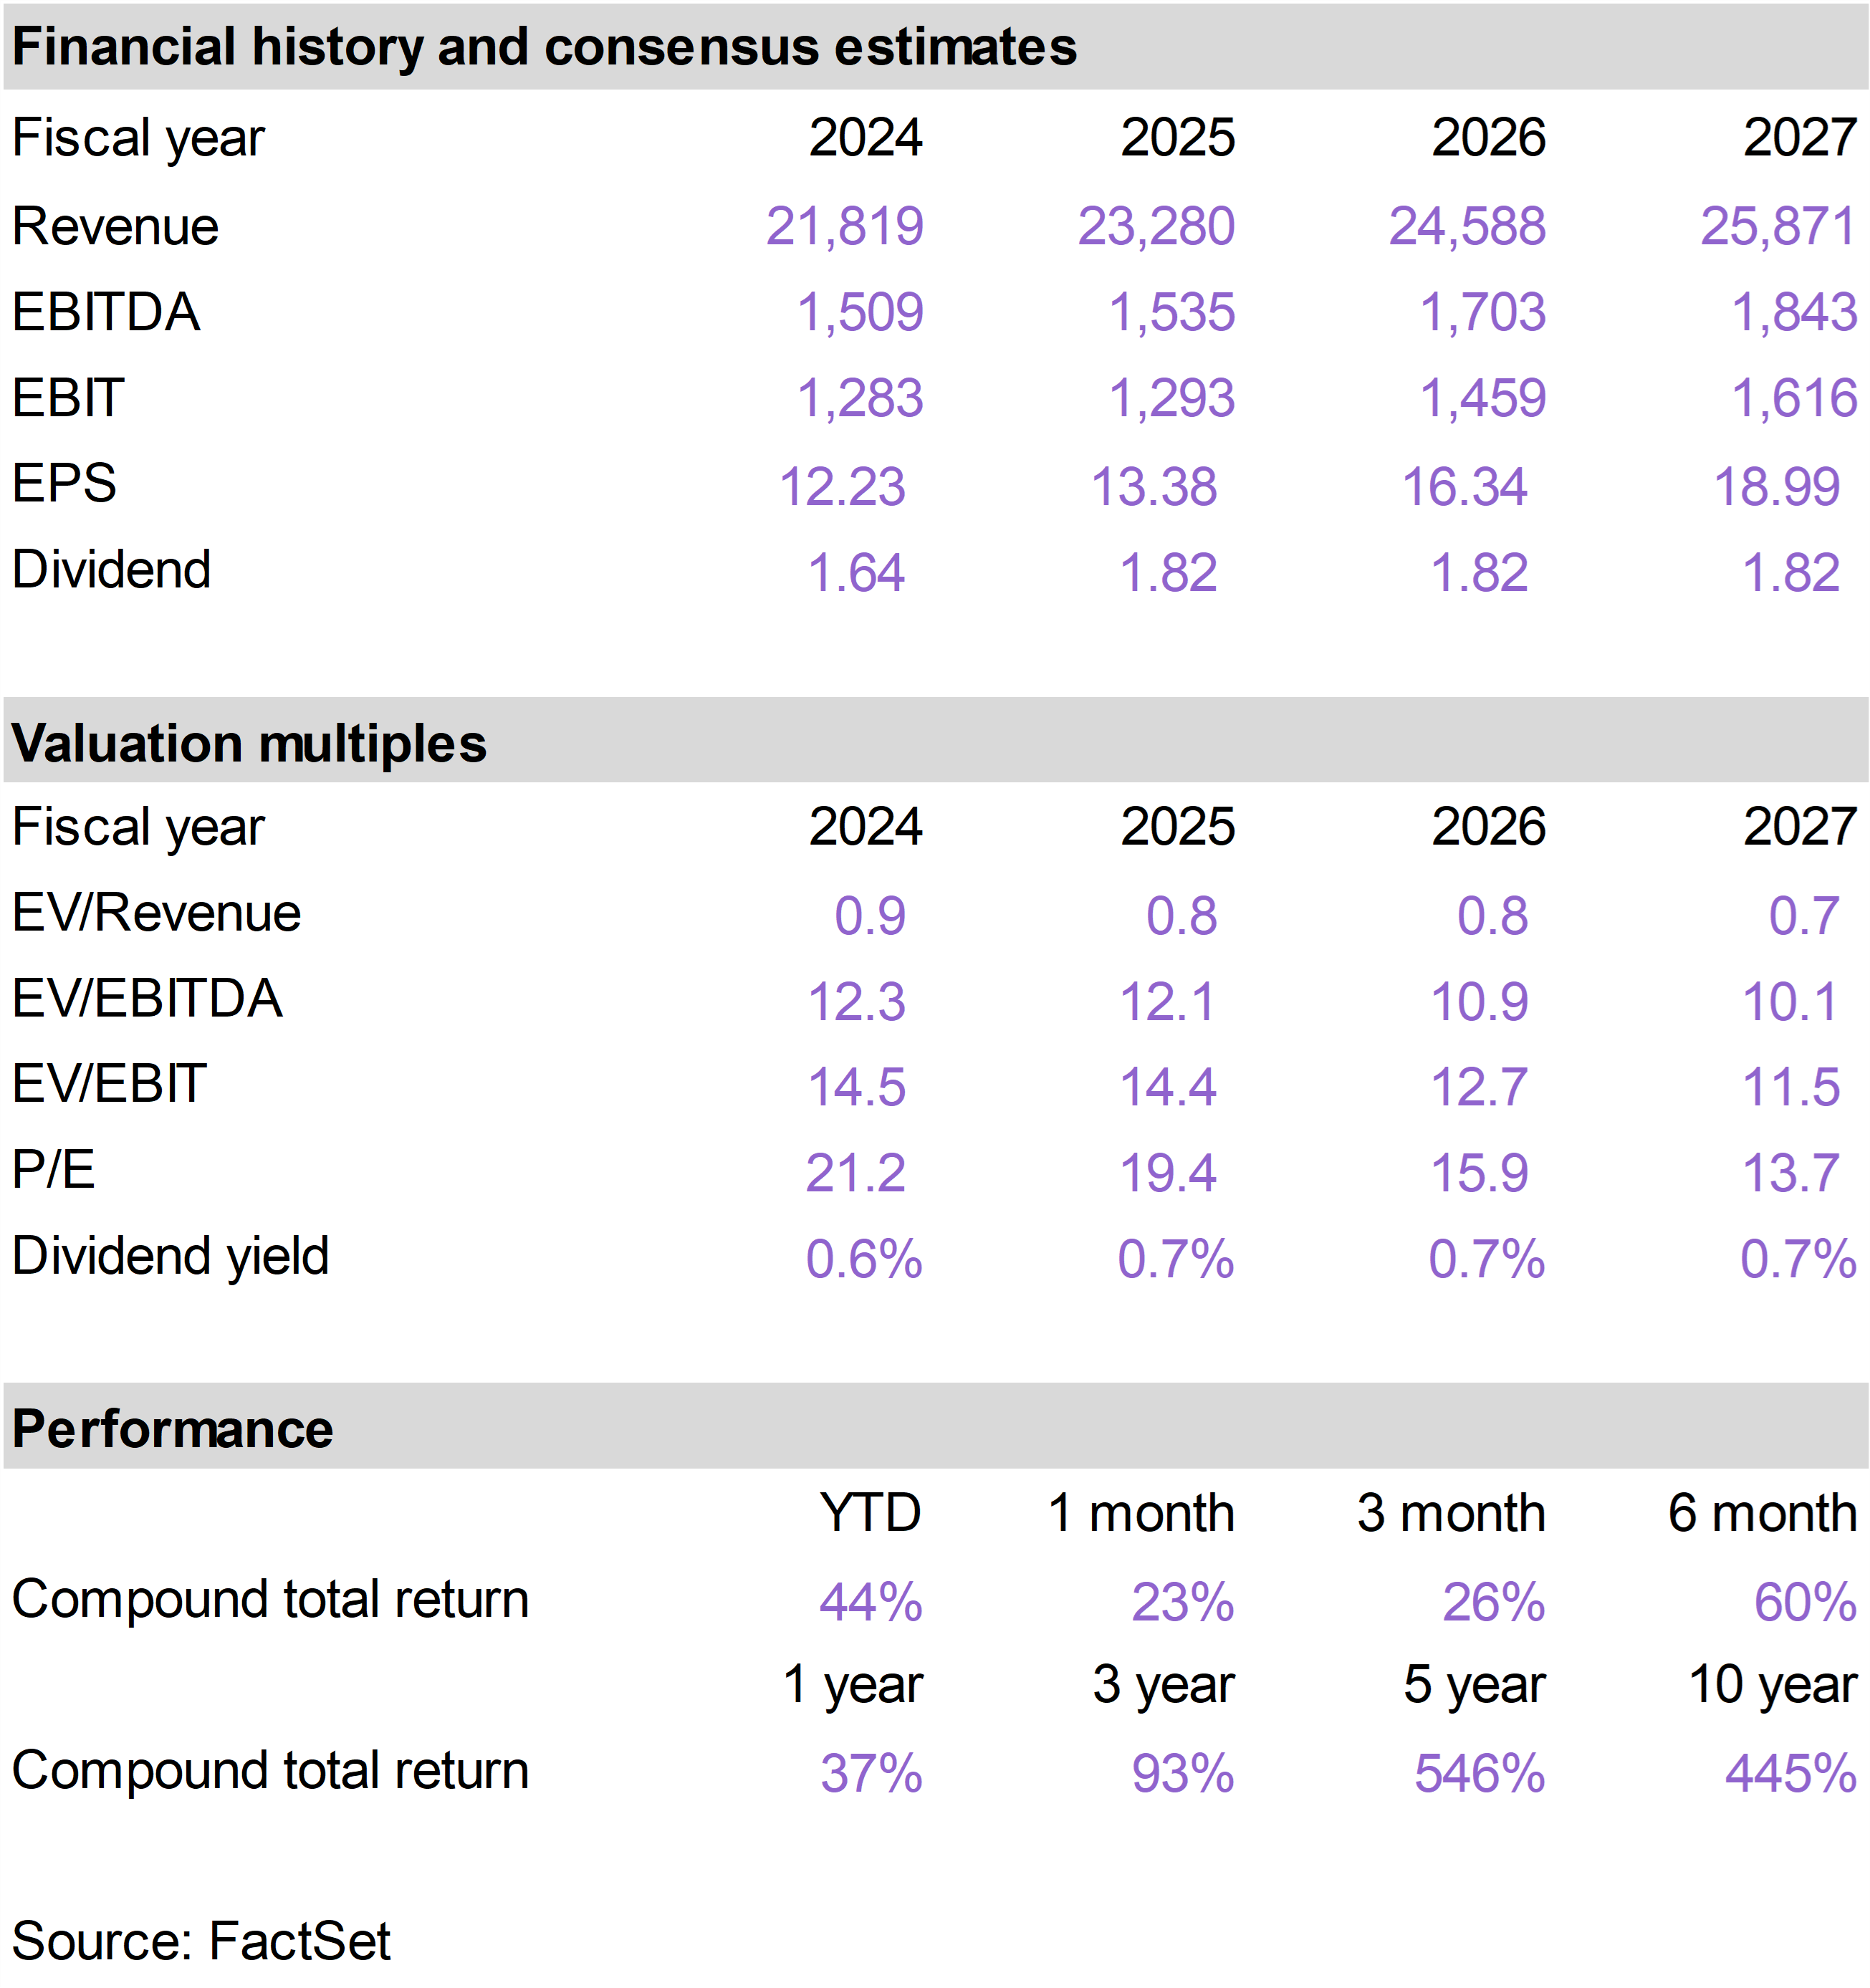
Thanks to accelerating demand from data centers, utilities, and electrification projects, net sales increased 13% year over year. Data center revenue was a standout, rising roughly 60% year over year.
Management raised full-year guidance, now expecting 8% to 9% organic sales growth versus the prior 5% to 7%, and increased its earnings outlook, reflecting improved visibility into customer demand.
Overall, the updated guidance reinforces WCC’s positioning as a key supplier to AI-driven electrical and data infrastructure growth.
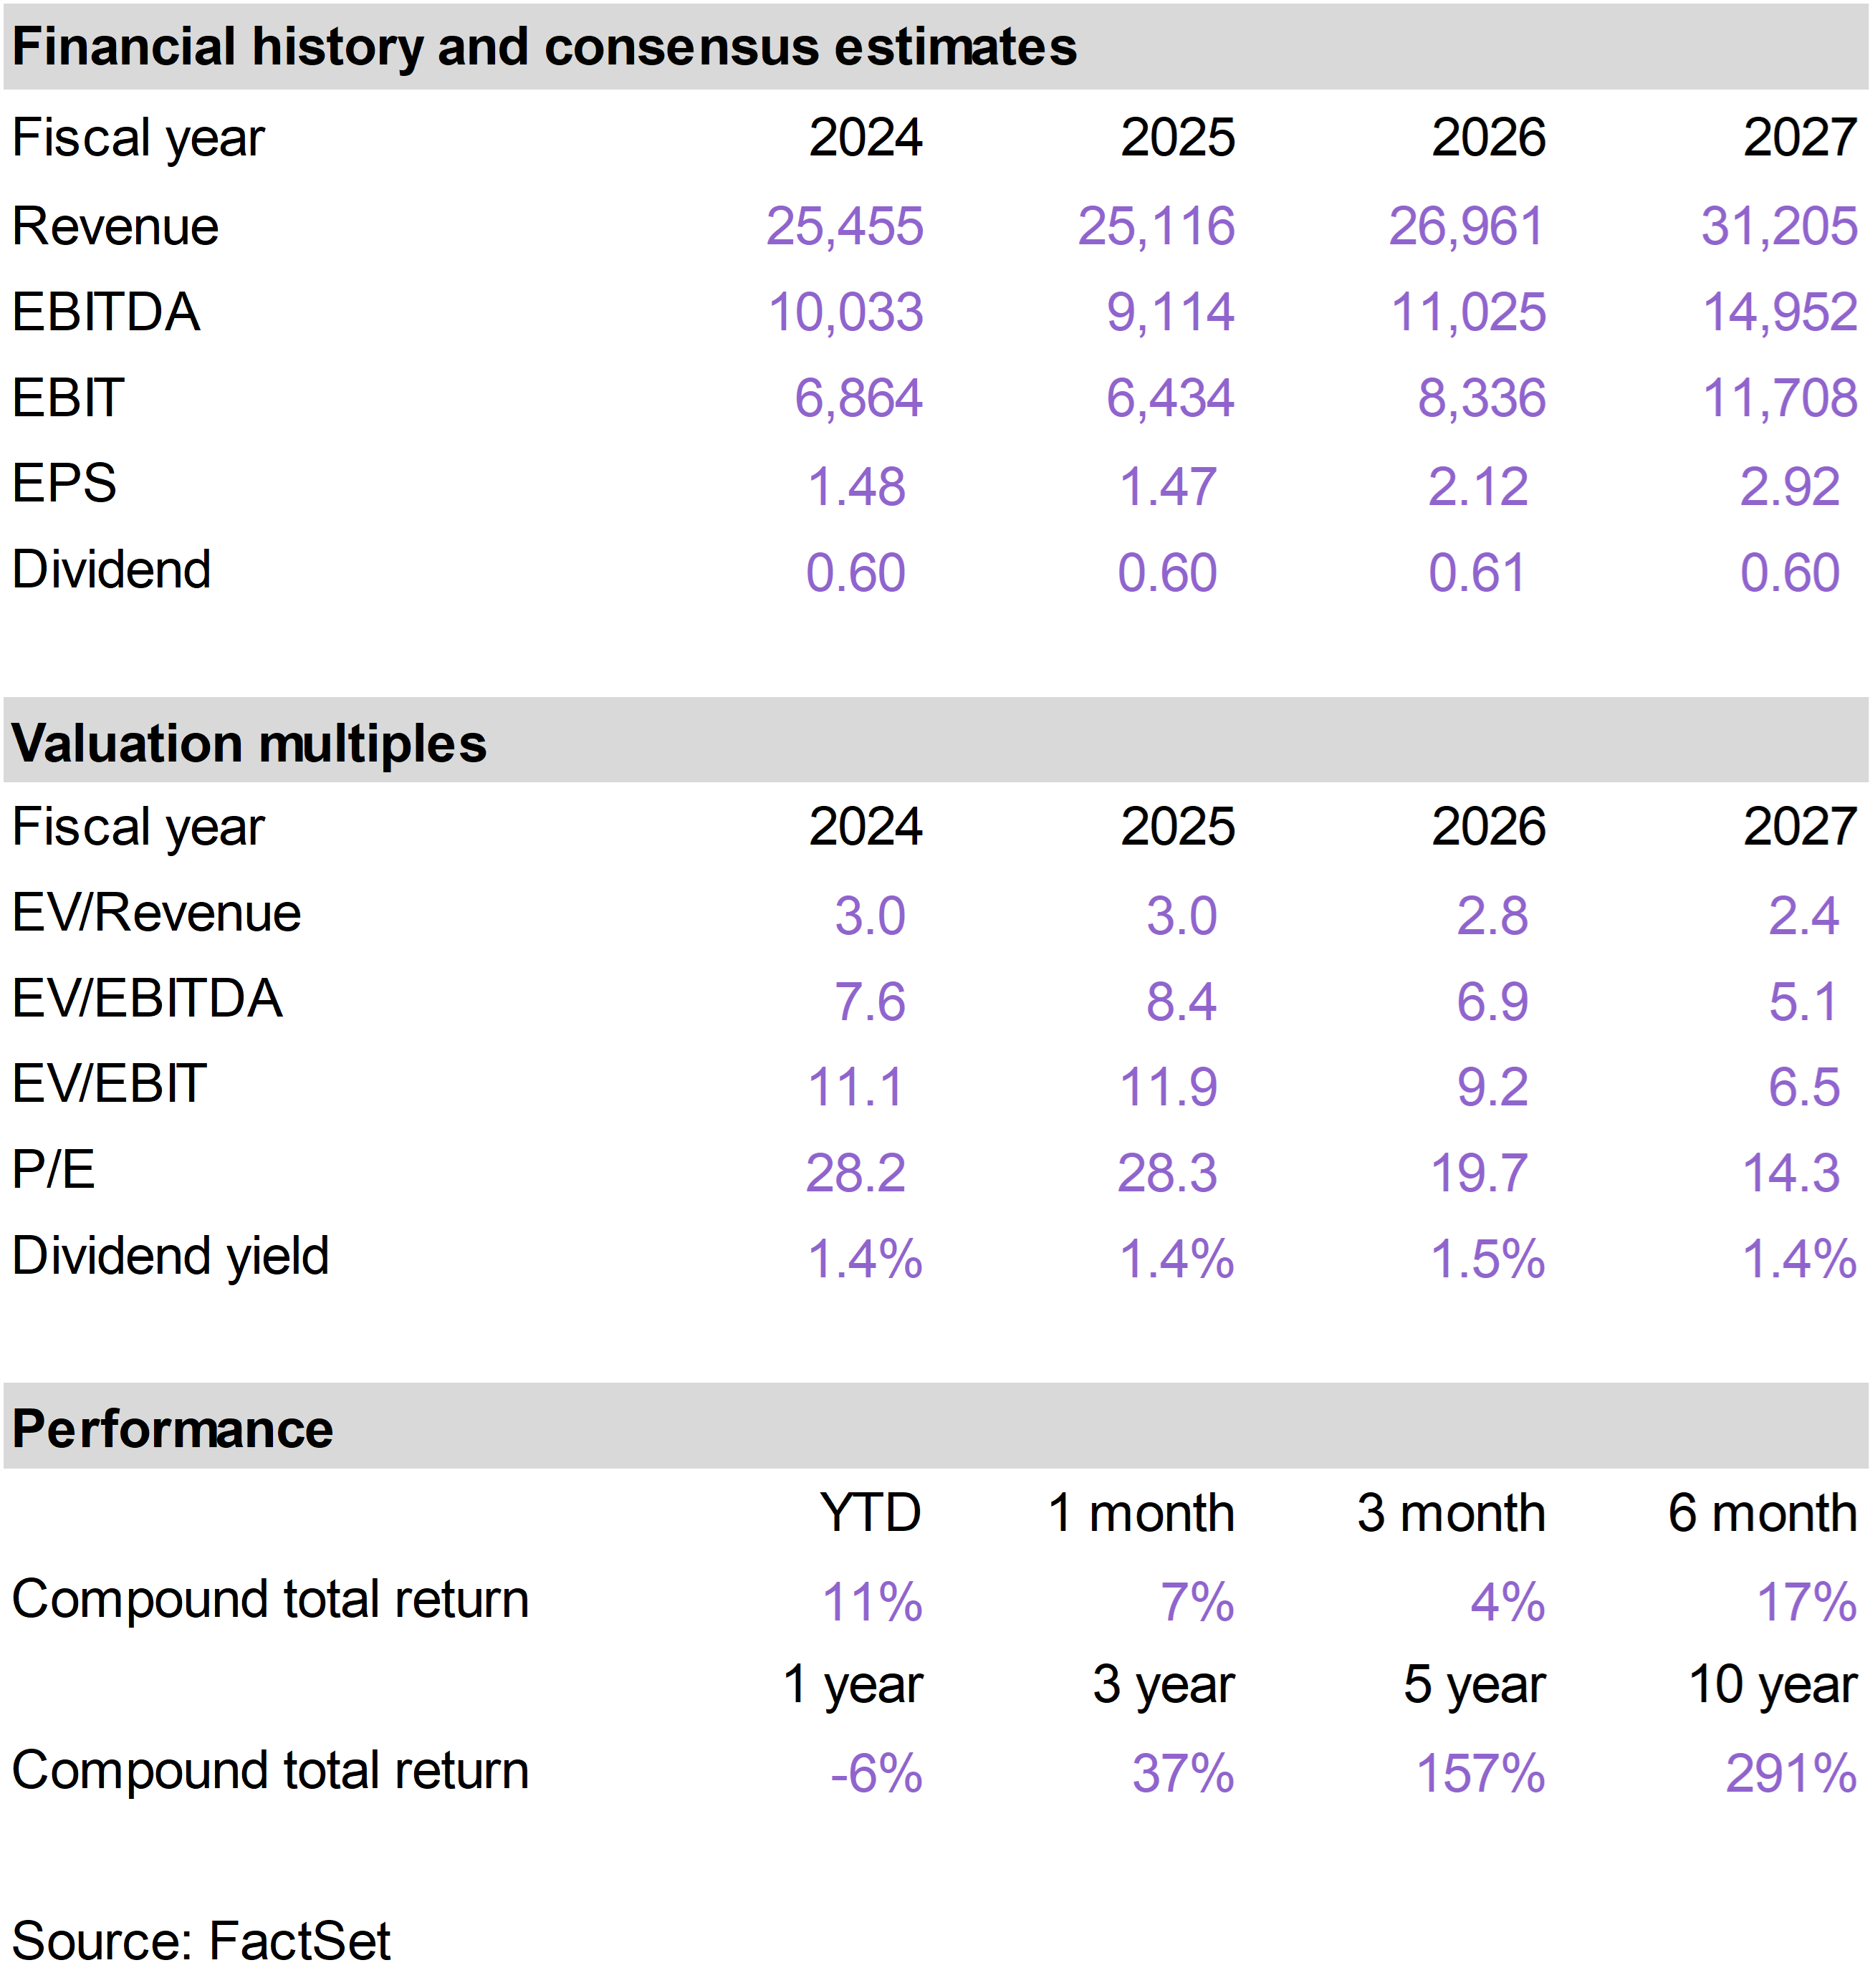
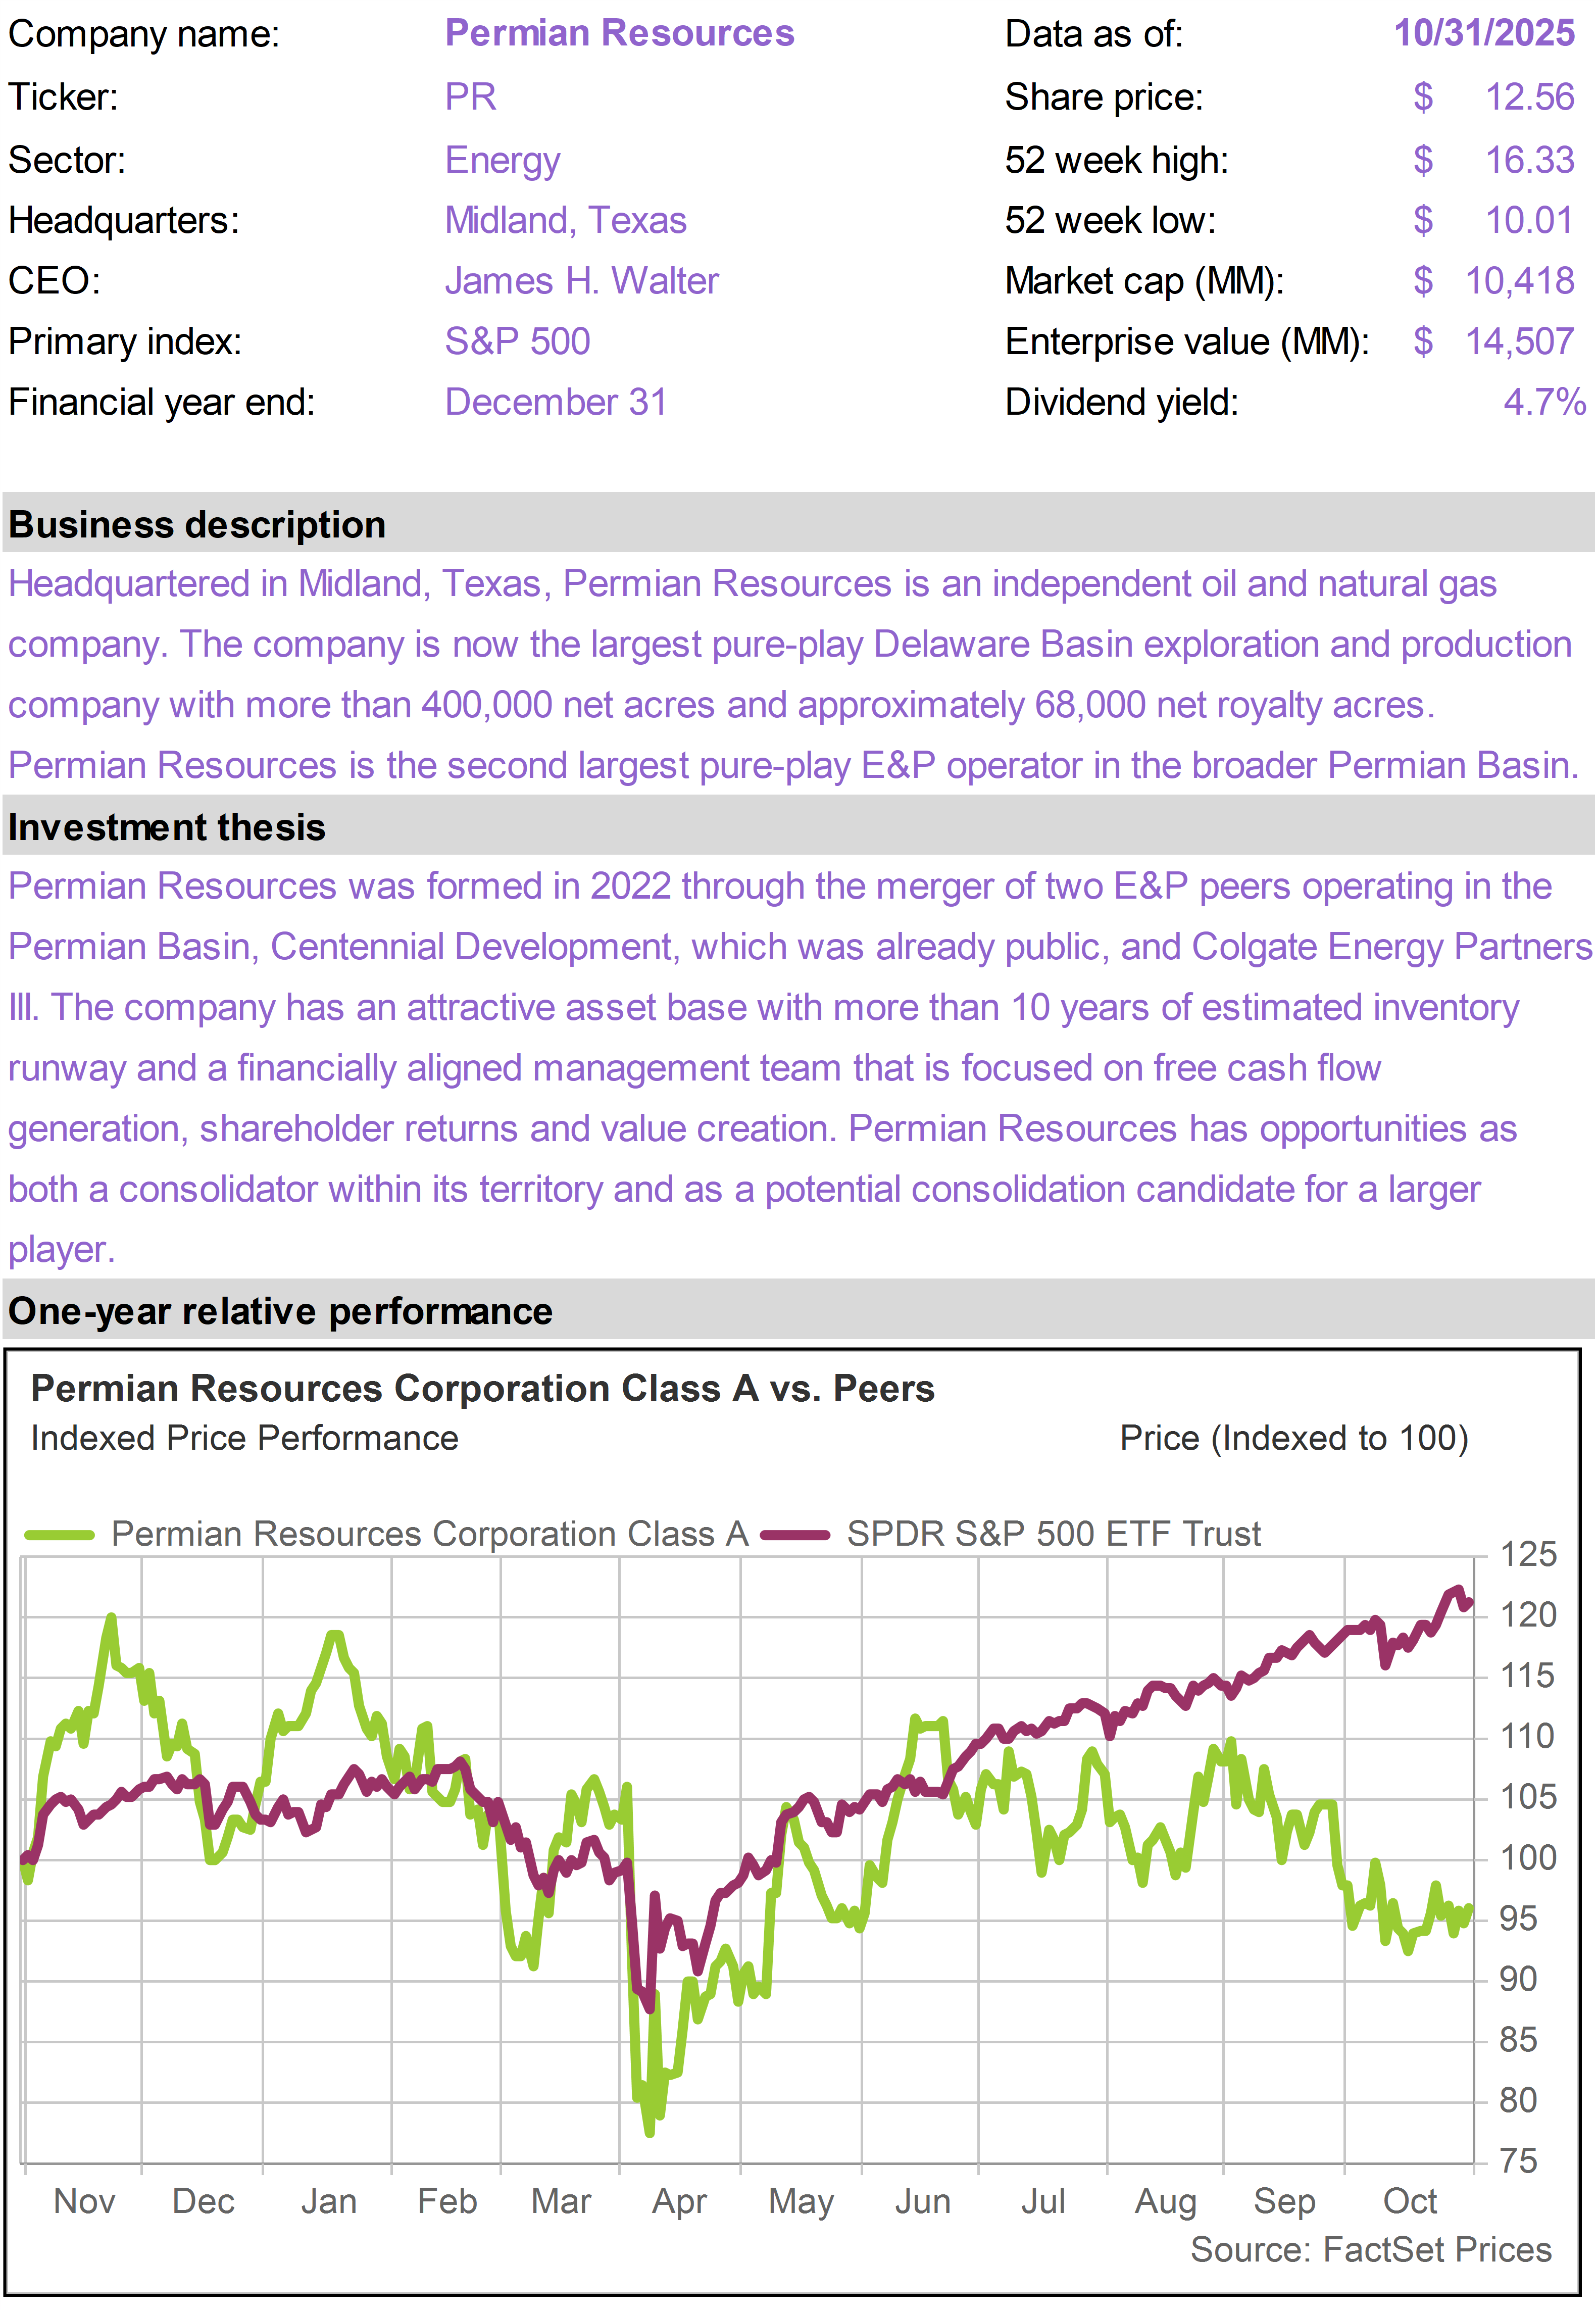
Shares of FCX recovered following the accident at the company’s large copper mining facility in Indonesia. As we indicated last month, the incident, while a setback that reduces near-term cash flow, does not alter the long-term value of the mine.
FCX reported solid third quarter earnings results in October that reassured the market that the problem in Indonesia is being addressed, noting that they have approximately $1 billion in business interruption insurance to cover immediate production losses.
We continue to like FCX as a leading global producer of copper and, to a lesser but still material extent, gold. |
|
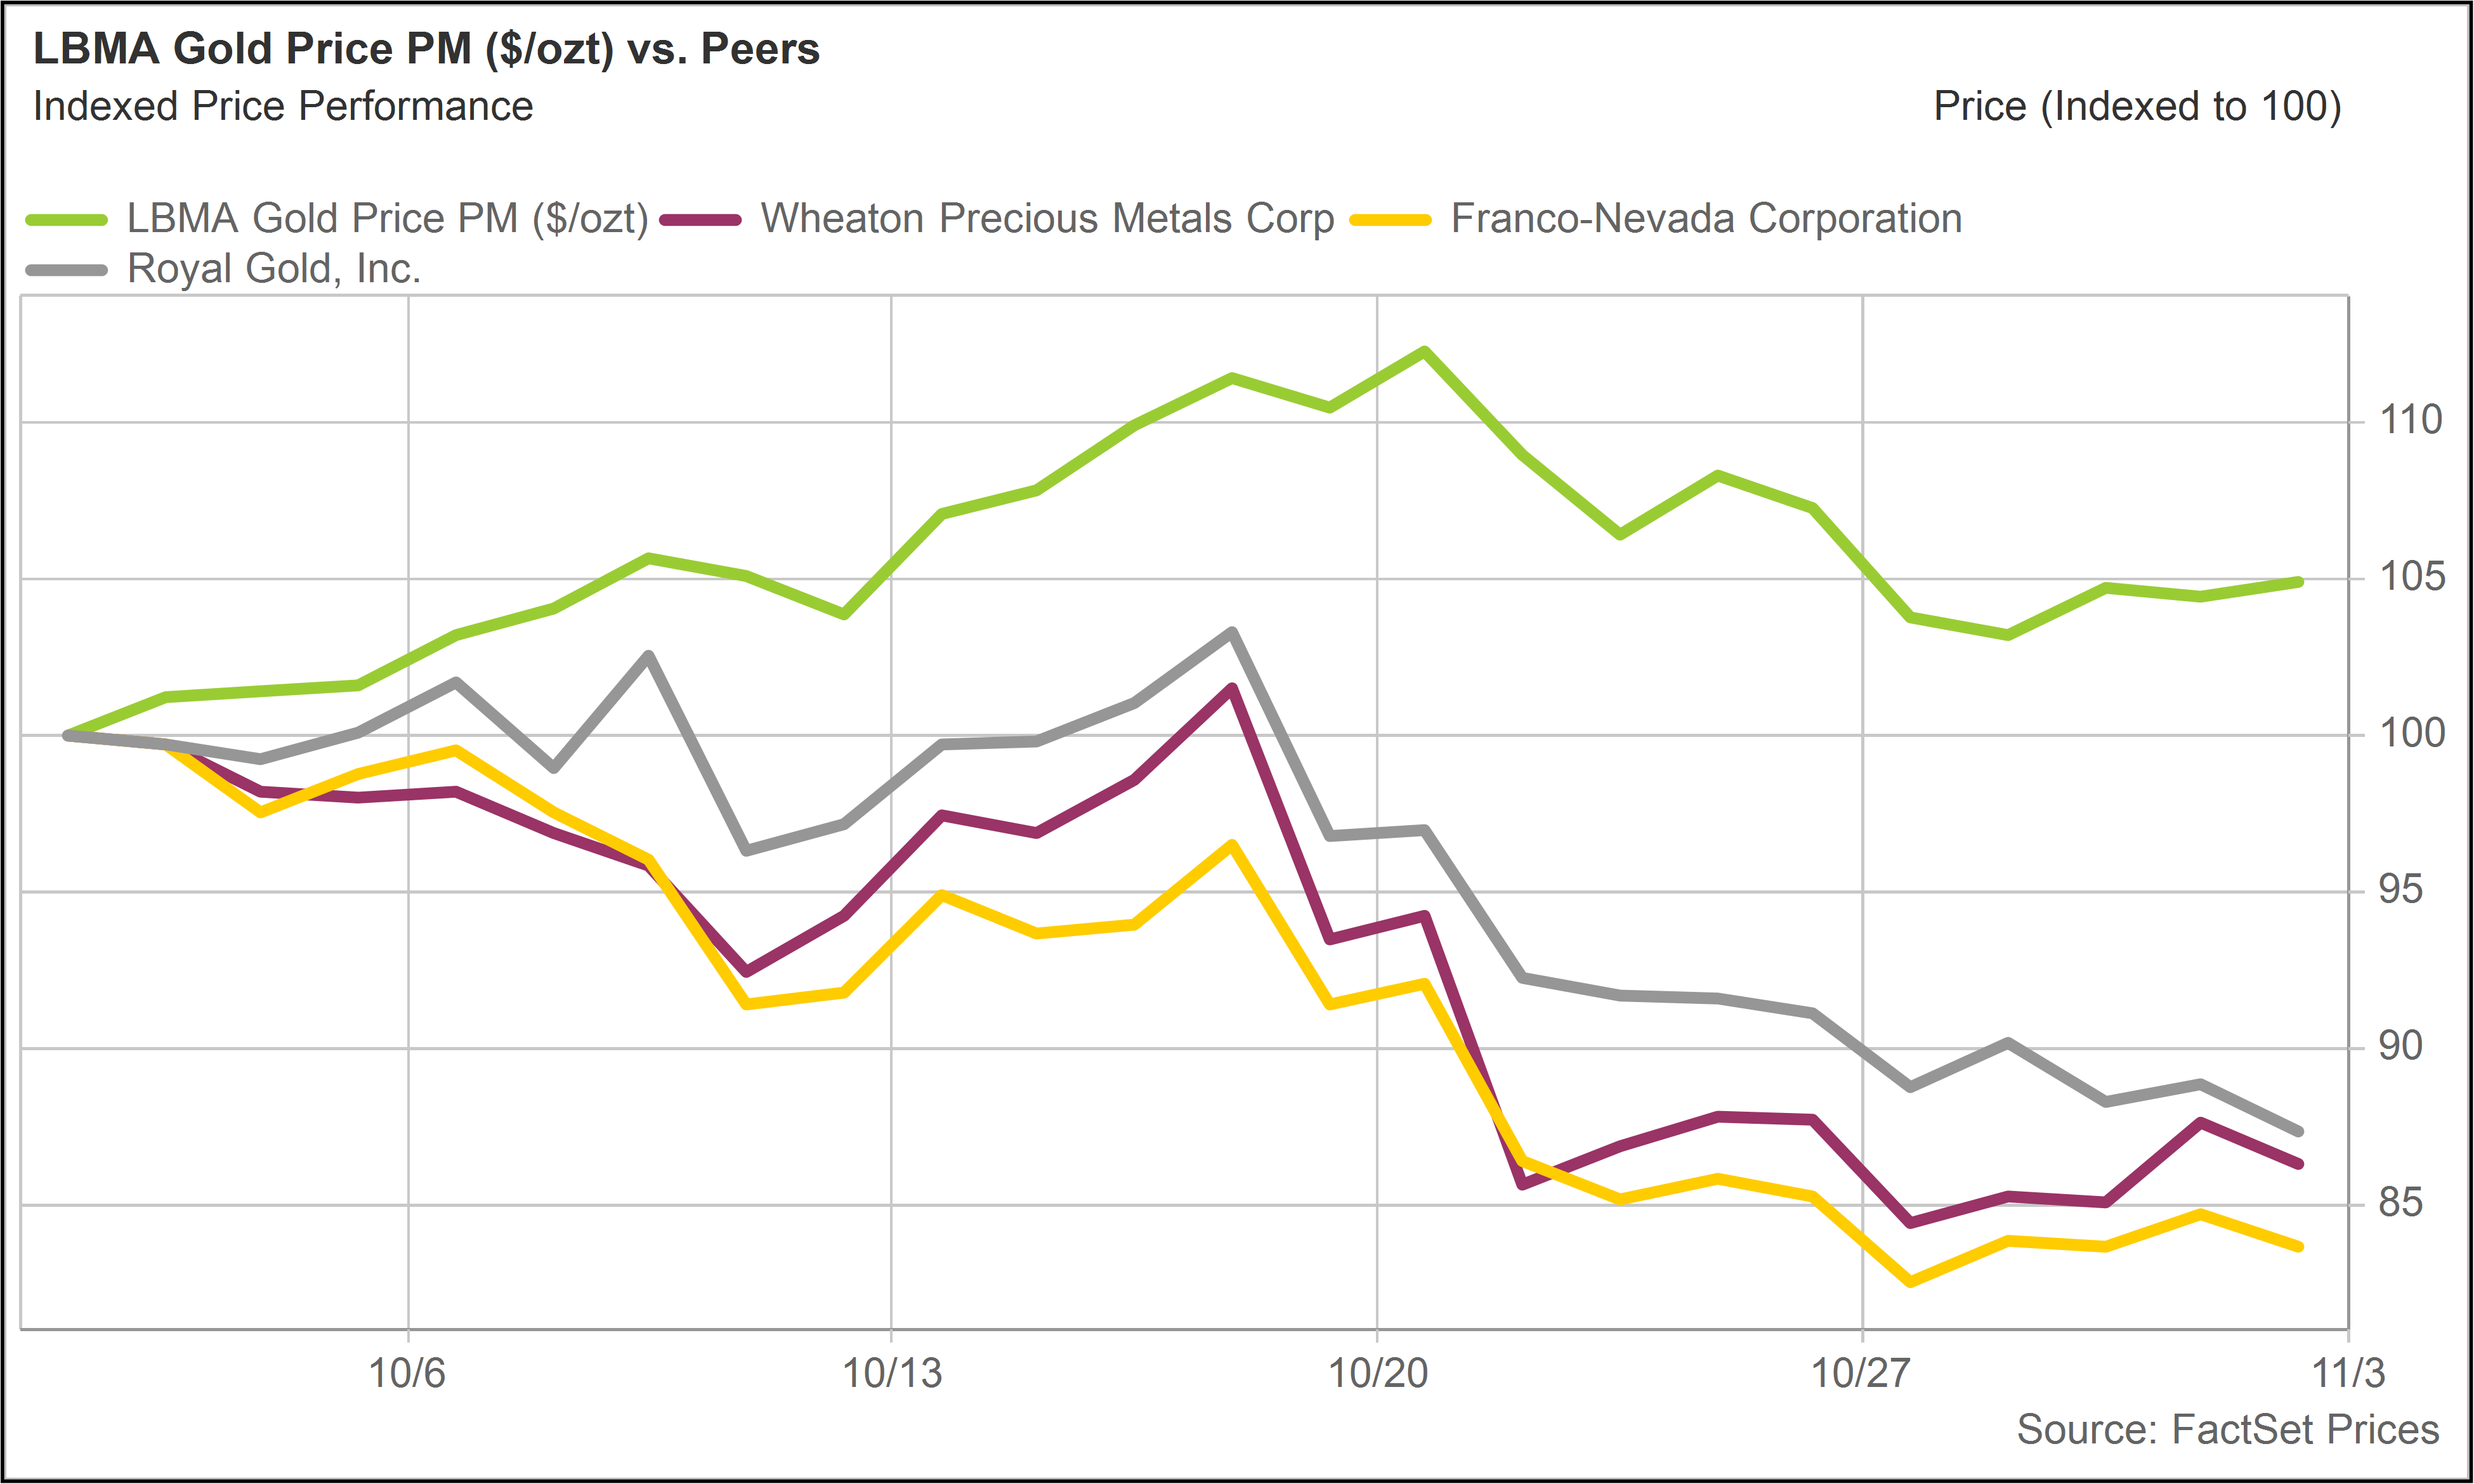
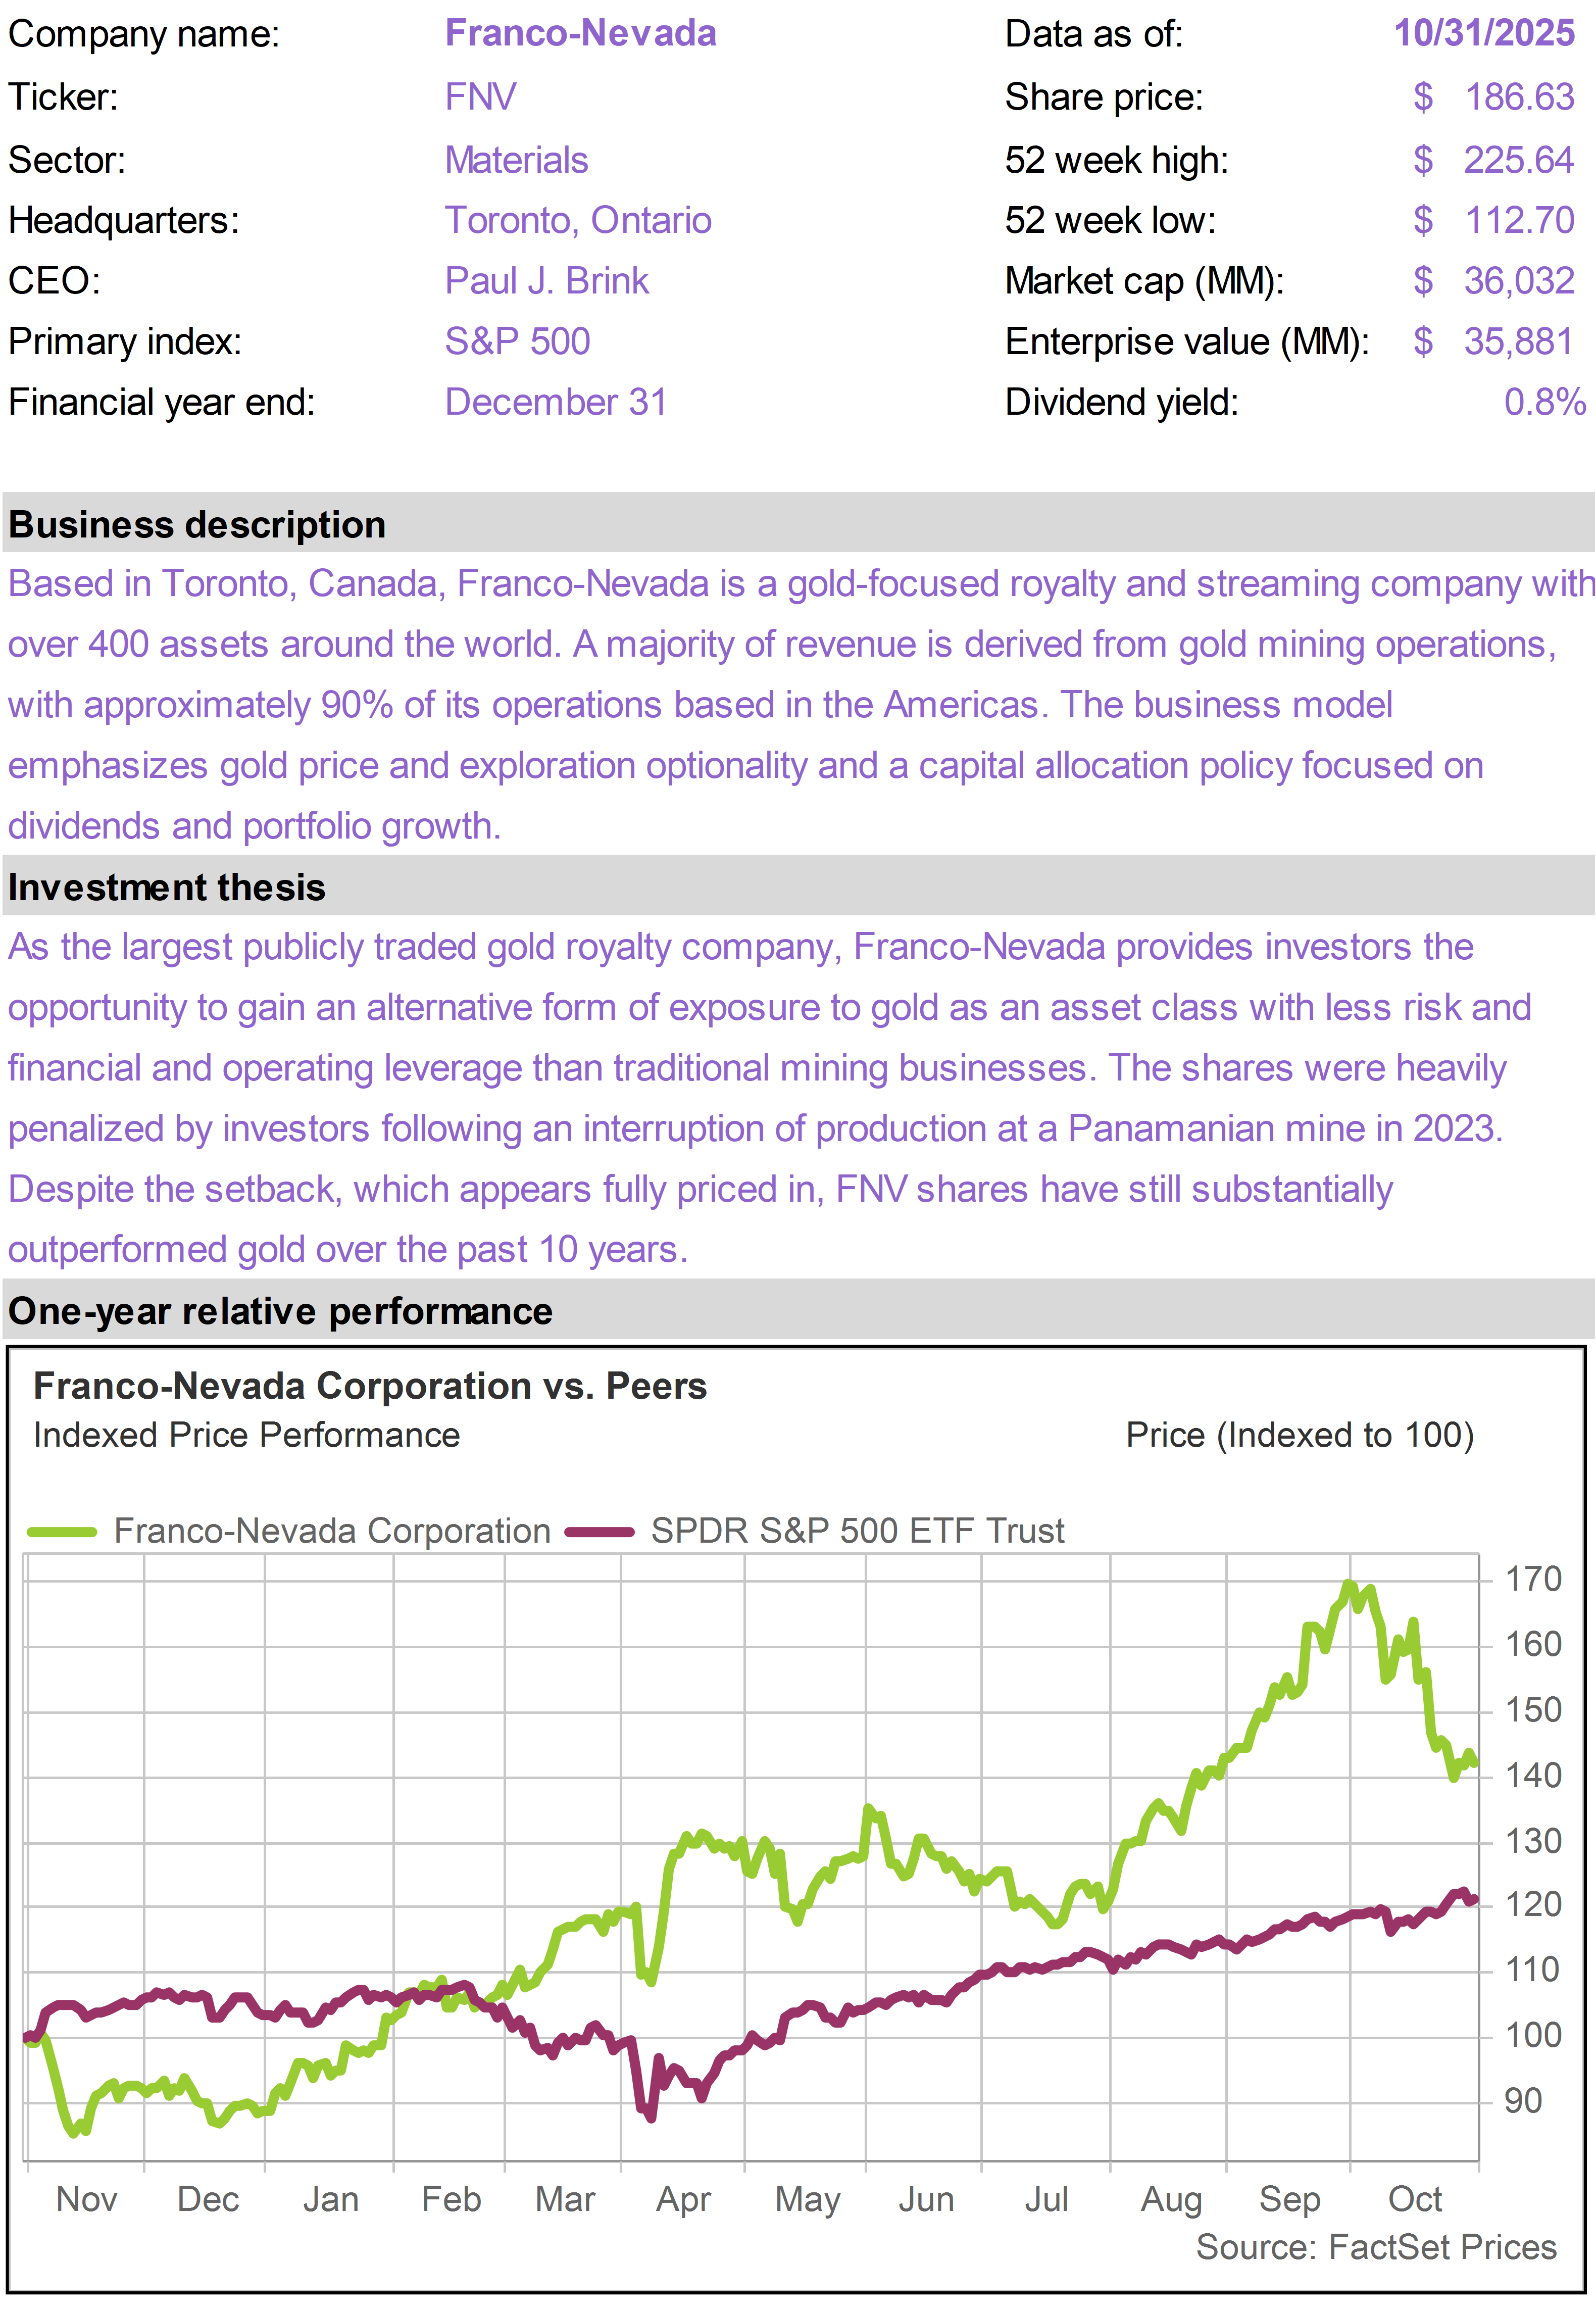
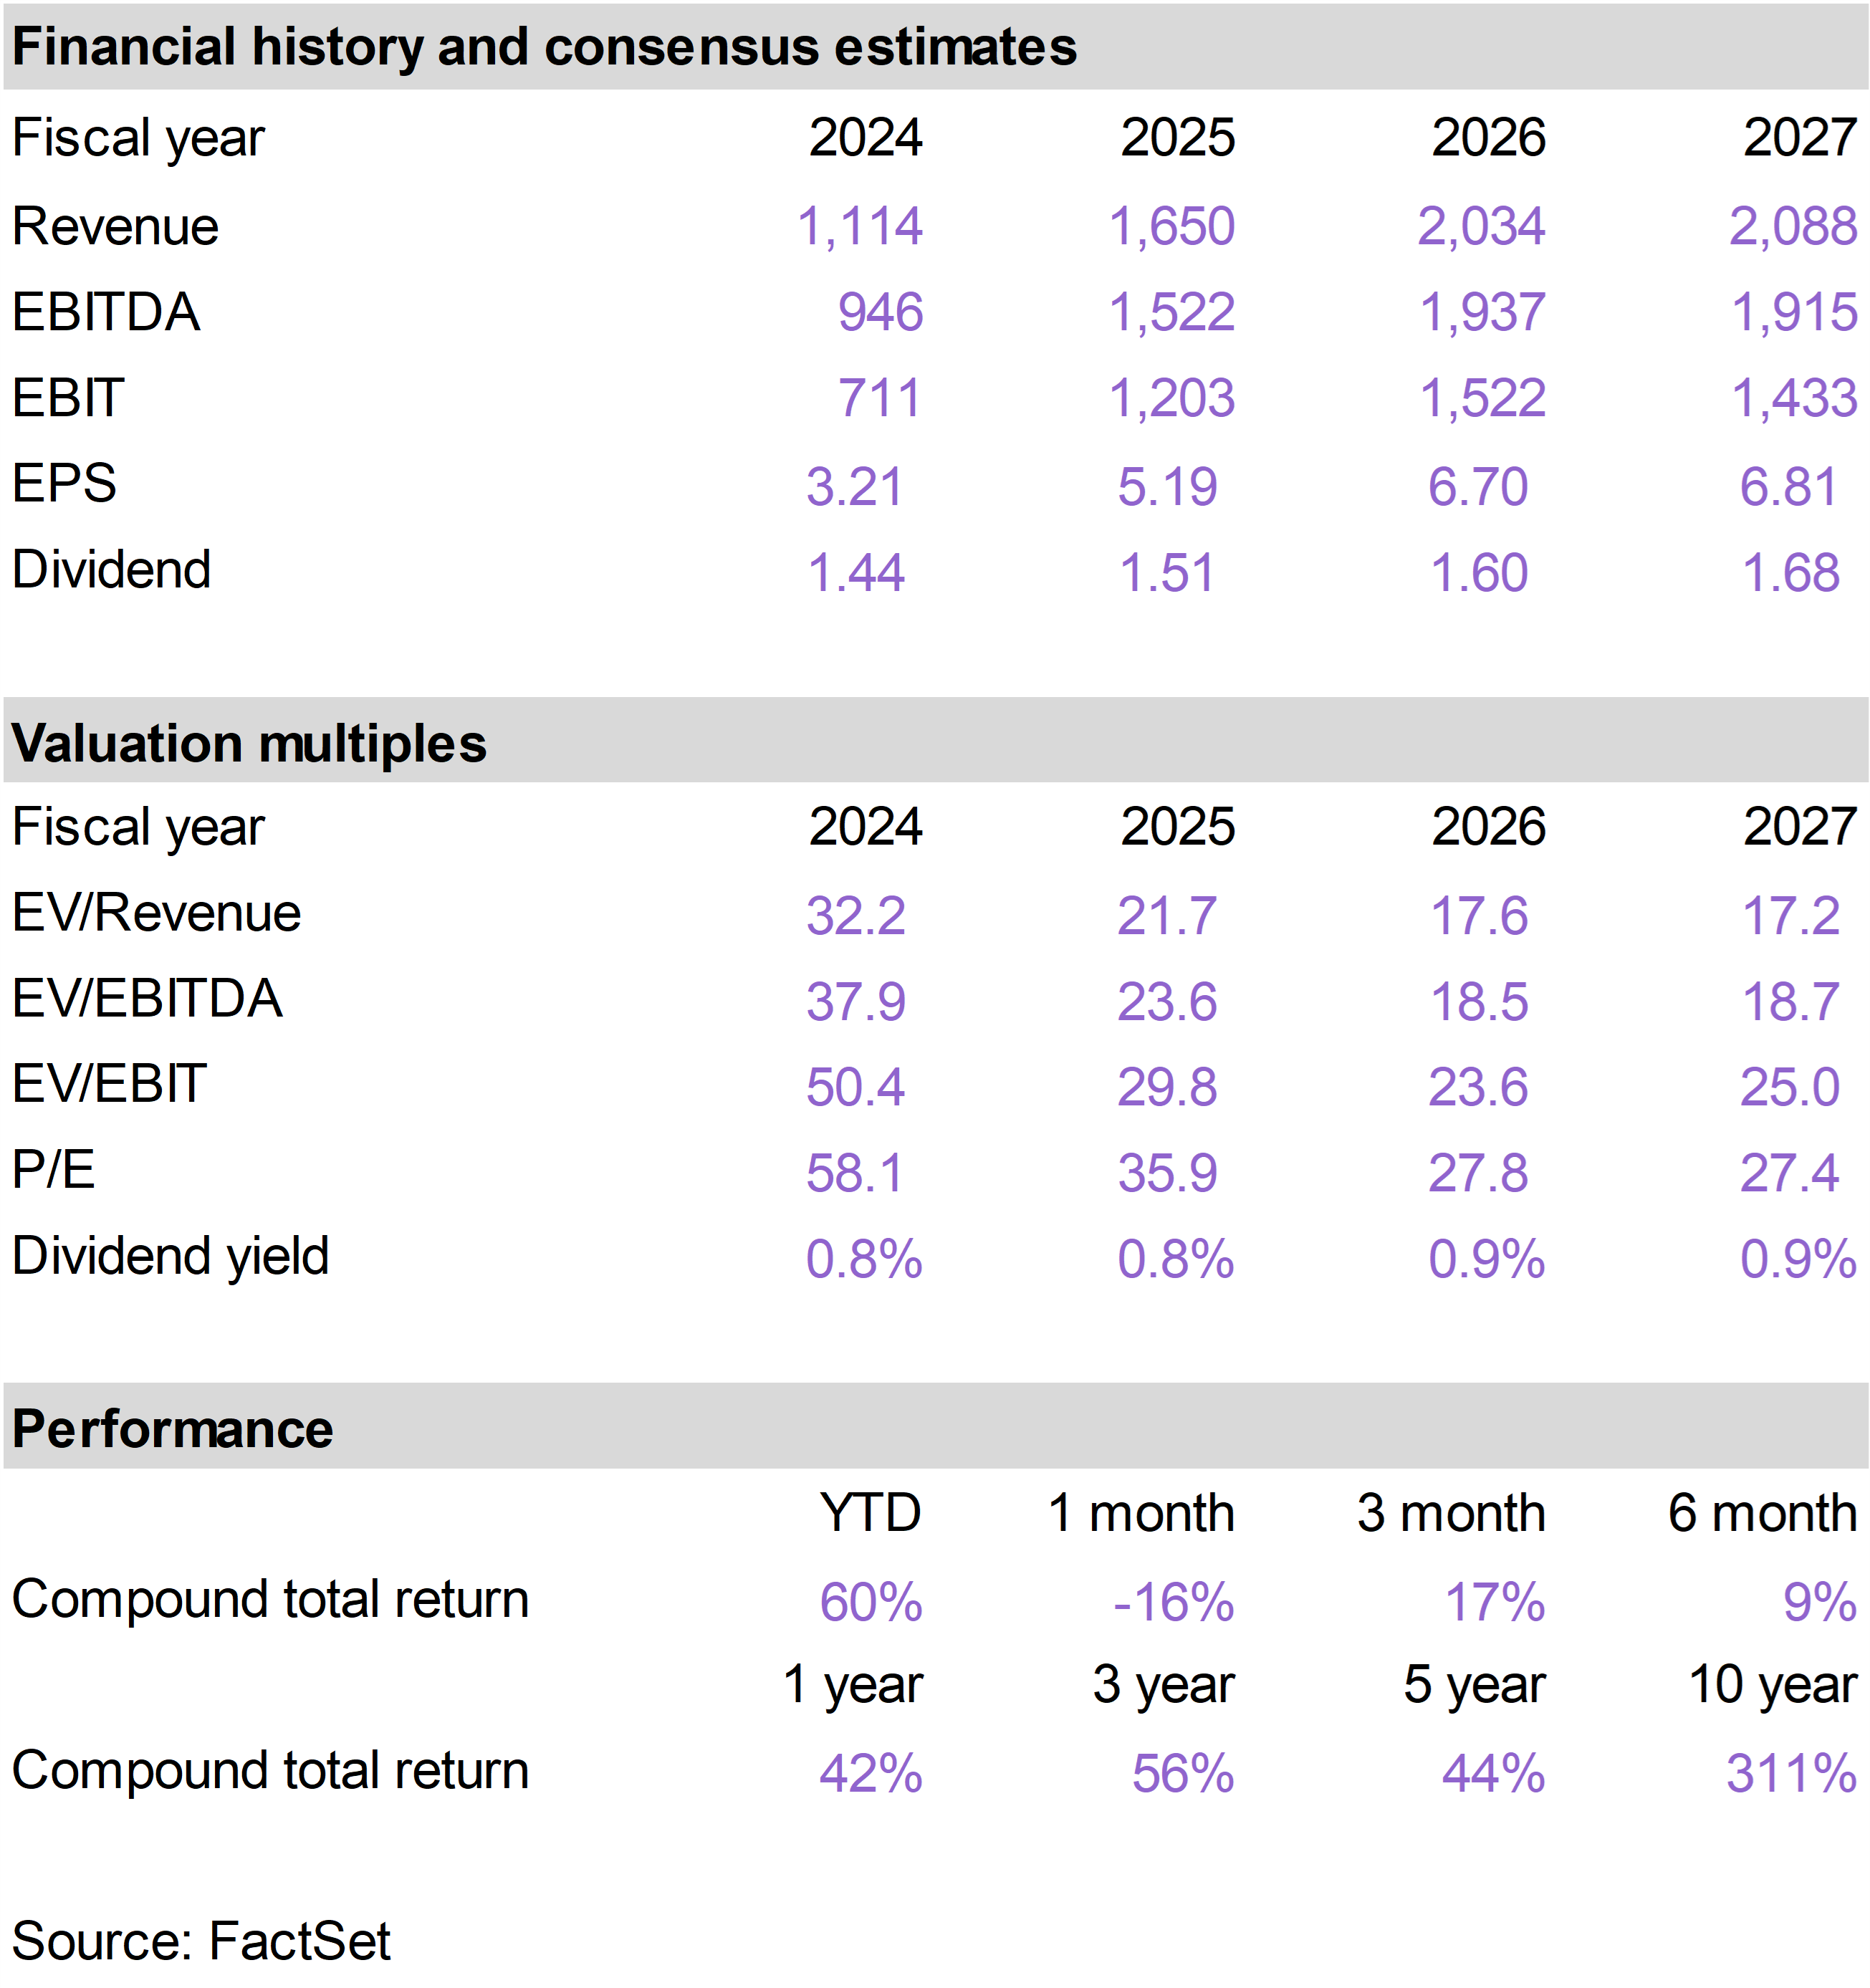
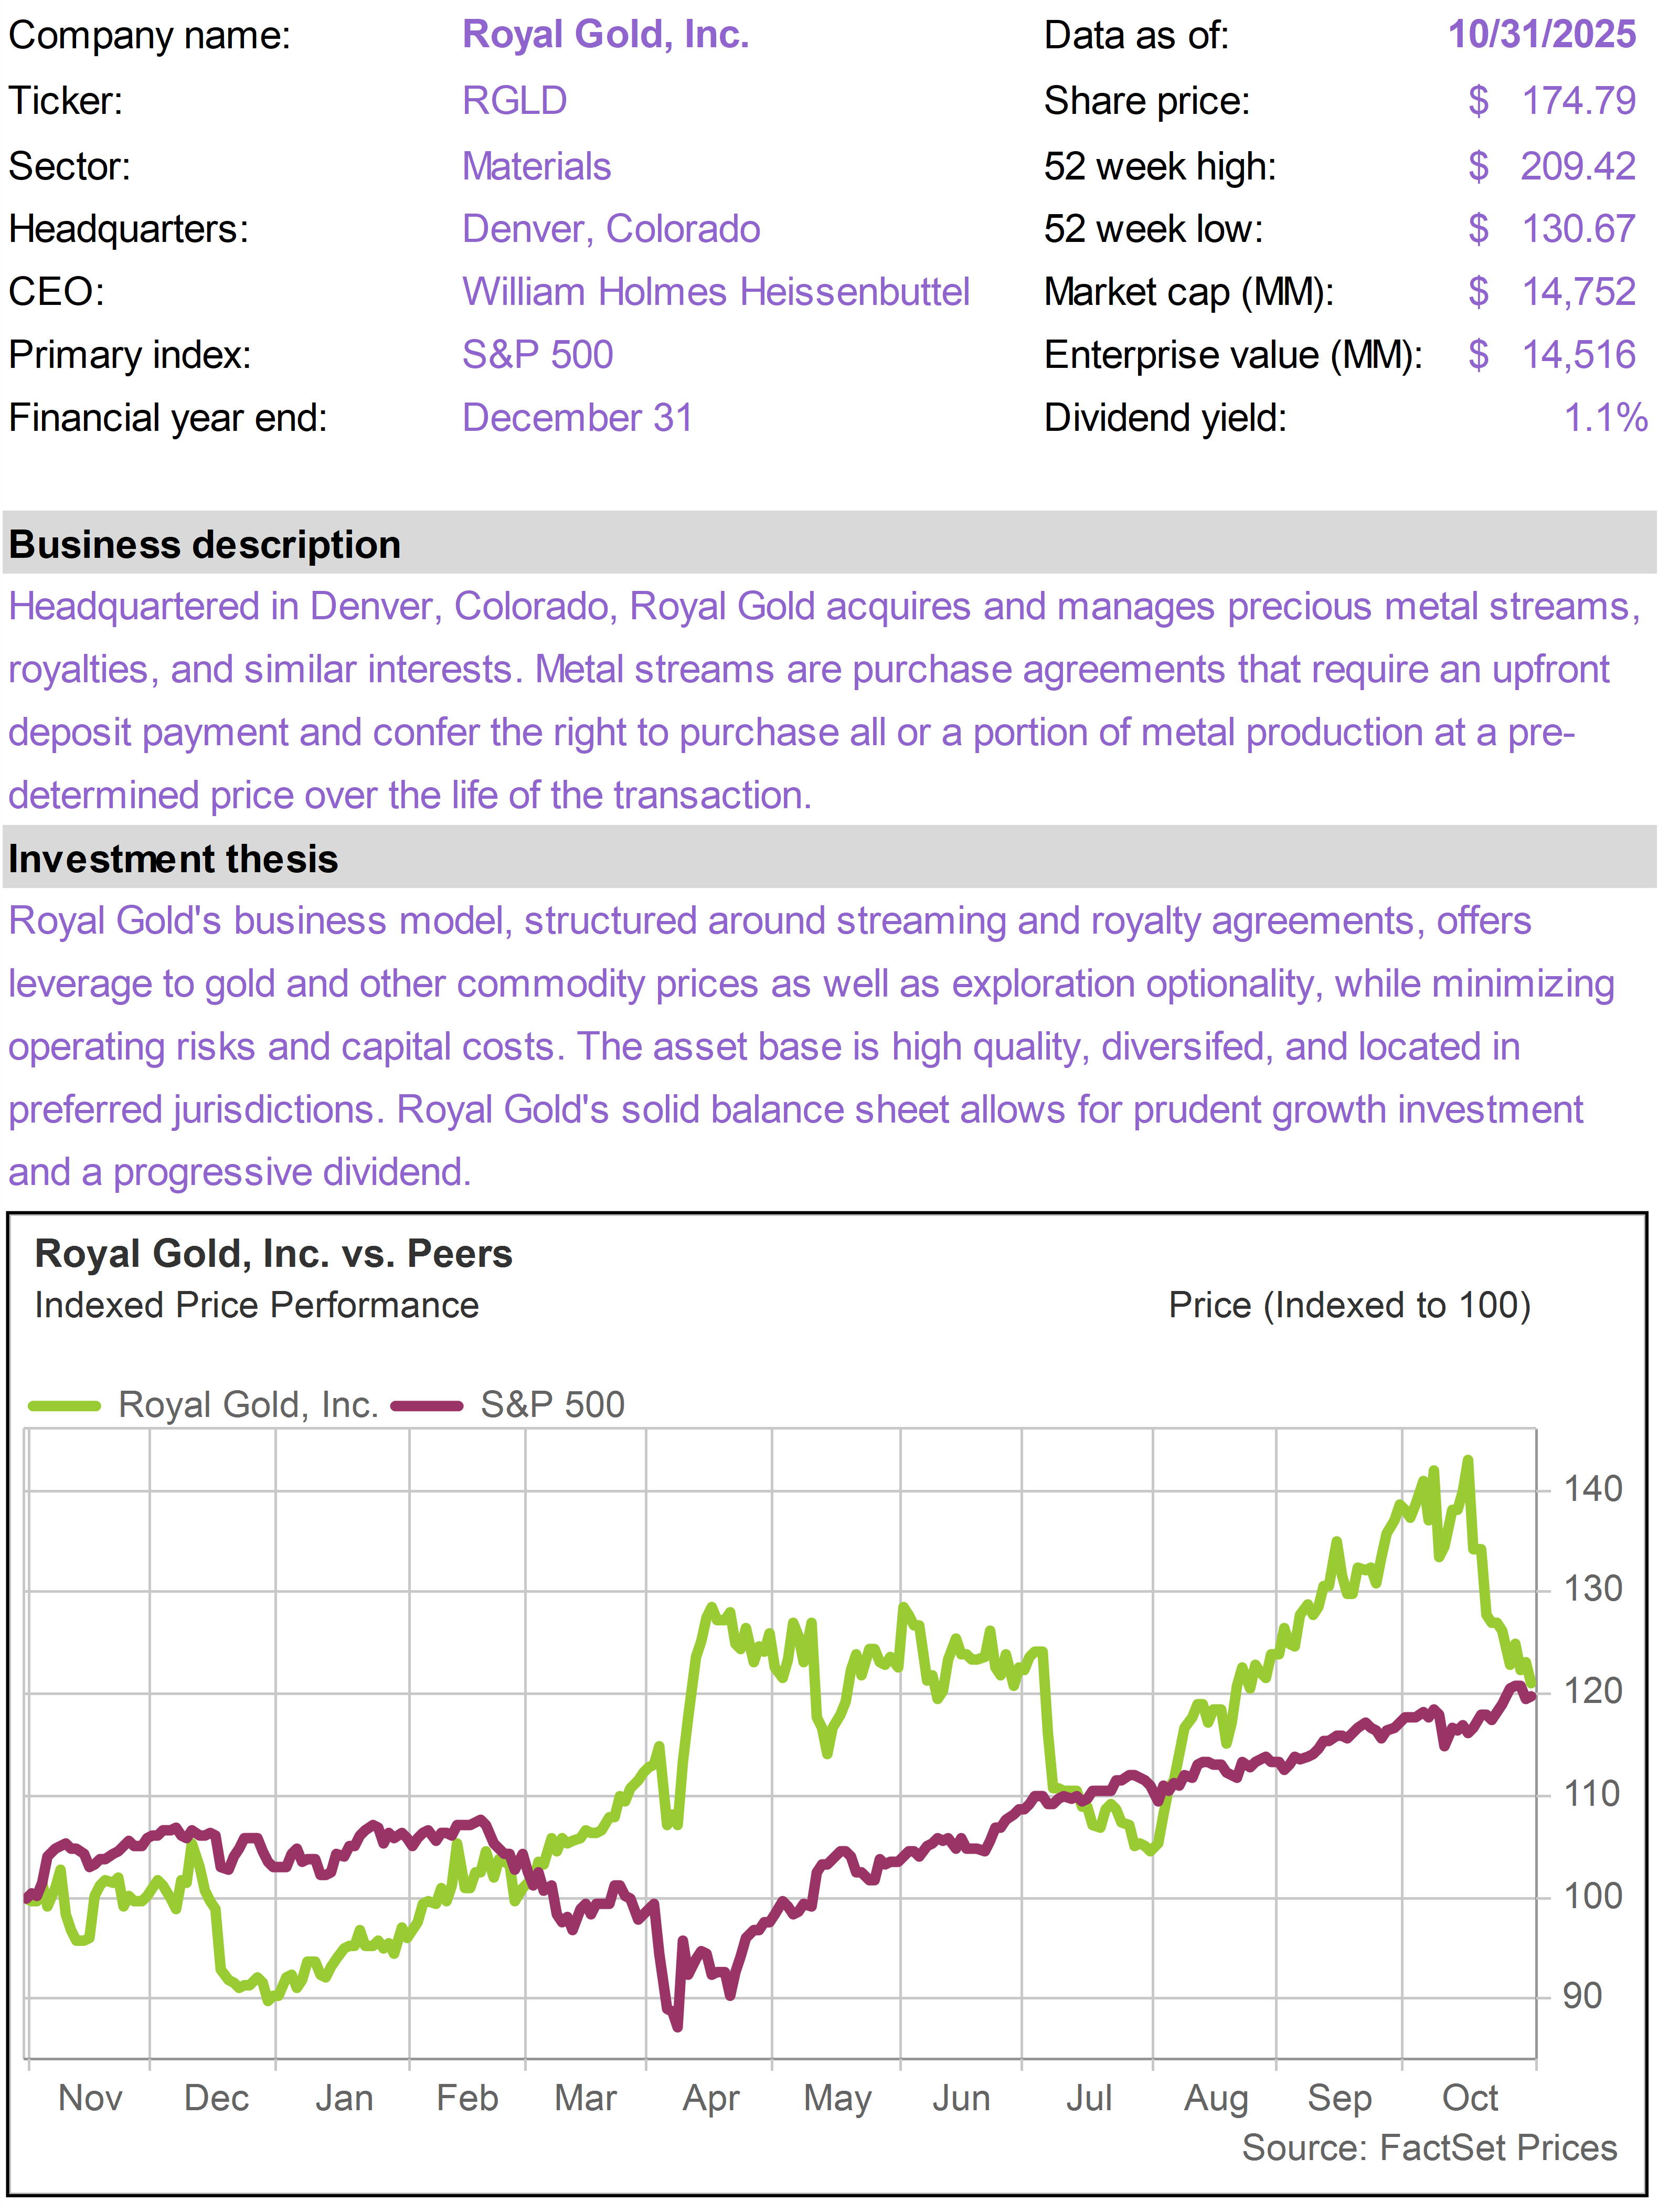
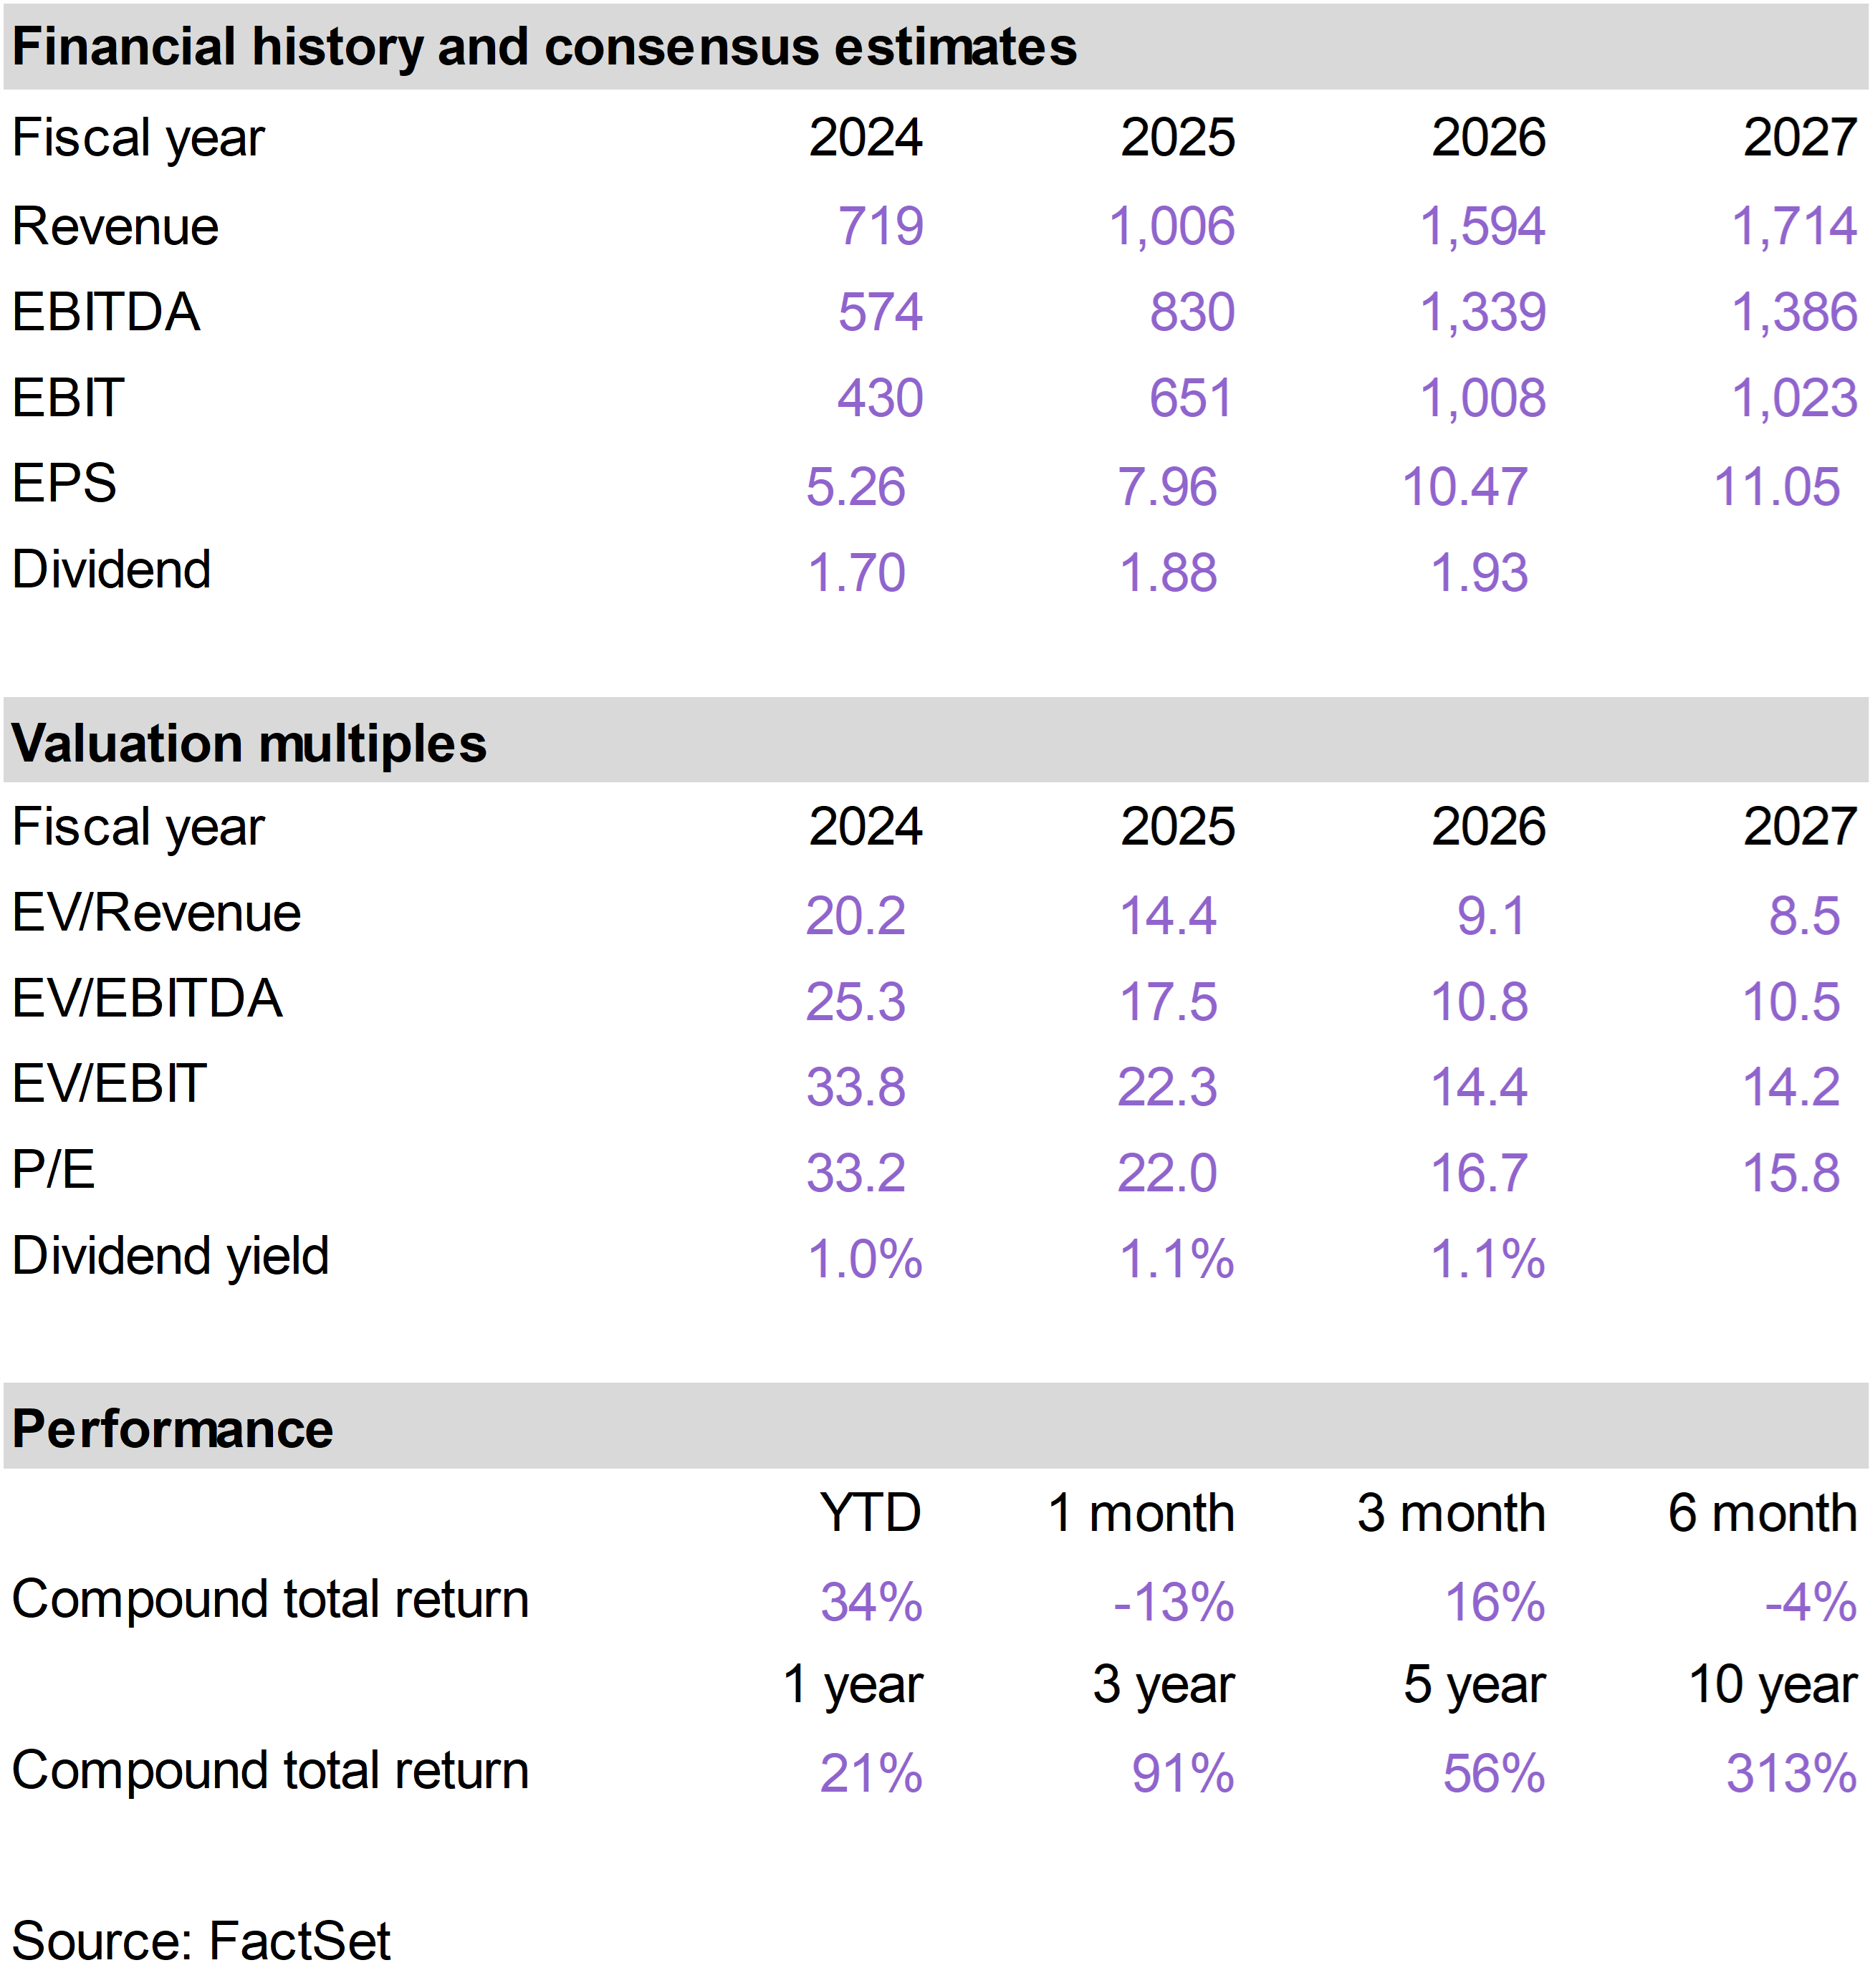
| October was a volatile month for gold. Gold surged through $4,300 per ounce in the middle of the month but then retreated sharply to close just over $4,000.
Although gold was up marginally for the month, gold-related stocks, including the gold streaming plays within the portfolio—FNV, WPM and Royal Gold (RGLD)—sold off at the end of the month. |
|
|
| Gold vs. WPM, FNV, RGLD(Total Return - October 2025) |
|
| We have no particular explanation for the relatively poor performance, other than technical factors in an unusually volatile adjustment period. Going forward, we expect these gold-related stocks to offer amplified returns on the gold price, as they have throughout the year.
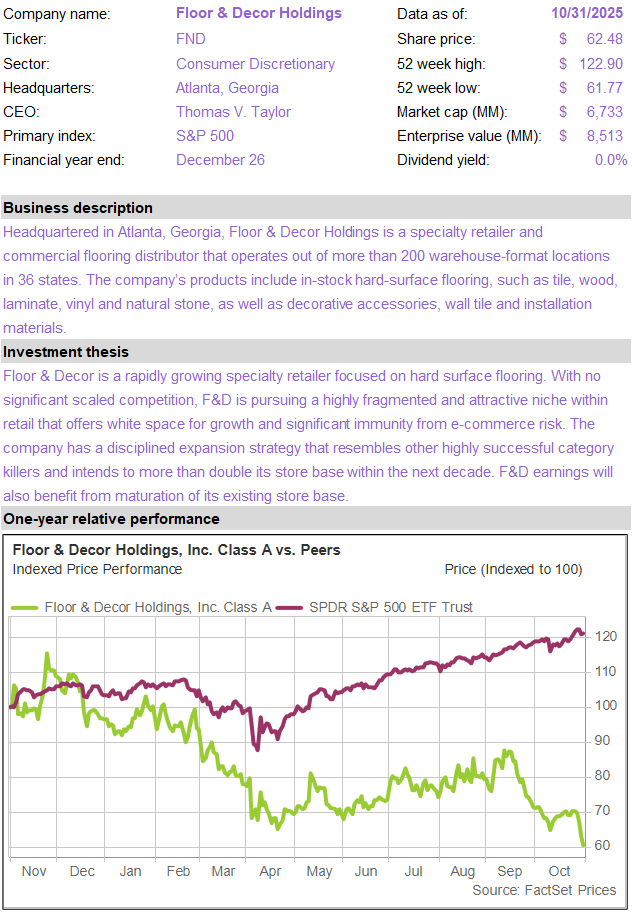
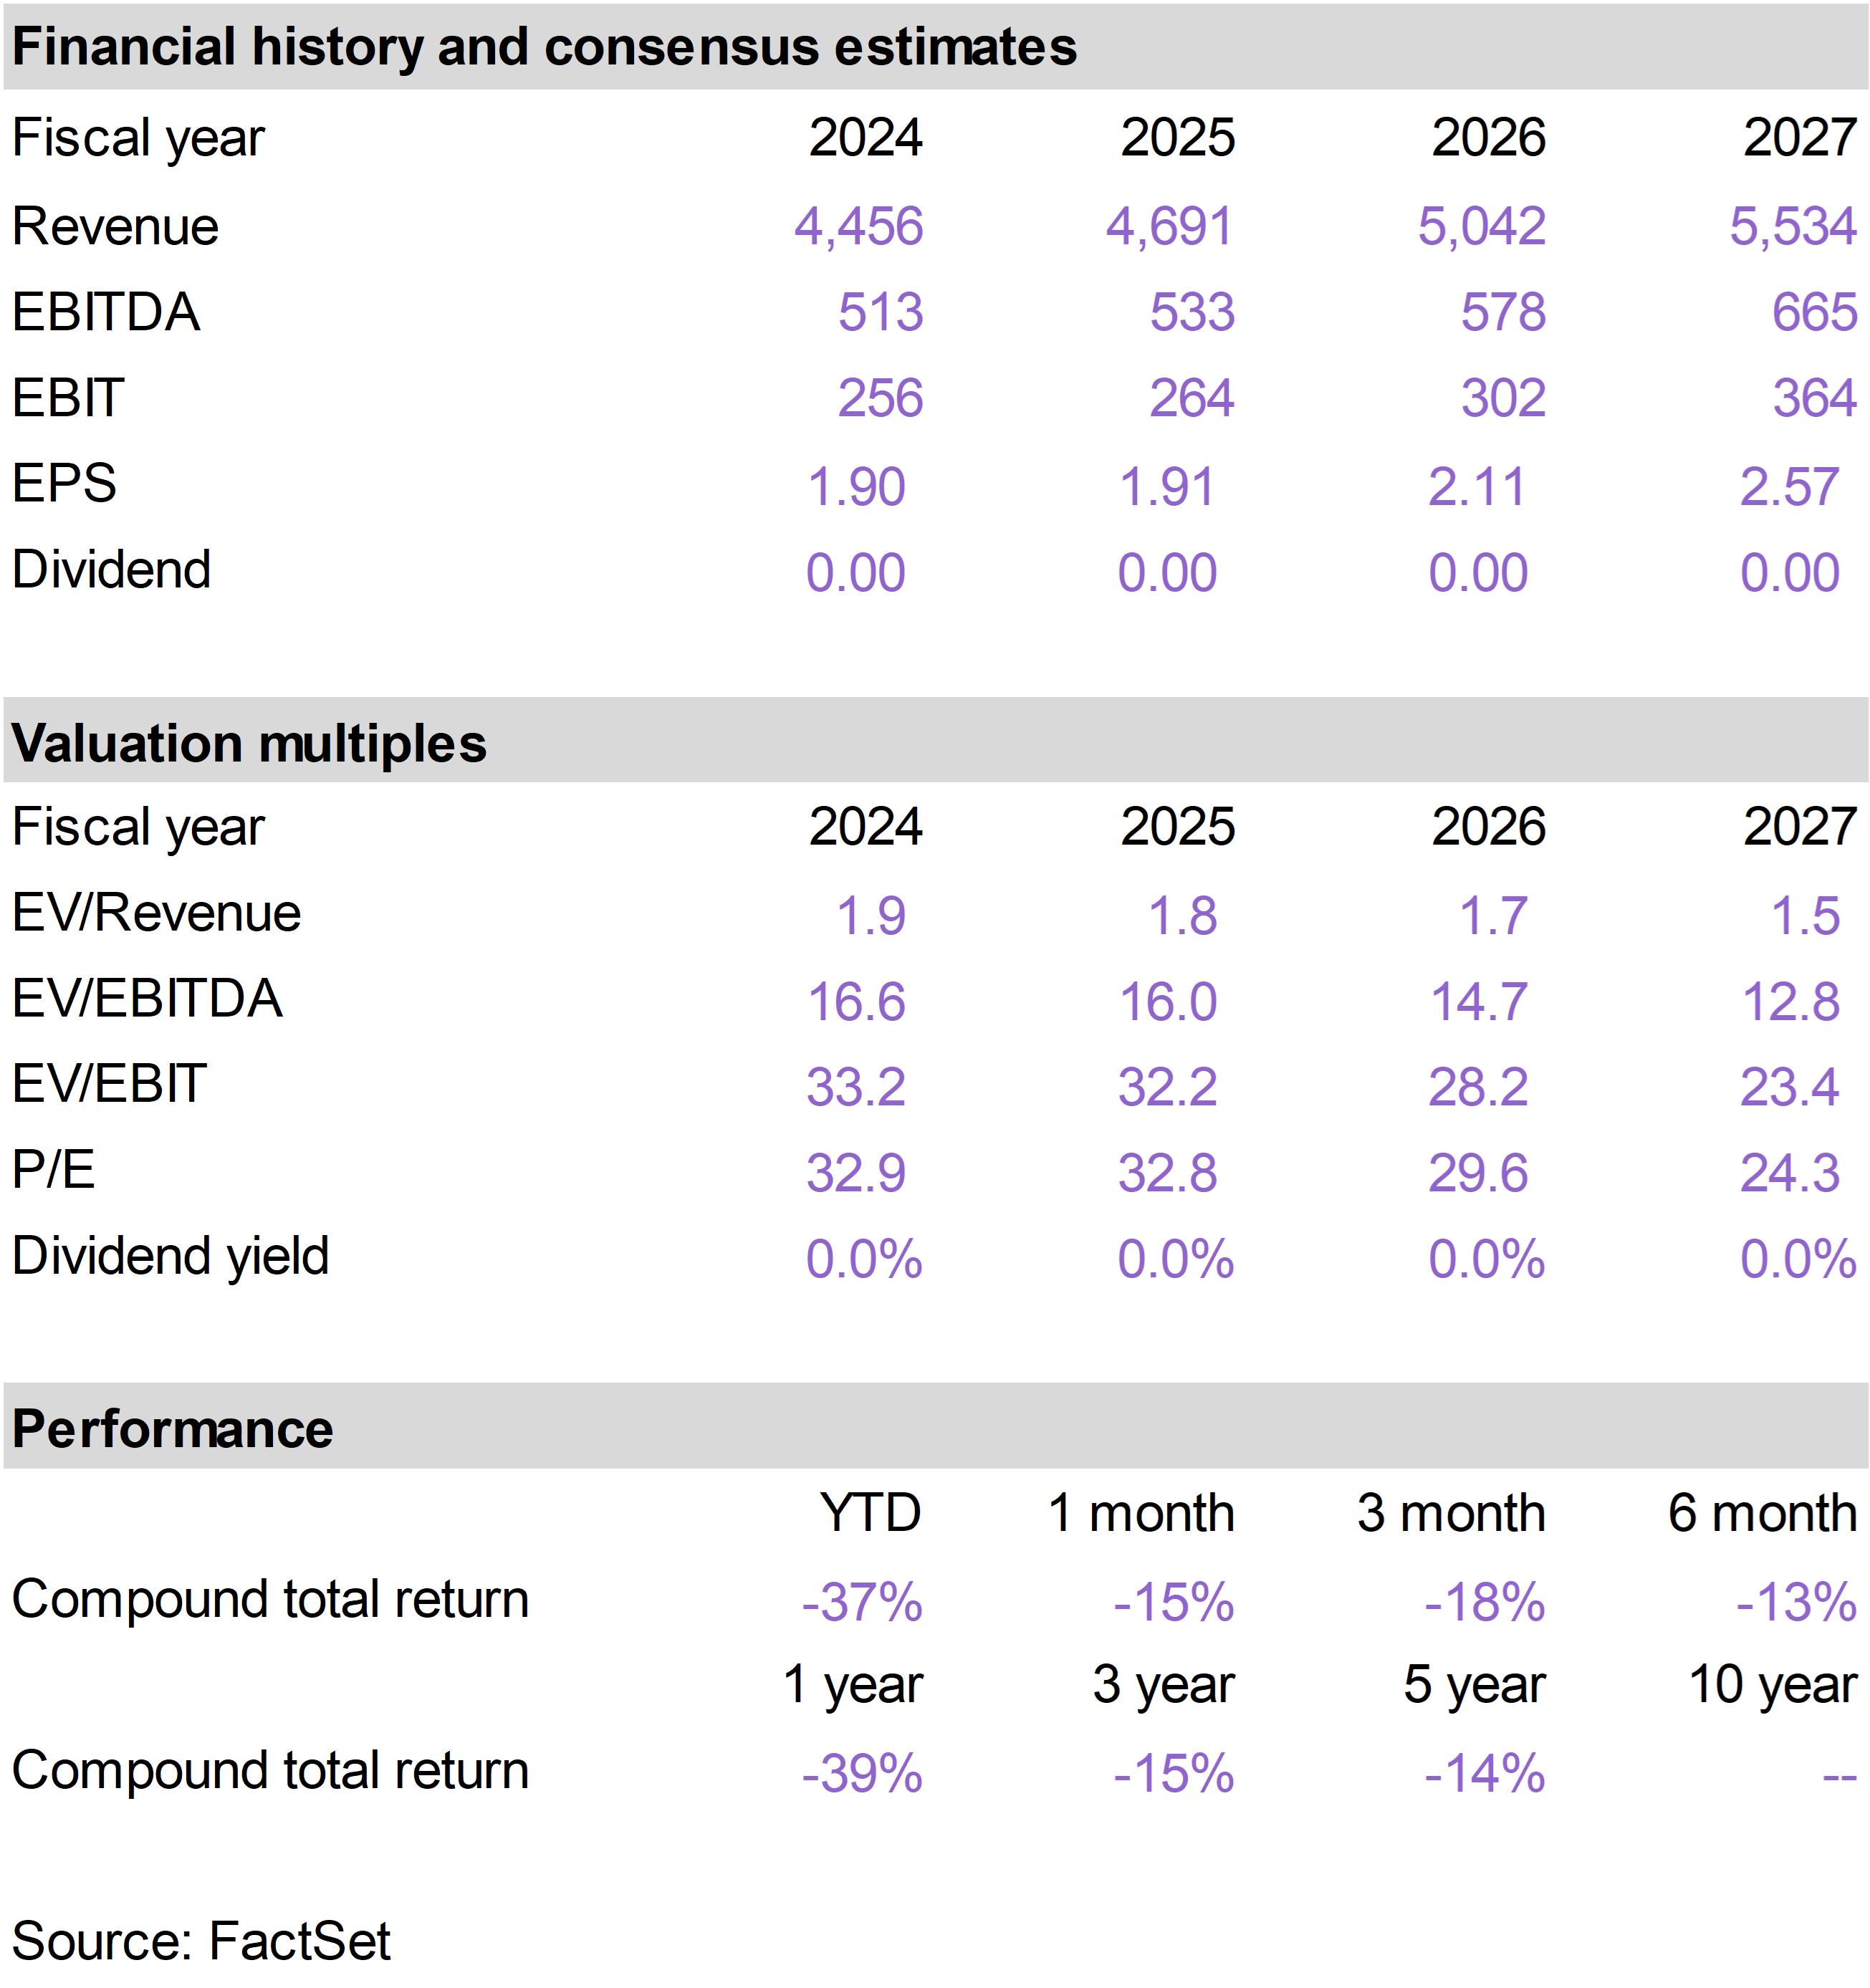
FND performed poorly in October as investors shied away from housing related stocks, which are highly sensitive to perceptions of interest rate cuts. FND shares responded negatively to the Fed meeting and Powell’s comment that an additional rate cut was not guaranteed.
Although FND’s third quarter earnings in October surpassed expectations, the company continues to face near-term headwinds tied to the slowdown in the existing home sales market, which remains especially weak in key regions like Texas and Florida.
Comparable sales remain negative, and management expects comps to remain pressured in the fourth quarter as the company laps last year’s hurricane-related demand spike. However, the company has demonstrated strong cost discipline, expanding operating margins over the past four quarters despite negative comps, which is impressive for a fixed-cost-heavy store model.
Given these adjustments to the cost structure, management believes that an improvement in existing home sales has the potential to unlock a significant earnings rebound.
We view FND as a strong retailer with excellent long-term expansion prospects. It is struggling now but has the potential to perform quite well into an eventual housing market recovery. |
|
| | |
| | |
| | |
| | | |
|
| | |
|
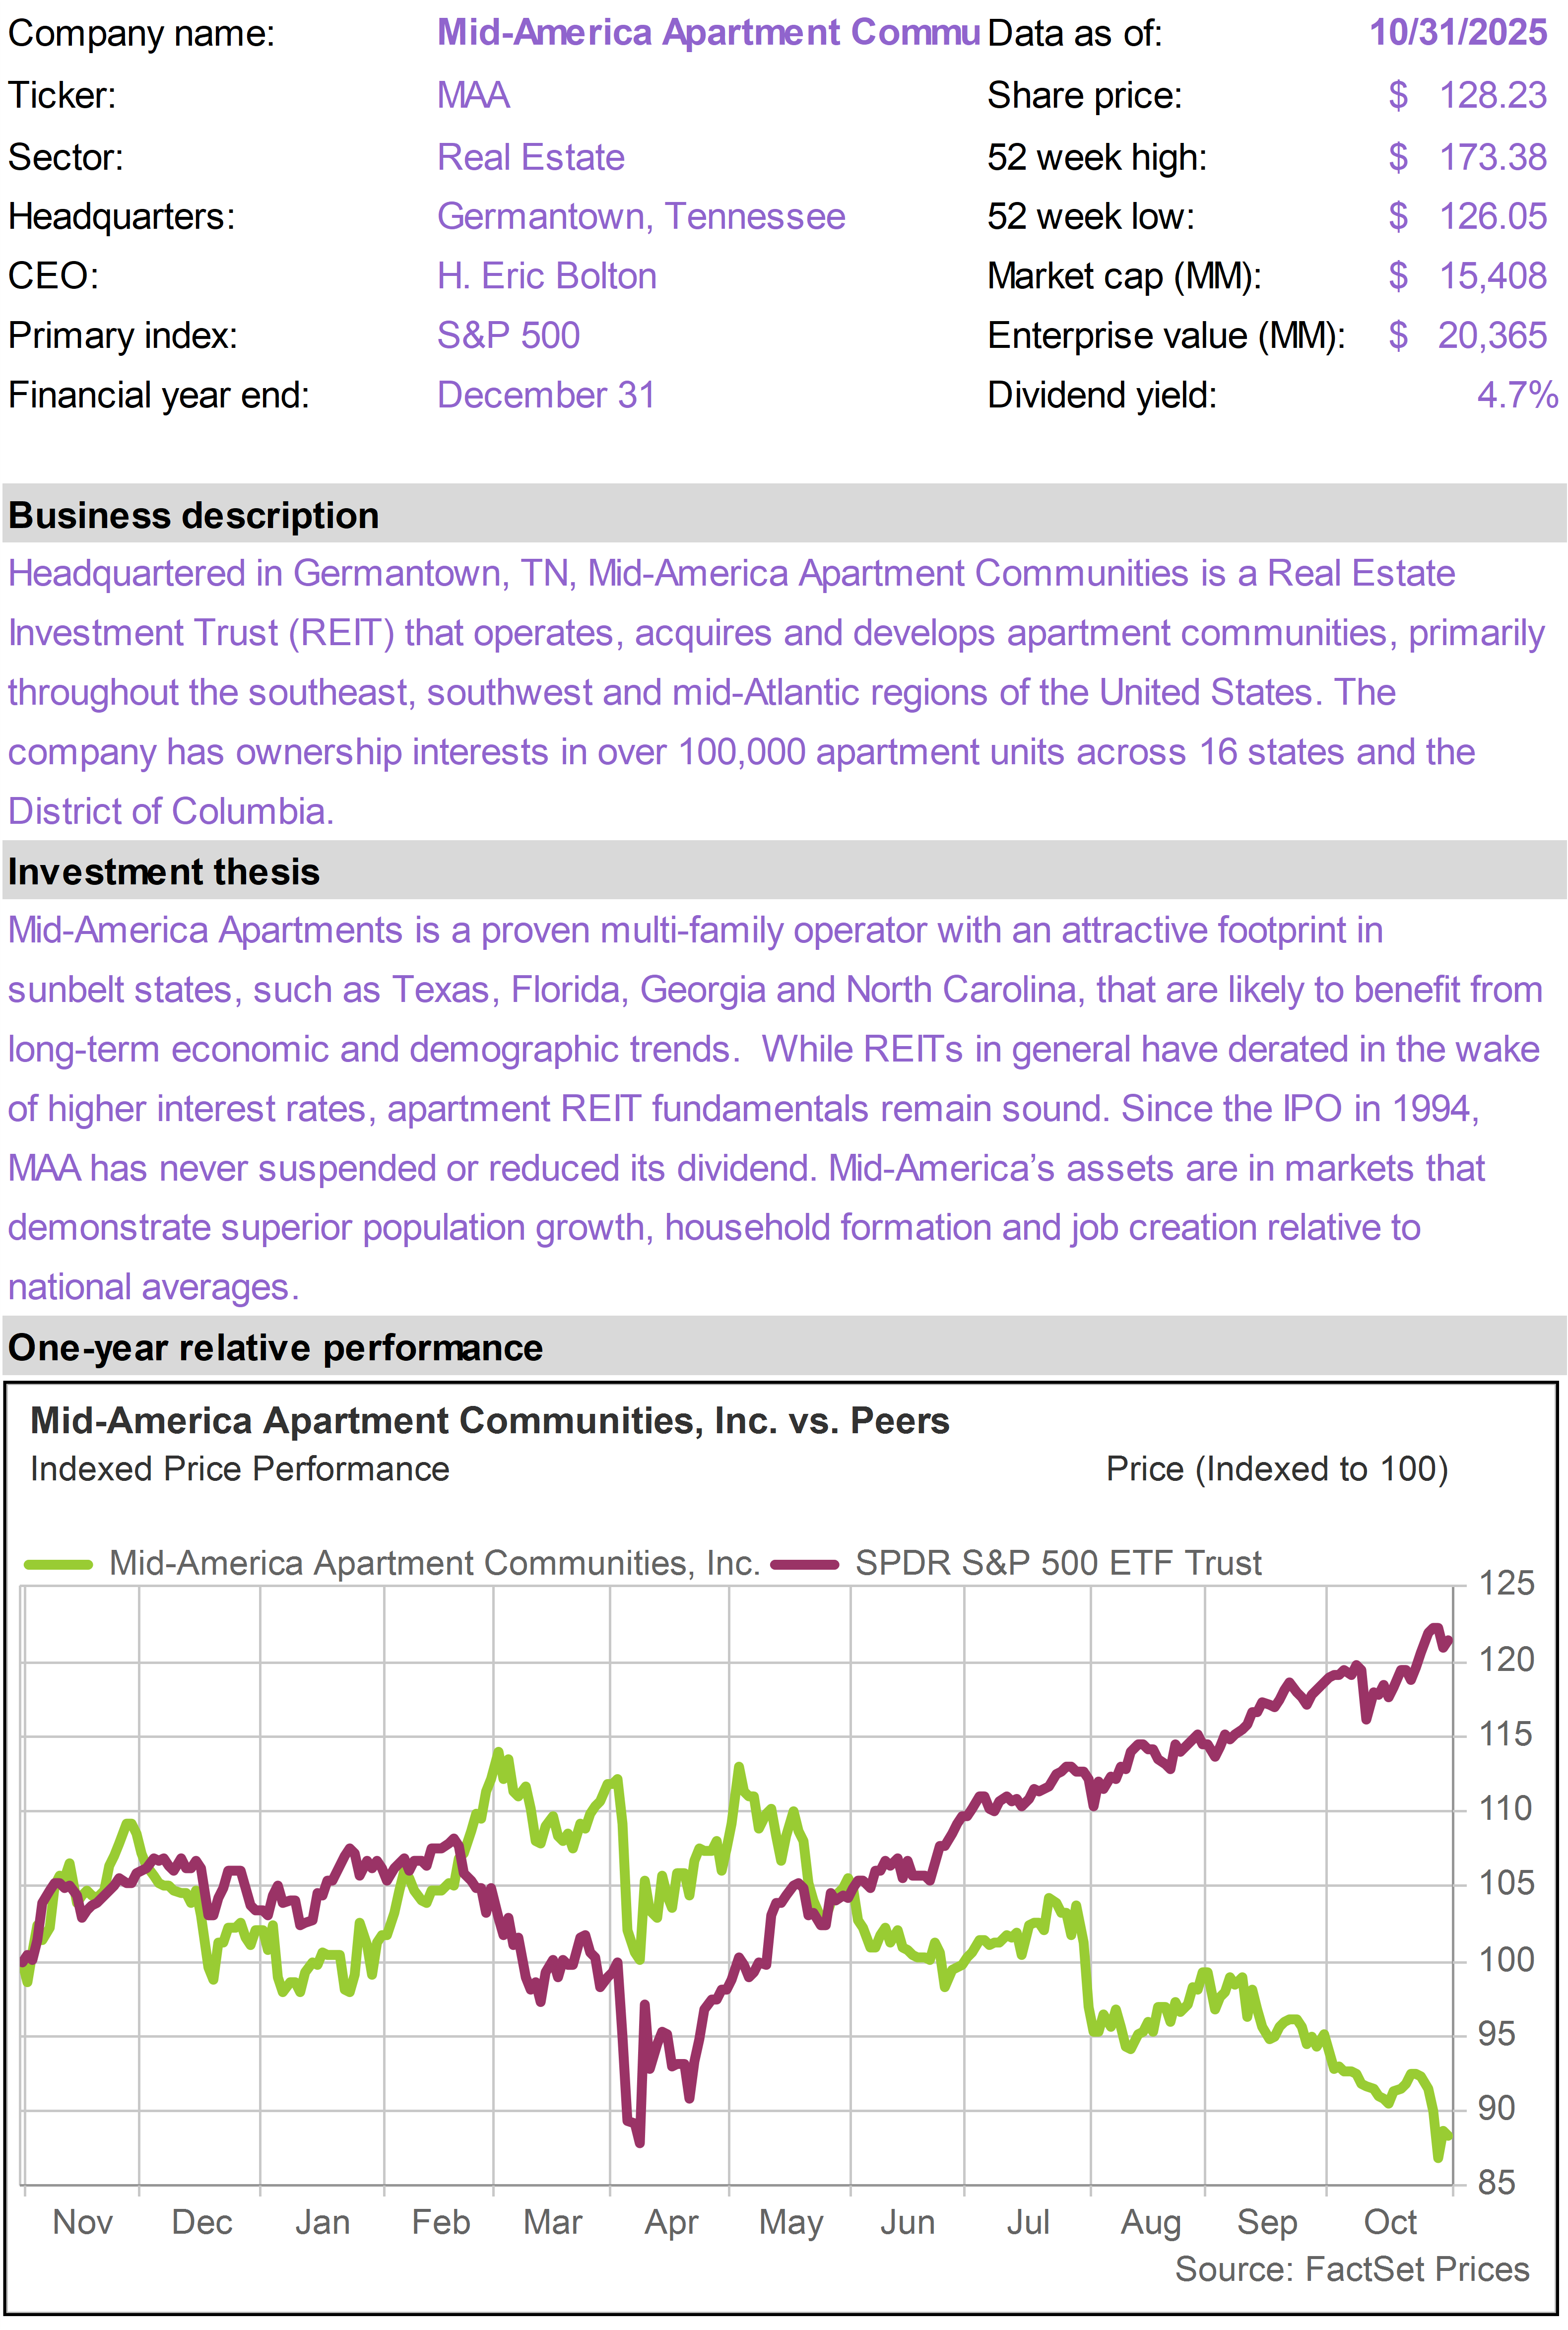
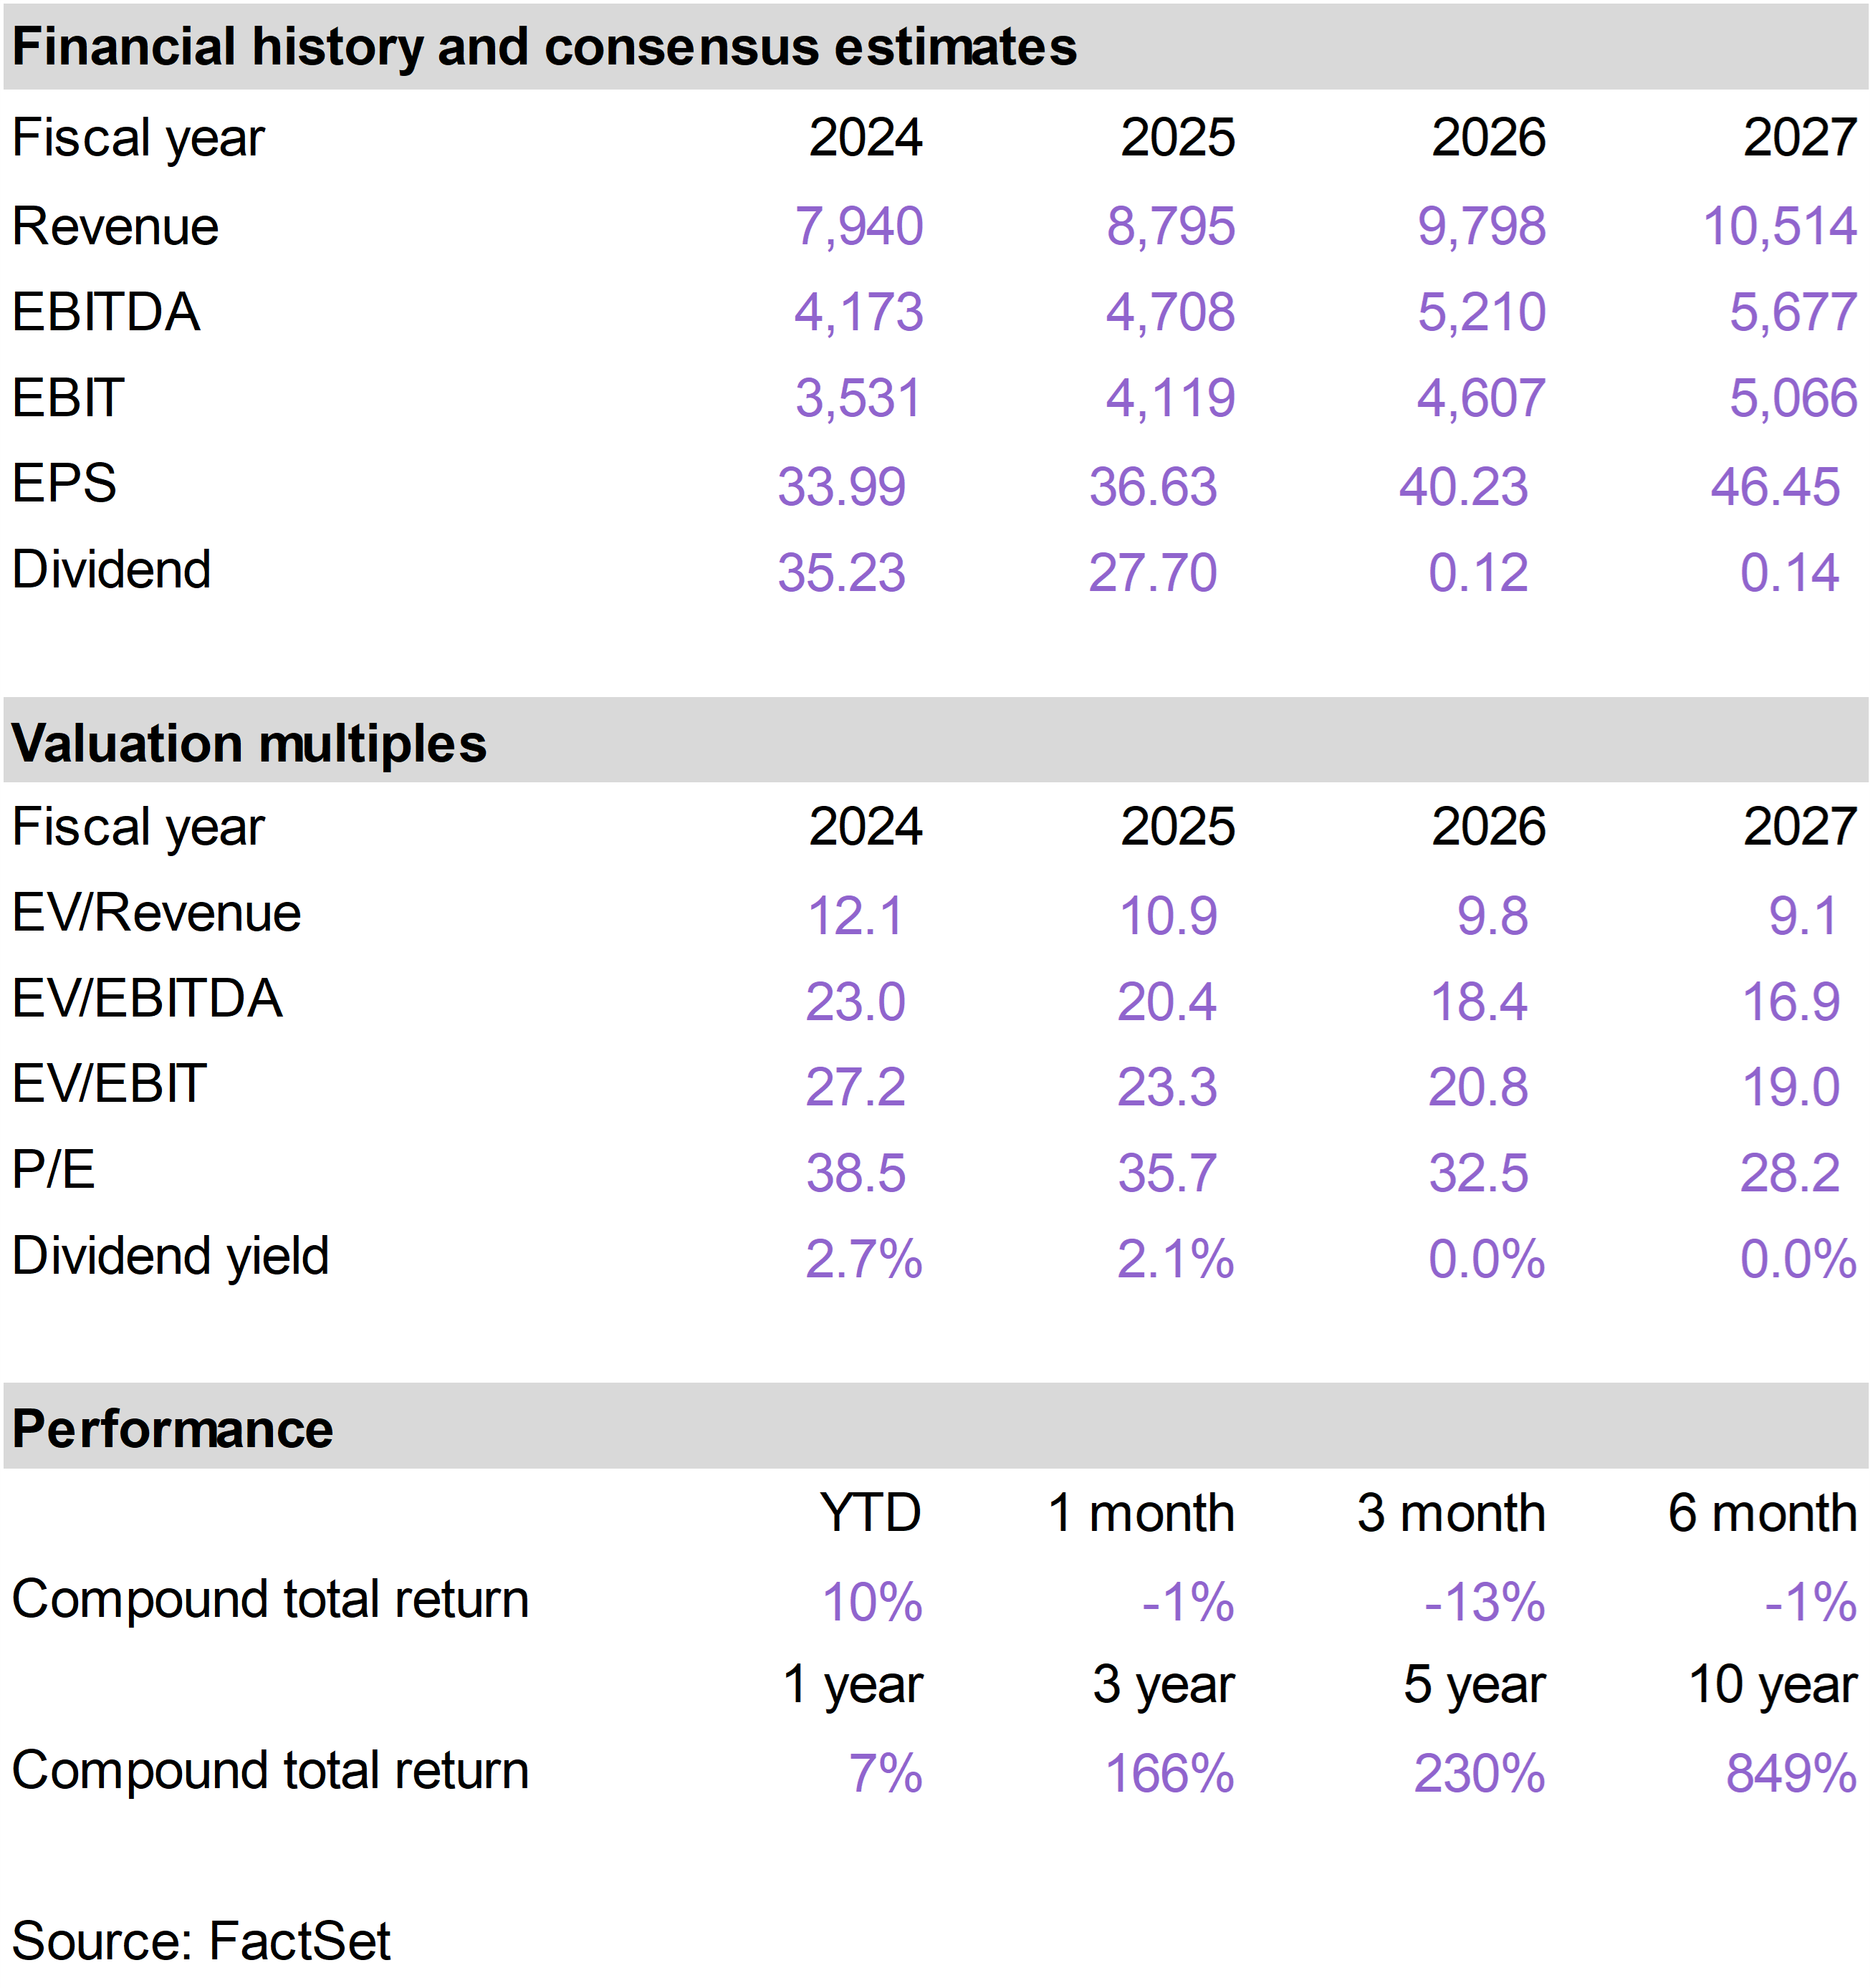
| | Mid-America Apartment (MAA) |
|
|
|
| |
|
| | |
|
| | |
|
| | |
|
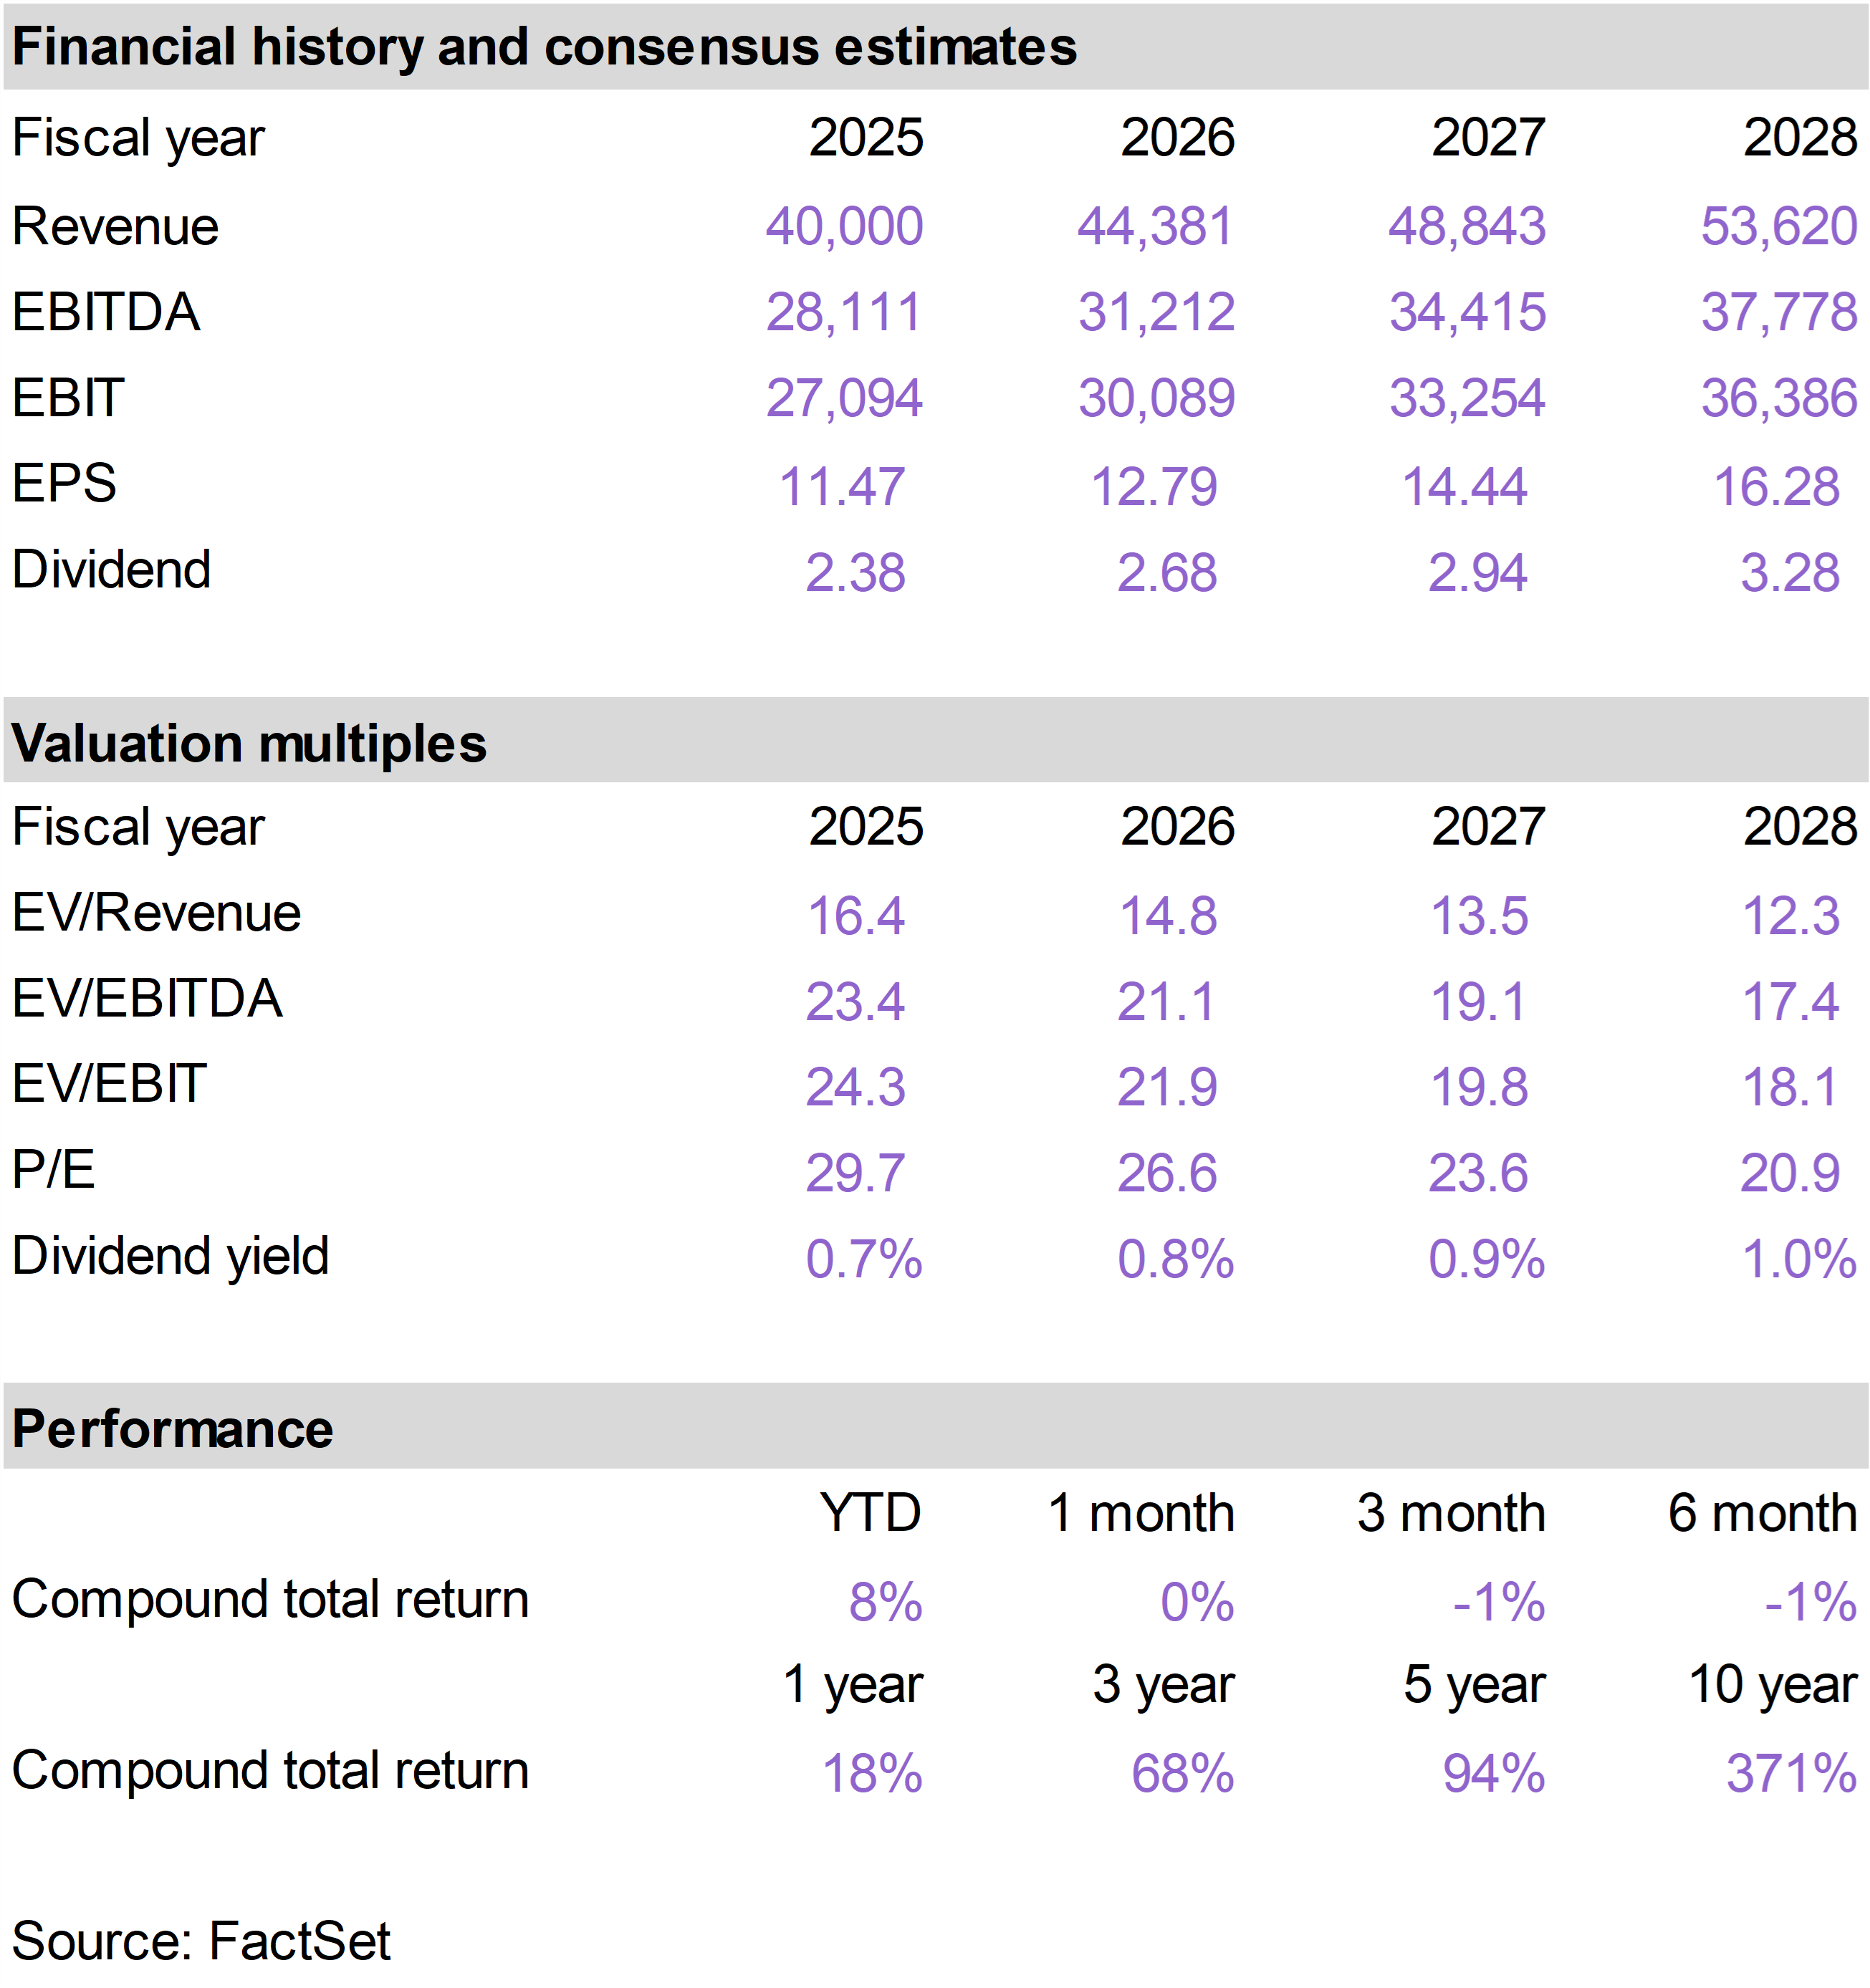
| | Diamondback Energy (FANG) |
|
|
|
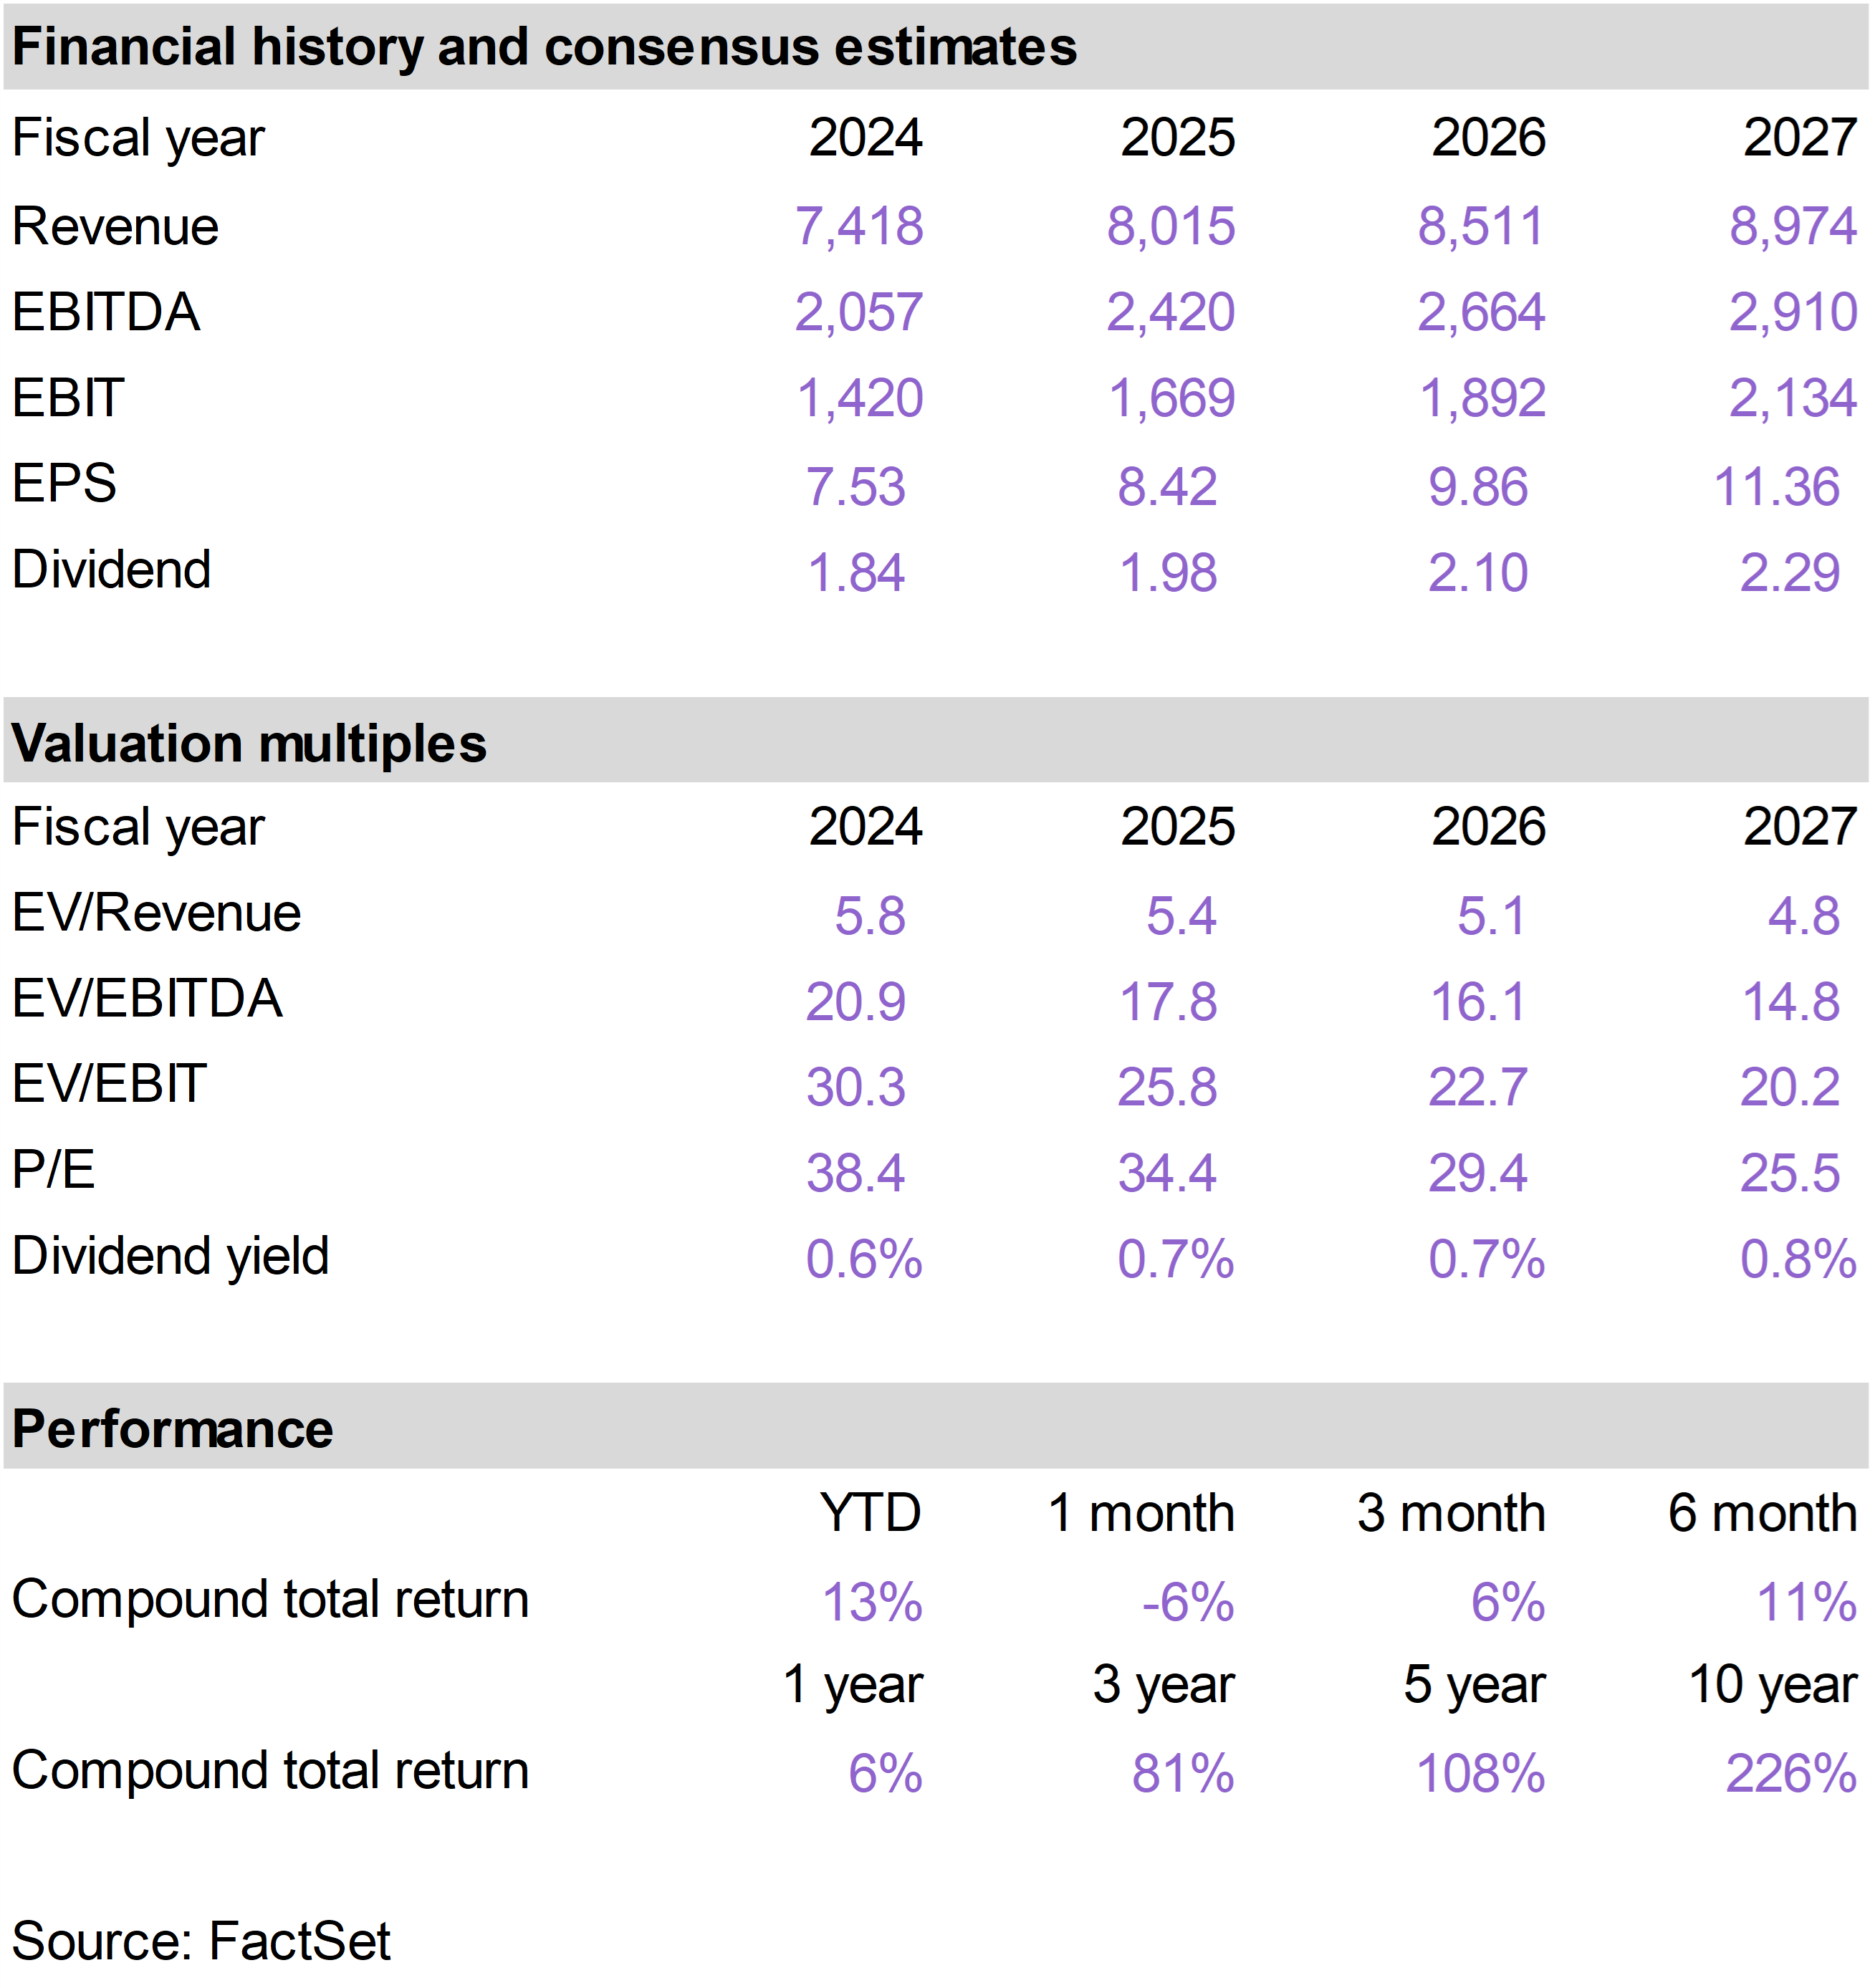
| | Floor & Decor Holdings (FND) |
|
|
|
| | |
|
| | |
|
| | WESCO International (WCC) |
|
|
|
| | Wheaton Precious Metals (WPM) |
|
|
|
| | The 76research Inflation Protection Model Portfolio emphasizes business models that benefit from inflationary pressure. Holdings are typically selected from industries based on supply constrained real assets, including commodity and energy businesses, or companies that otherwise demonstrate superior pricing power. Drawing from an investable universe of expected inflation beneficiaries, specific holdings are chosen based on valuation and general business quality, growth and risk considerations. |
|
| | FOR SUBSCRIBER USE ONLY. DO NOT FORWARD OR SHARE. |
|
| | | |
|
|
|
|
| |
|