| Inflation Protection Model Portfolio |
|
| Monthly Portfolio Review: June 2026Publication date: July 6, 2026 |
|
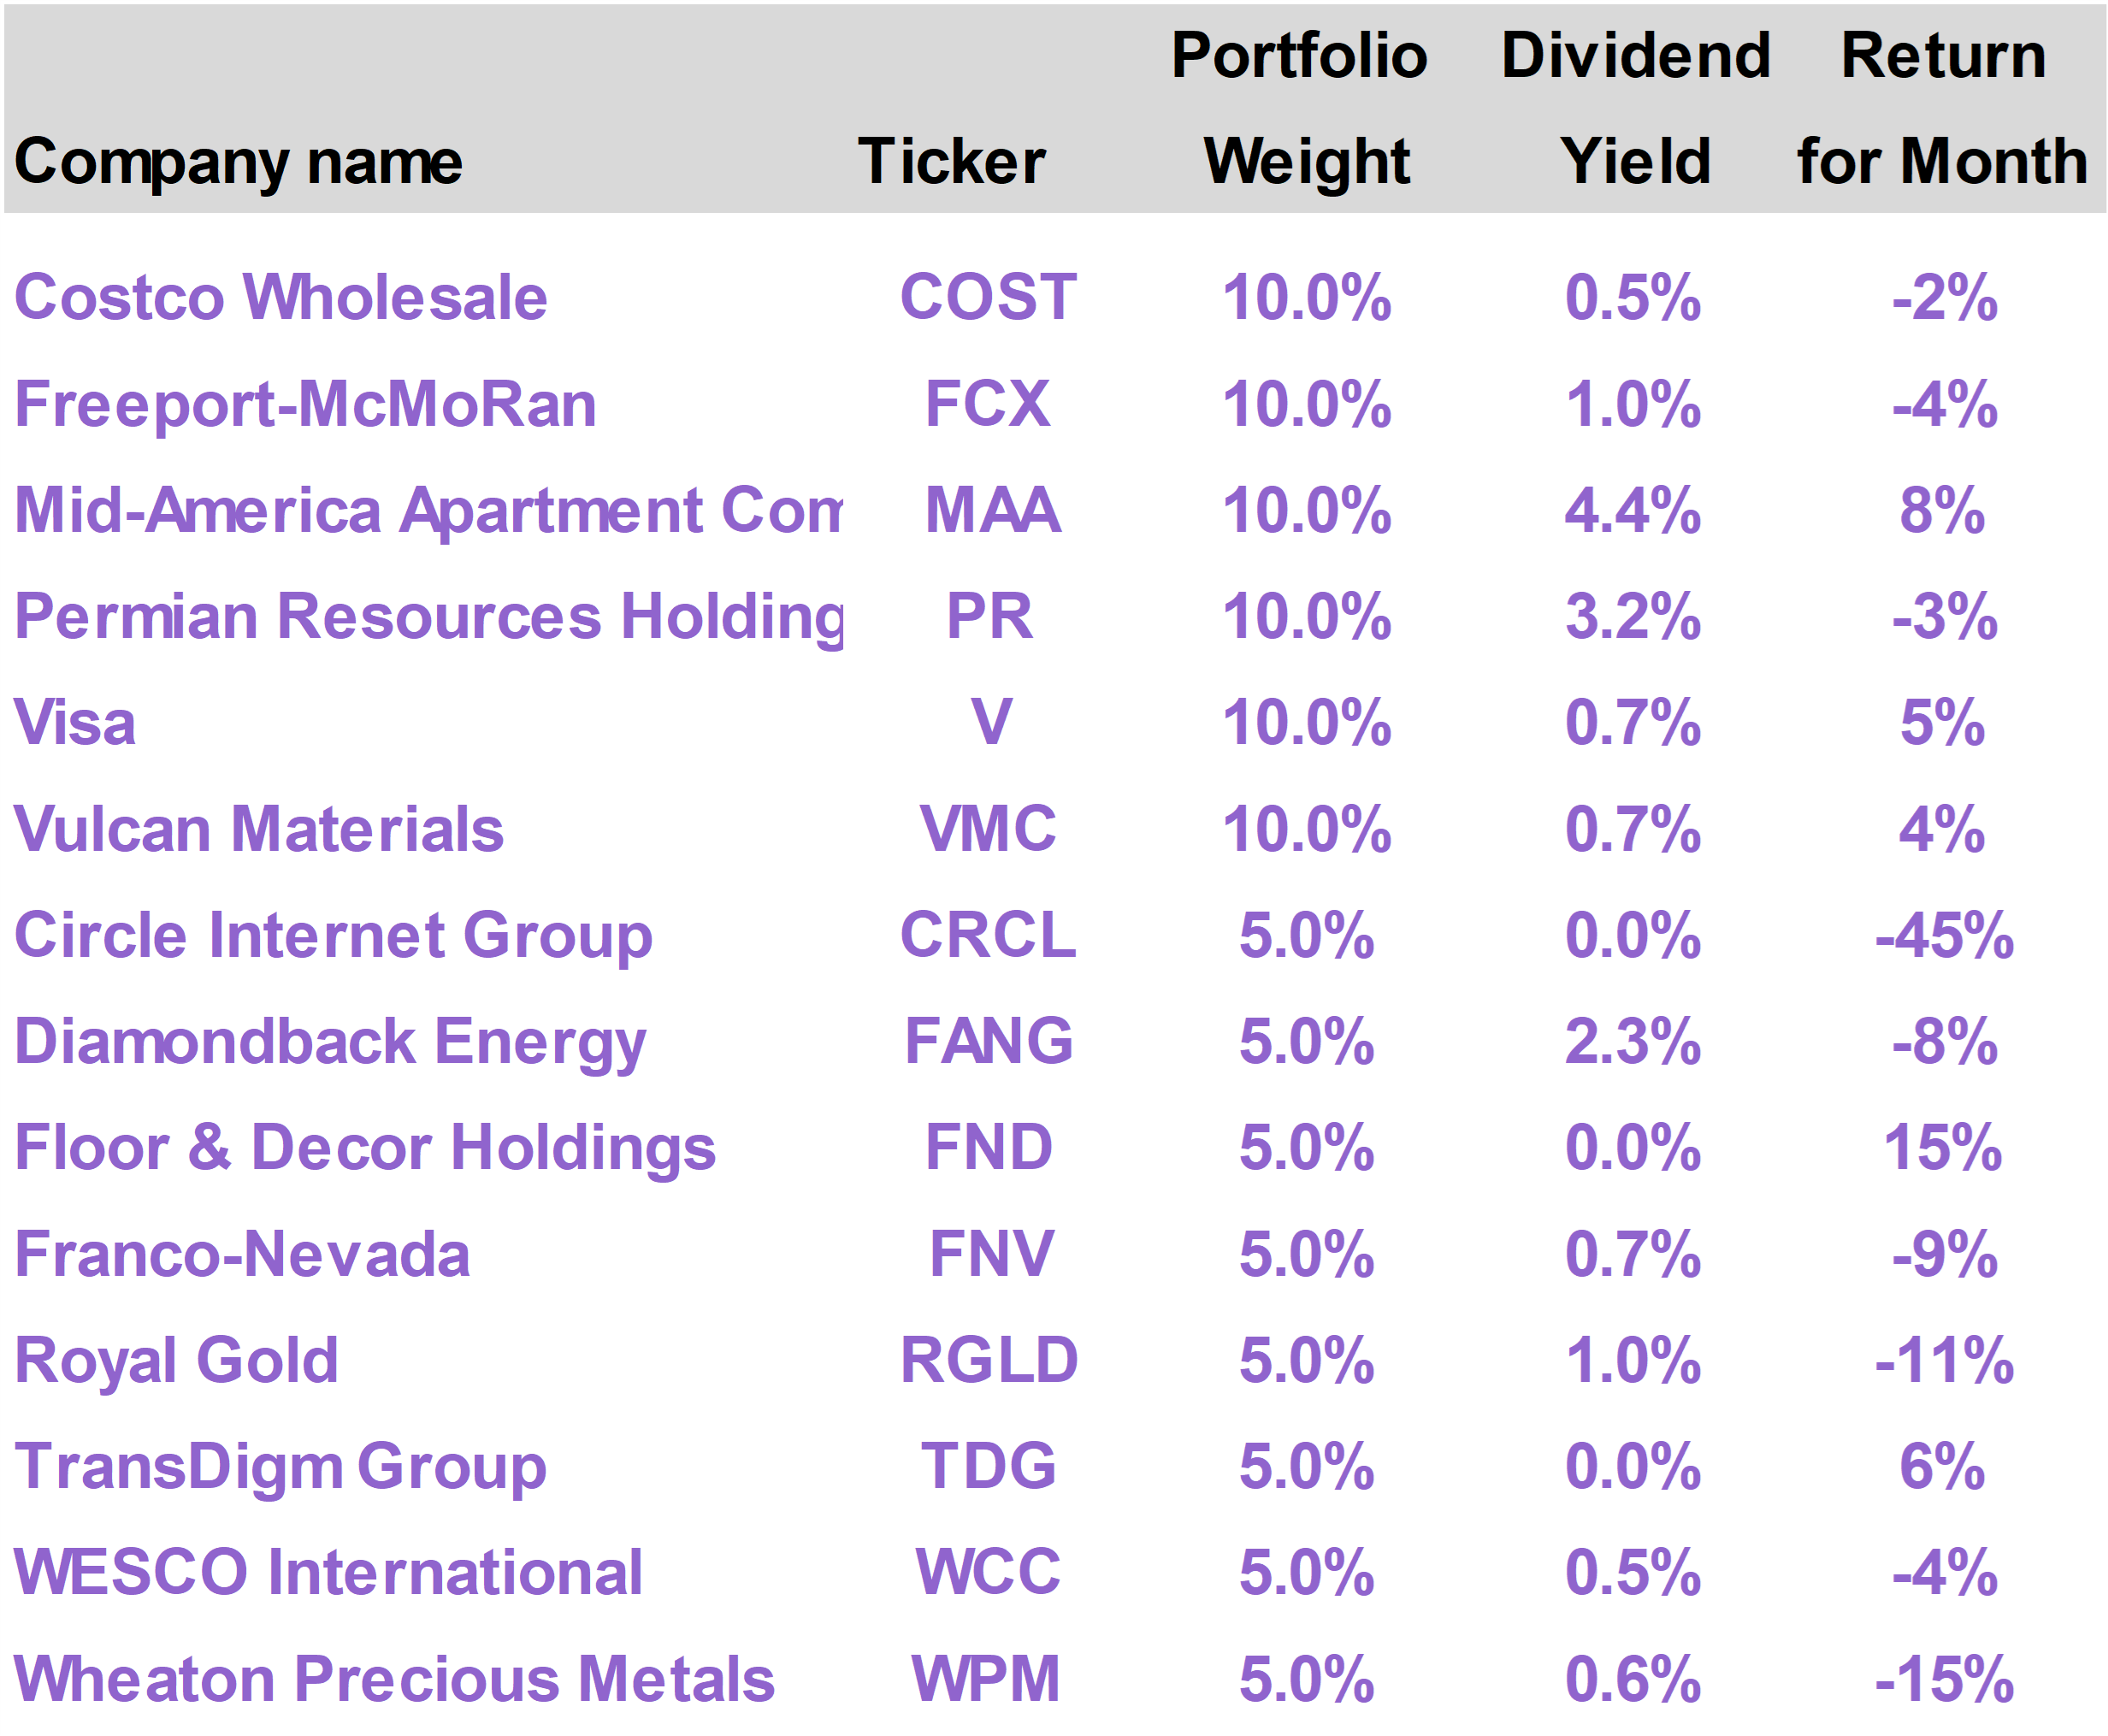
| | | Current portfolio holdings |
|
|
| | FOR SUBSCRIBER USE ONLY. DO NOT FORWARD OR SHARE. |
|
| | | Mega-cap Technology stocks lagged substantially in June, as investors rotated into underperforming sectors. The S&P 500 declined approximately 1%. On the macro front, the United States and Iran made critical progress toward a peace deal. The Strait of Hormuz reopened, leading to substantially lower oil prices and some pressure on energy stocks. Although lower energy prices will be a clear positive for the inflation outlook, Kevin Warsh’s surprisingly hawkish messaging in his debut as Fed Chair prevented any decline in interest rates. With monetary policy apparently staying tight, gold, crypto, energy, and other commodities traded off in June. The Inflation Protection portfolio declined 2.9% this month. On a year to date basis, the portfolio has advanced 12.2%, versus 10.2% for the S&P 500. Warsh’s initial focus is on building credibility, but over time, lower oil prices are likely to make inflation data more favorable, setting up a potential return to a rate-cutting trajectory.
|
|
| | | The Inflation Protection portfolio returned -2.9% in June, versus the S&P 500 Index return of -1.0%. On a year to date basis through the end of the month, the portfolio has generated a total return of 12.2%, versus the 10.2% return of the S&P 500.
The portfolio’s top performing stocks this month were Floor & Decor Holdings (FND), which returned 15%; Mid-America Apartment Communities (MAA), which returned 8%; and TransDigm (TDG), which returned 6%.
The largest portfolio detractors were Circle Internet Group (CRCL), which returned -45%; Wheaton Precious Metals (WPM), which returned -15%; and Royal Gold (RGLD), which returned -11%. |
|
|
Mega-cap tech slides
Following two very strong months, Technology stocks took a breather in June. Within the S&P 500, the Tech sector was actually flat, but this obscures more severe weakness among some of the largest capitalization tech names.
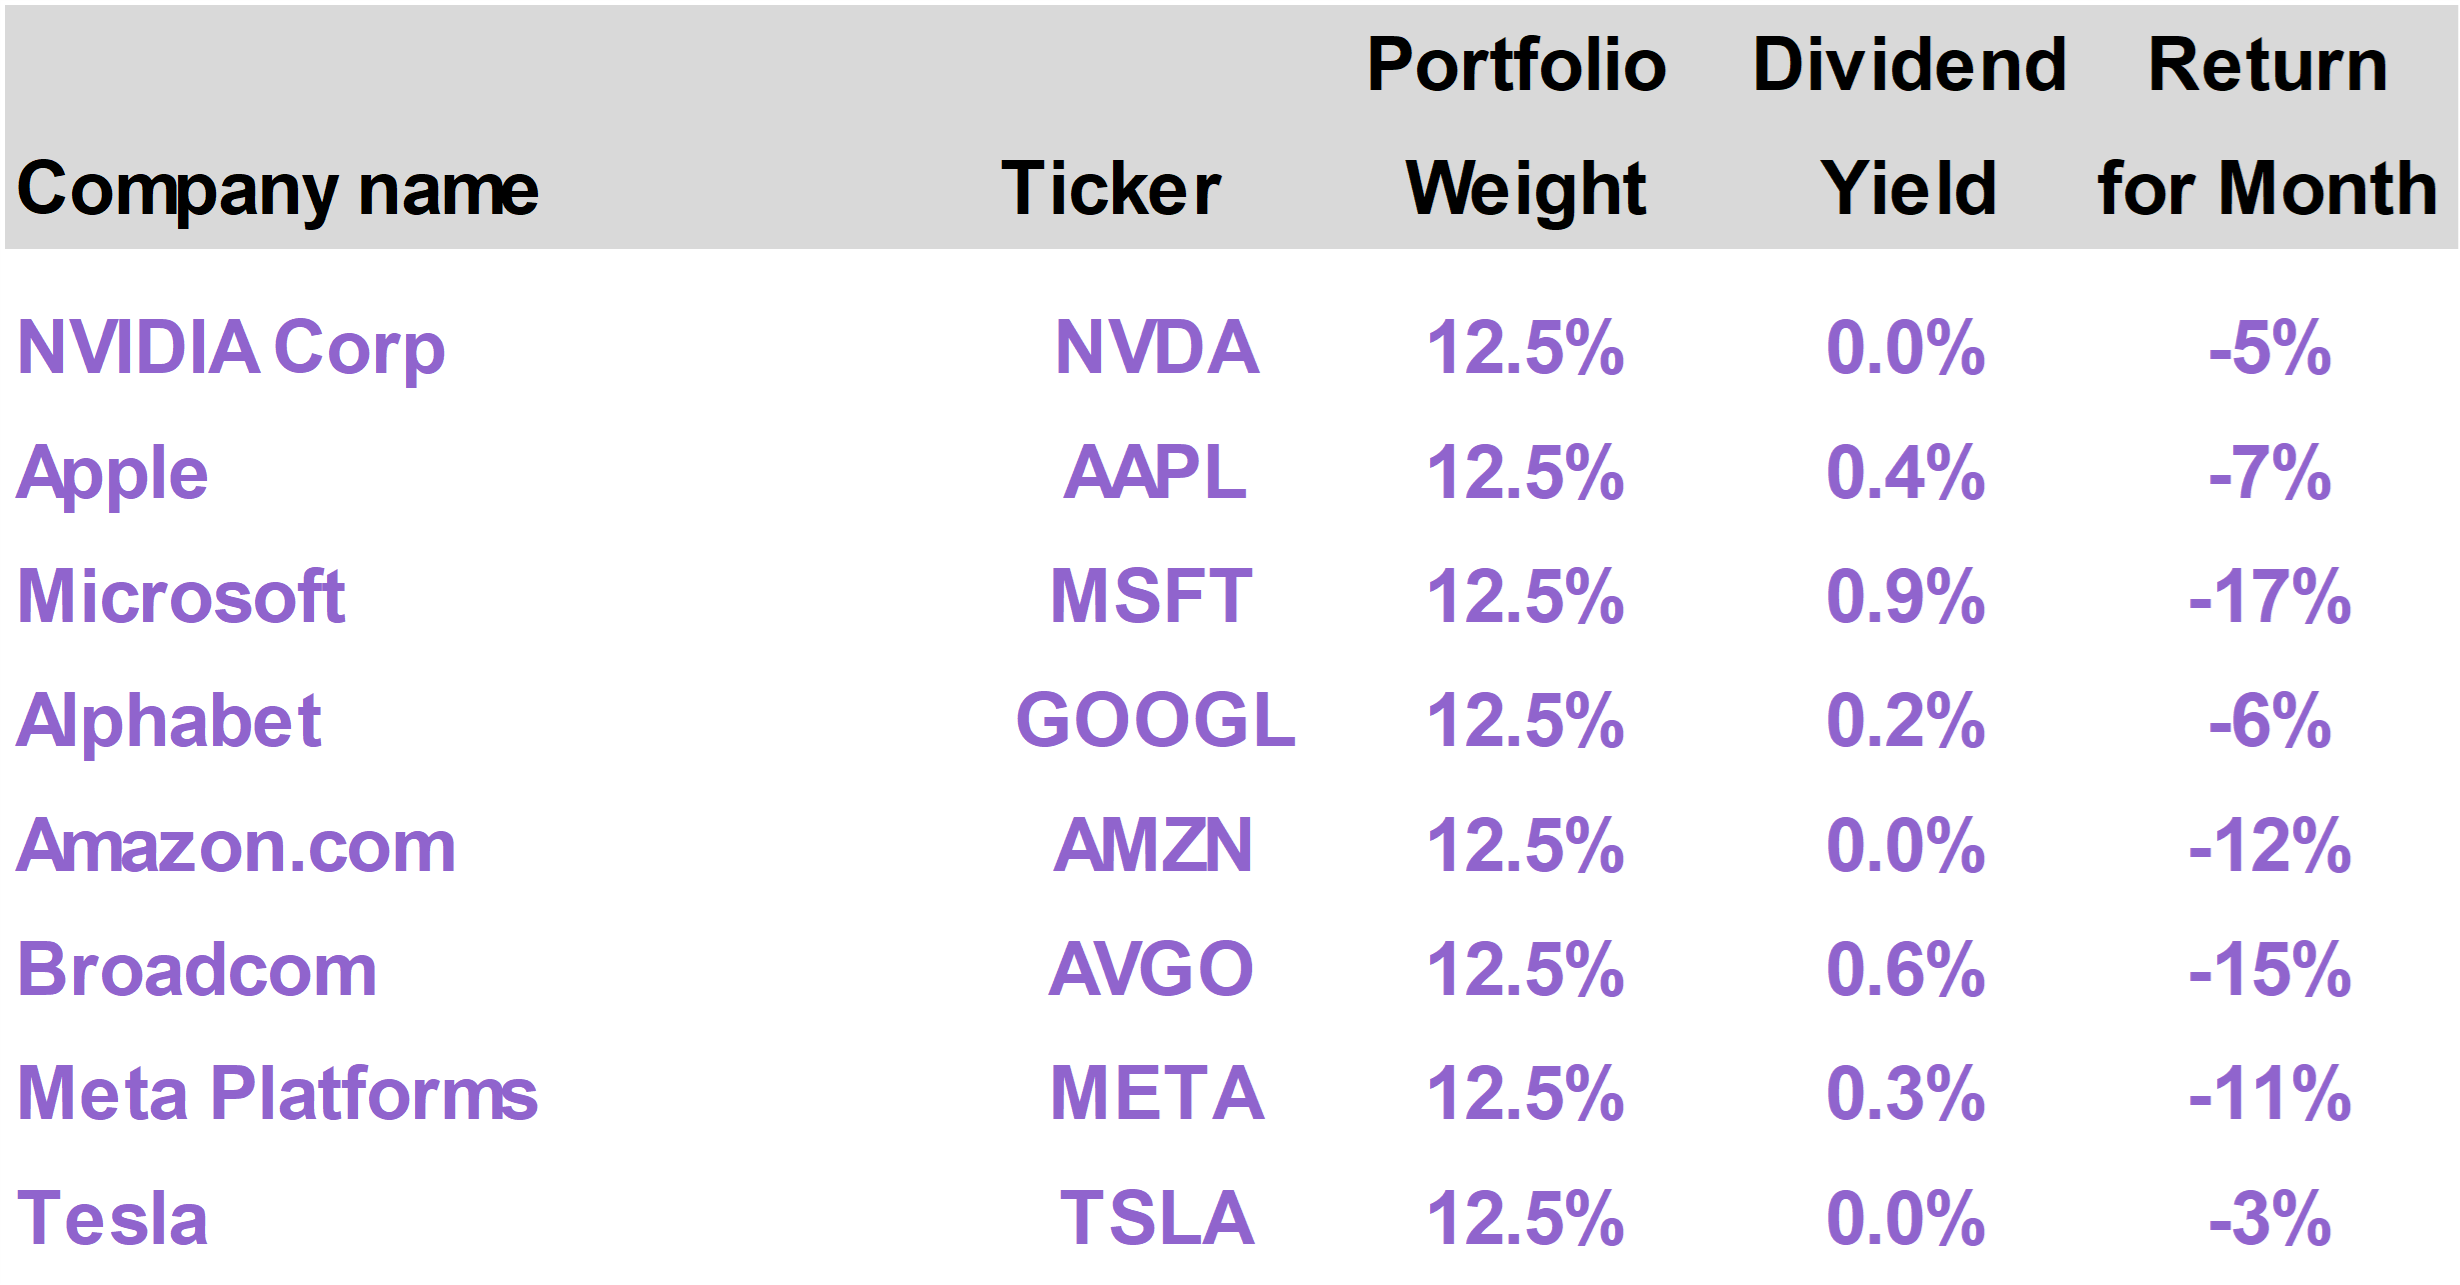
Every single mega-cap tech (or tech-adjacent) stock that we cover within our MAG7 MONITOR generated a negative return in June. The average Mag 7 stock declined 10%, contributing to a 2.8% decline in the NASDAQ Composite in June. |
|
|
| |
Semiconductor stocks offset much of this weakness, with High-Bandwidth Memory plays like Micron (MU) and Sandisk (SNDK) continuing to deliver strong upside. The VanEck Semiconductor ETF (SMH) advanced 9.7% in June, propelled by memory names.
Within Technology, investors rotated capital from the customers of these supply-constrained semiconductor players (such as the Mag 7 hyperscalers) to the suppliers themselves.
The SpaceX (SPCX) IPO on June 12, the biggest IPO in history, was also a likely headwind for mega-cap tech stocks. The eventual inclusion of SPCX in various indexes means fund managers need to sell down other positions to raise cash for SPCX allocations.
As investors pulled money from the largest cap names in June, the Communication Services sector, dominated by Amazon (AMZN) and Meta (META), was the worst performer.
By contrast, sectors that have underperformed Technology in recent months, notably Industrials, Health Care and Financials, did comparatively well. |
|
|
|
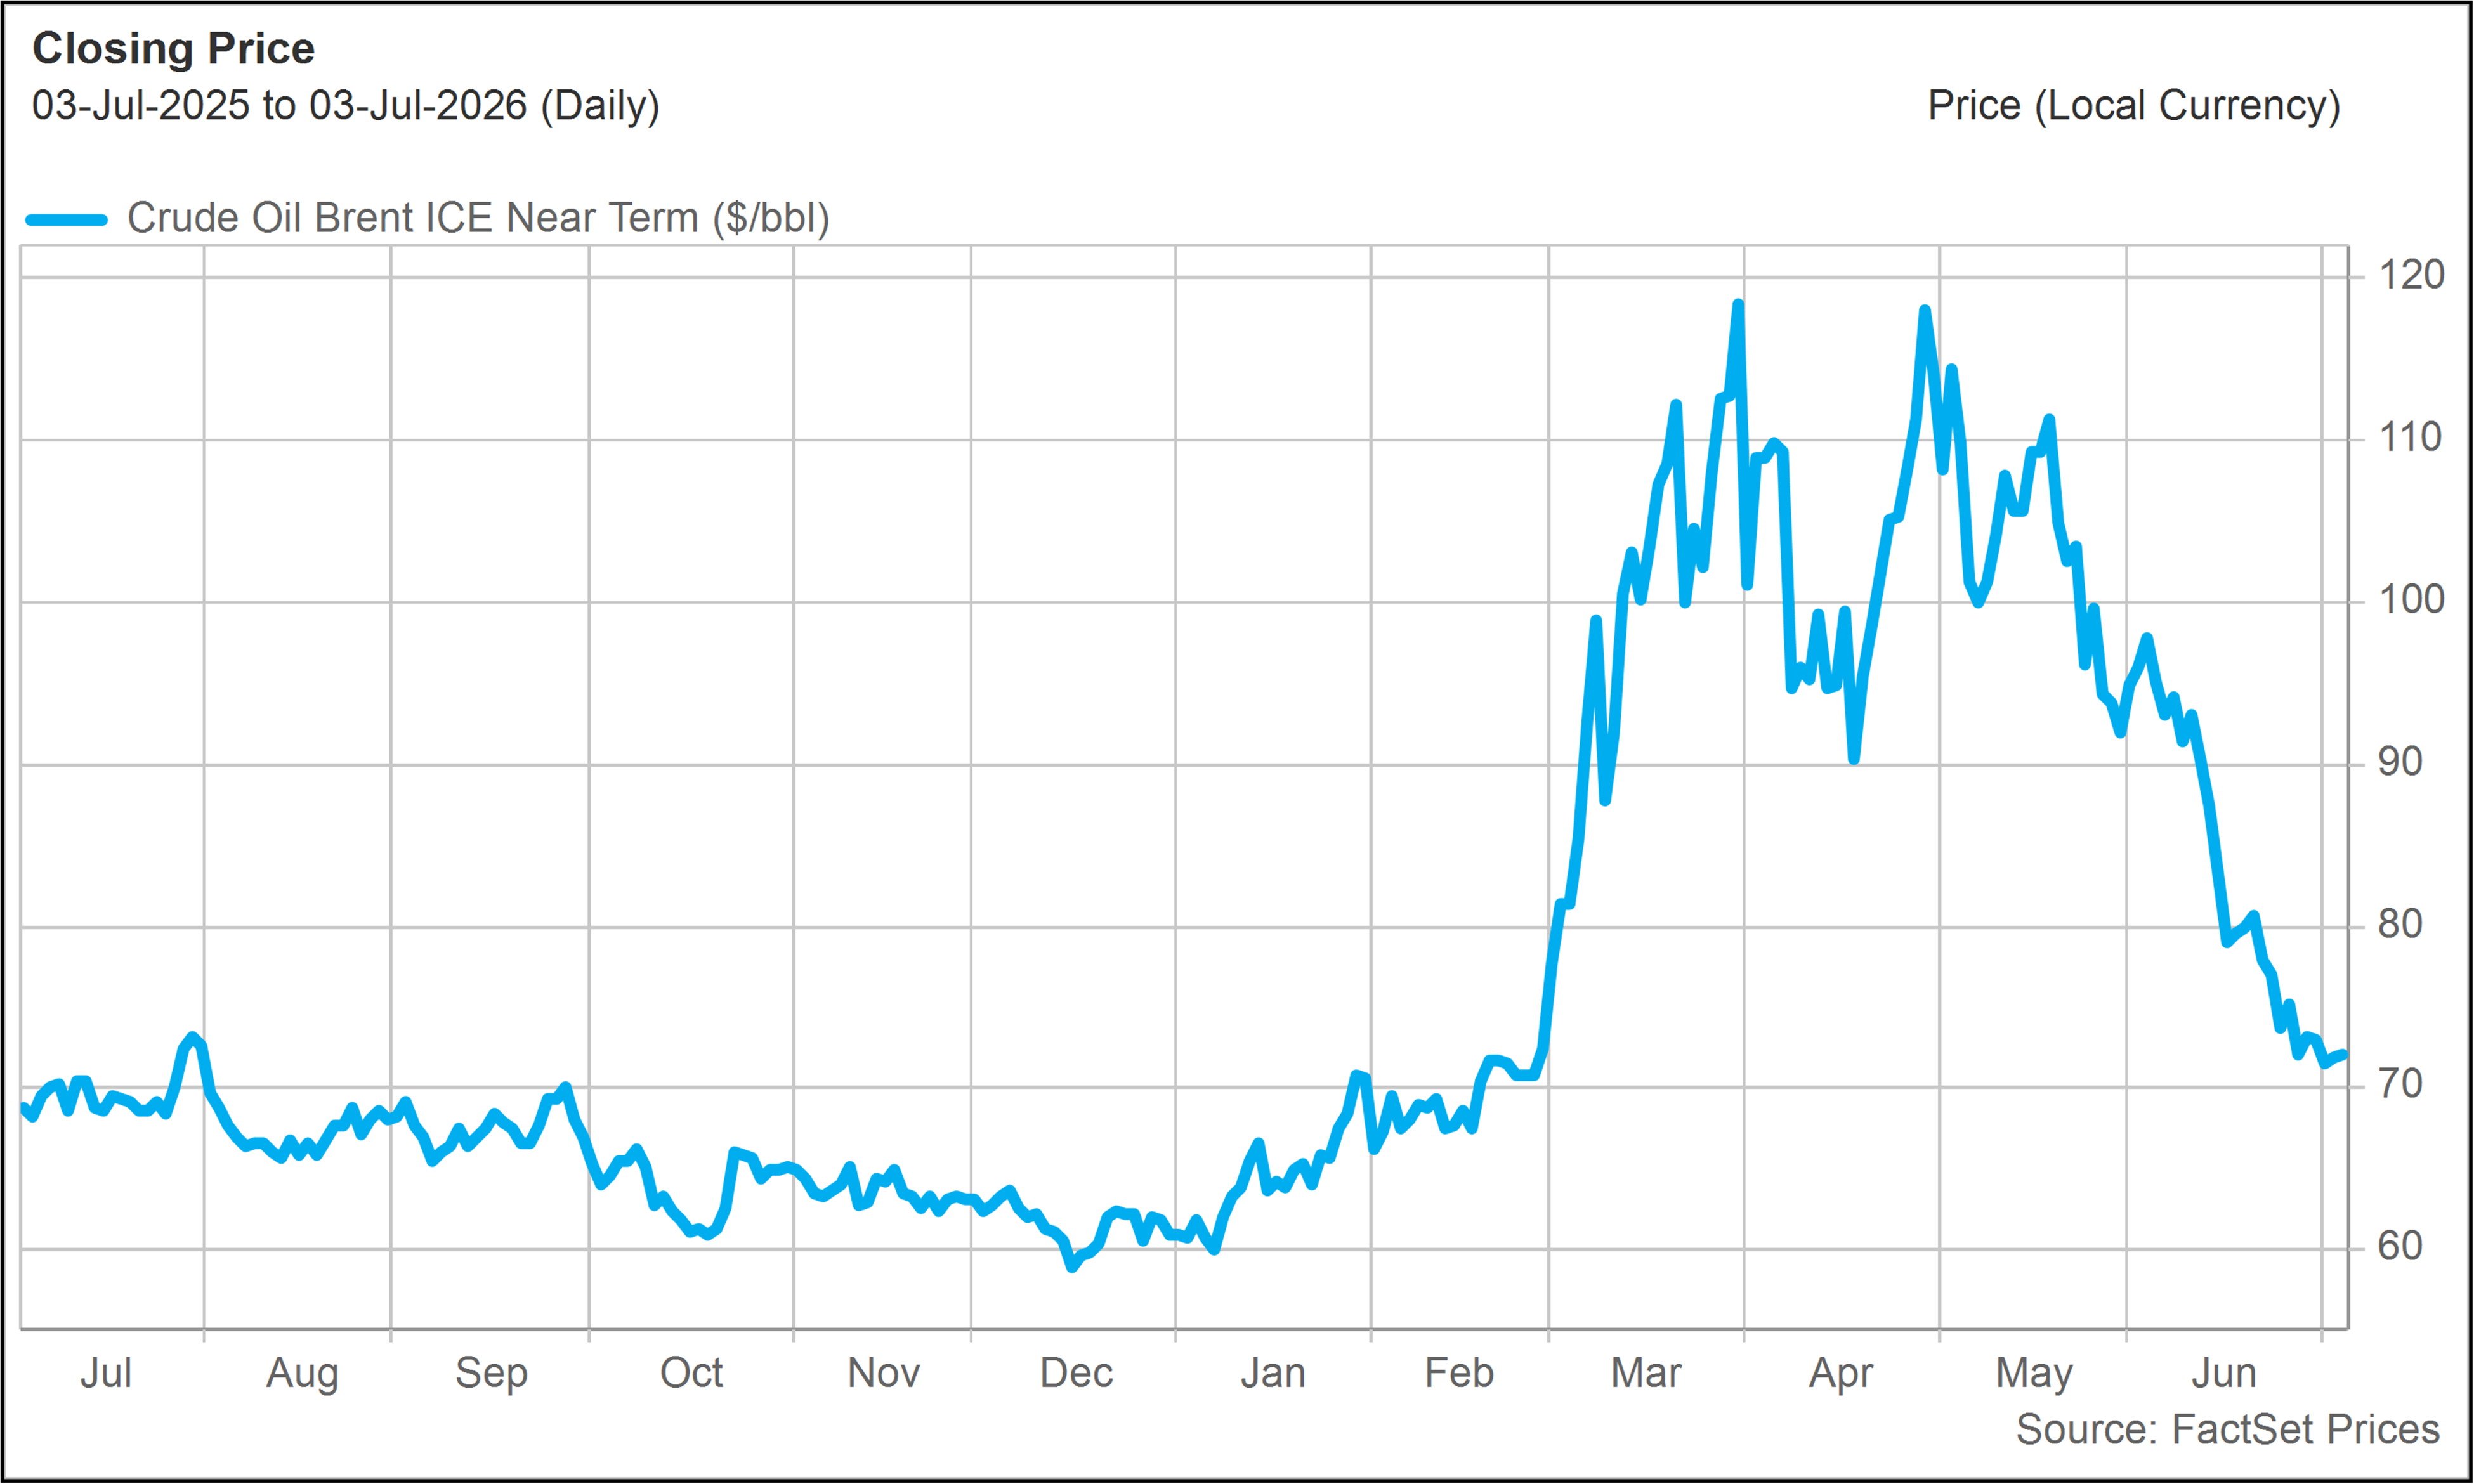
Energy stocks also lagged in June as oil prices declined with the mid-month signing of a Memorandum of Understanding (MOU) between the United States and Iran.
The agreement is a prelude to what is expected to be a longer lasting peace deal that, among other things, will keep the Strait of Hormuz open for commercial traffic.
The immediate impact on oil markets has been sharp. Spot prices for Brent Crude Oil approached $70 per barrel by the end of June. They began the month north of $90. |
|
|
|
Brent Crude Oil($/barrel - Last 12 Months) |
|
|
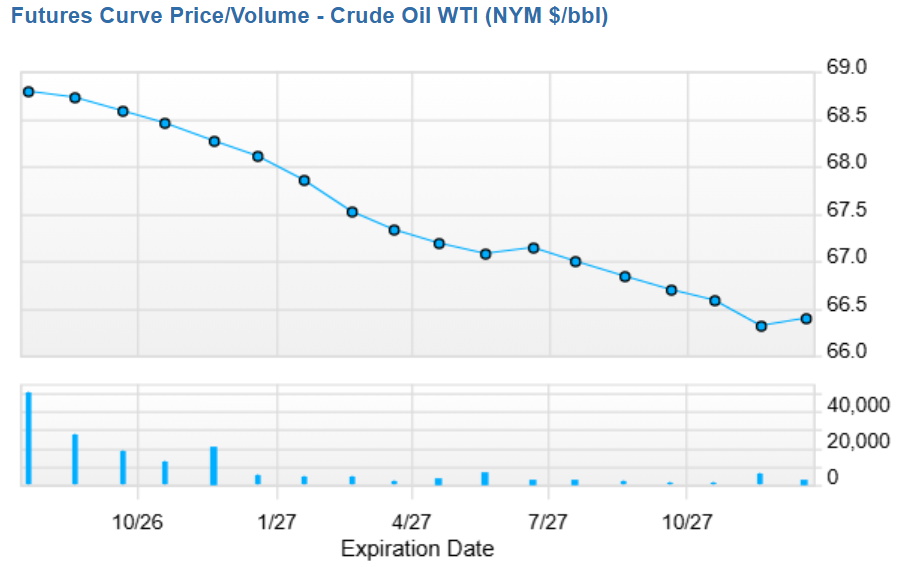
As we have noted in previous reports, futures markets in oil have, throughout the war, indicated much lower oil prices in the months and years ahead. Futures markets are now pricing in even lower oil prices, with implied expectations in the mid-$60s range one year from now. |
|
|
|
Crude Oil Futures Curve(Source: FactSet) |
|
|
Is the inflation threat gone?
One might have assumed that the peace deal with Iran and subsequent decline in oil prices would have had a meaningful impact on inflation expectations and, by extension, interest rates.
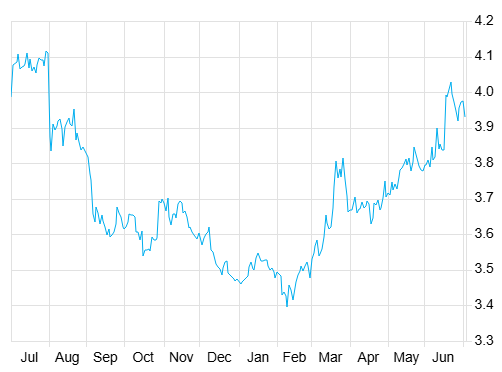
After all, it was the outbreak of hostilities in the Middle East and closure of the Strait of Hormuz that caused short-term interest rates, as reflected by the One-Year Treasury yield, to rise sharply earlier this year. Between February and May 2026, One-Year Treasury Yields rose approximately a quarter-point to approximately 3.8%.
With the Fed funds rate now in a 3.5% to 3.75% band, this upward move reflected a sense that at least one previously expected rate cut will not materialize in the year ahead, along with some potential for a rate hike. |
|
|
|
One-Year Treasury Yields—Last 12 Months(Source: FactSet) |
|
|
Yet even though oil prices are now close to where they were in February, short-term interest rate expectations have not budged. In fact, the One-Year Treasury yield advanced approximately 0.15% in June, as oil prices collapsed.
Warsh’s surprising hawkishness
The new Fed Chair Kevin Warsh oversaw his first Federal Open Market Committee (FOMC) meeting and held his debut press conference on June 17. Warsh was handpicked by President Trump, whose strong desire to see the Fed cut interest rates has been made abundantly clear.
Warsh was nominated in part because he conveyed a path to lower interest rates through his focus on tech-driven disinflation and his stated desire to dial back the Fed’s long-term bond positioning. Warsh believes that shrinking the Fed’s balance sheet may potentially put some upward pressure on long-term bond yields but frees the Fed’s hand to have lower short-term rates.
The bond market expected a dove. Yet rather than come out with a strong rate-cutting message, Warsh spoke about the need to bring inflation back to target levels.
He also presented himself as a consensus-builder who would work collaboratively with other Fed officials, many of whom are now talking about the possibility of even having to raise rates.
To be fair, the recent inflation data, published toward the end of June, gives Warsh little room to sound too dovish at the moment. Headline inflation moved back above 4% in May, largely because of the energy shock, while core inflation, excluding food and energy, remained well above the Fed’s 2% target at 3.4%.
Playing the long game
Warsh may still be keen to bring interest rates down, but he needs to bring the other voting members of the FOMC onboard. Coming out too aggressively could undermine his ability to lead the Fed in that direction.
He also likely saw no need to make enemies during his first few weeks on the job by taking a belligerent attitude toward incumbent Fed Governors. He spoke positively about them during the press conference.
Warsh has consistently emphasized that the Fed under his leadership will be data-dependent. With inflation still elevated, the data does not currently support an aggressive dovish pivot.
But with oil prices headed sharply down, the data should soon follow. This will leave Warsh in a stronger position to advocate for lower rates as the impact of lower energy prices becomes reflected in consumer price readings going forward.
Even Trump seems content with the situation, noting that Warsh “has to do what he has to do” to overcome Fed board members who are “a little bit hostile.”
Stubbornly high interest rates remain a headwind for both the stock market and the economy but also a source of untapped upside. With oil now close to pre-Epic Fury levels, we may see the macro picture develop in a favorable way over the rest of the year. |
|
| | |
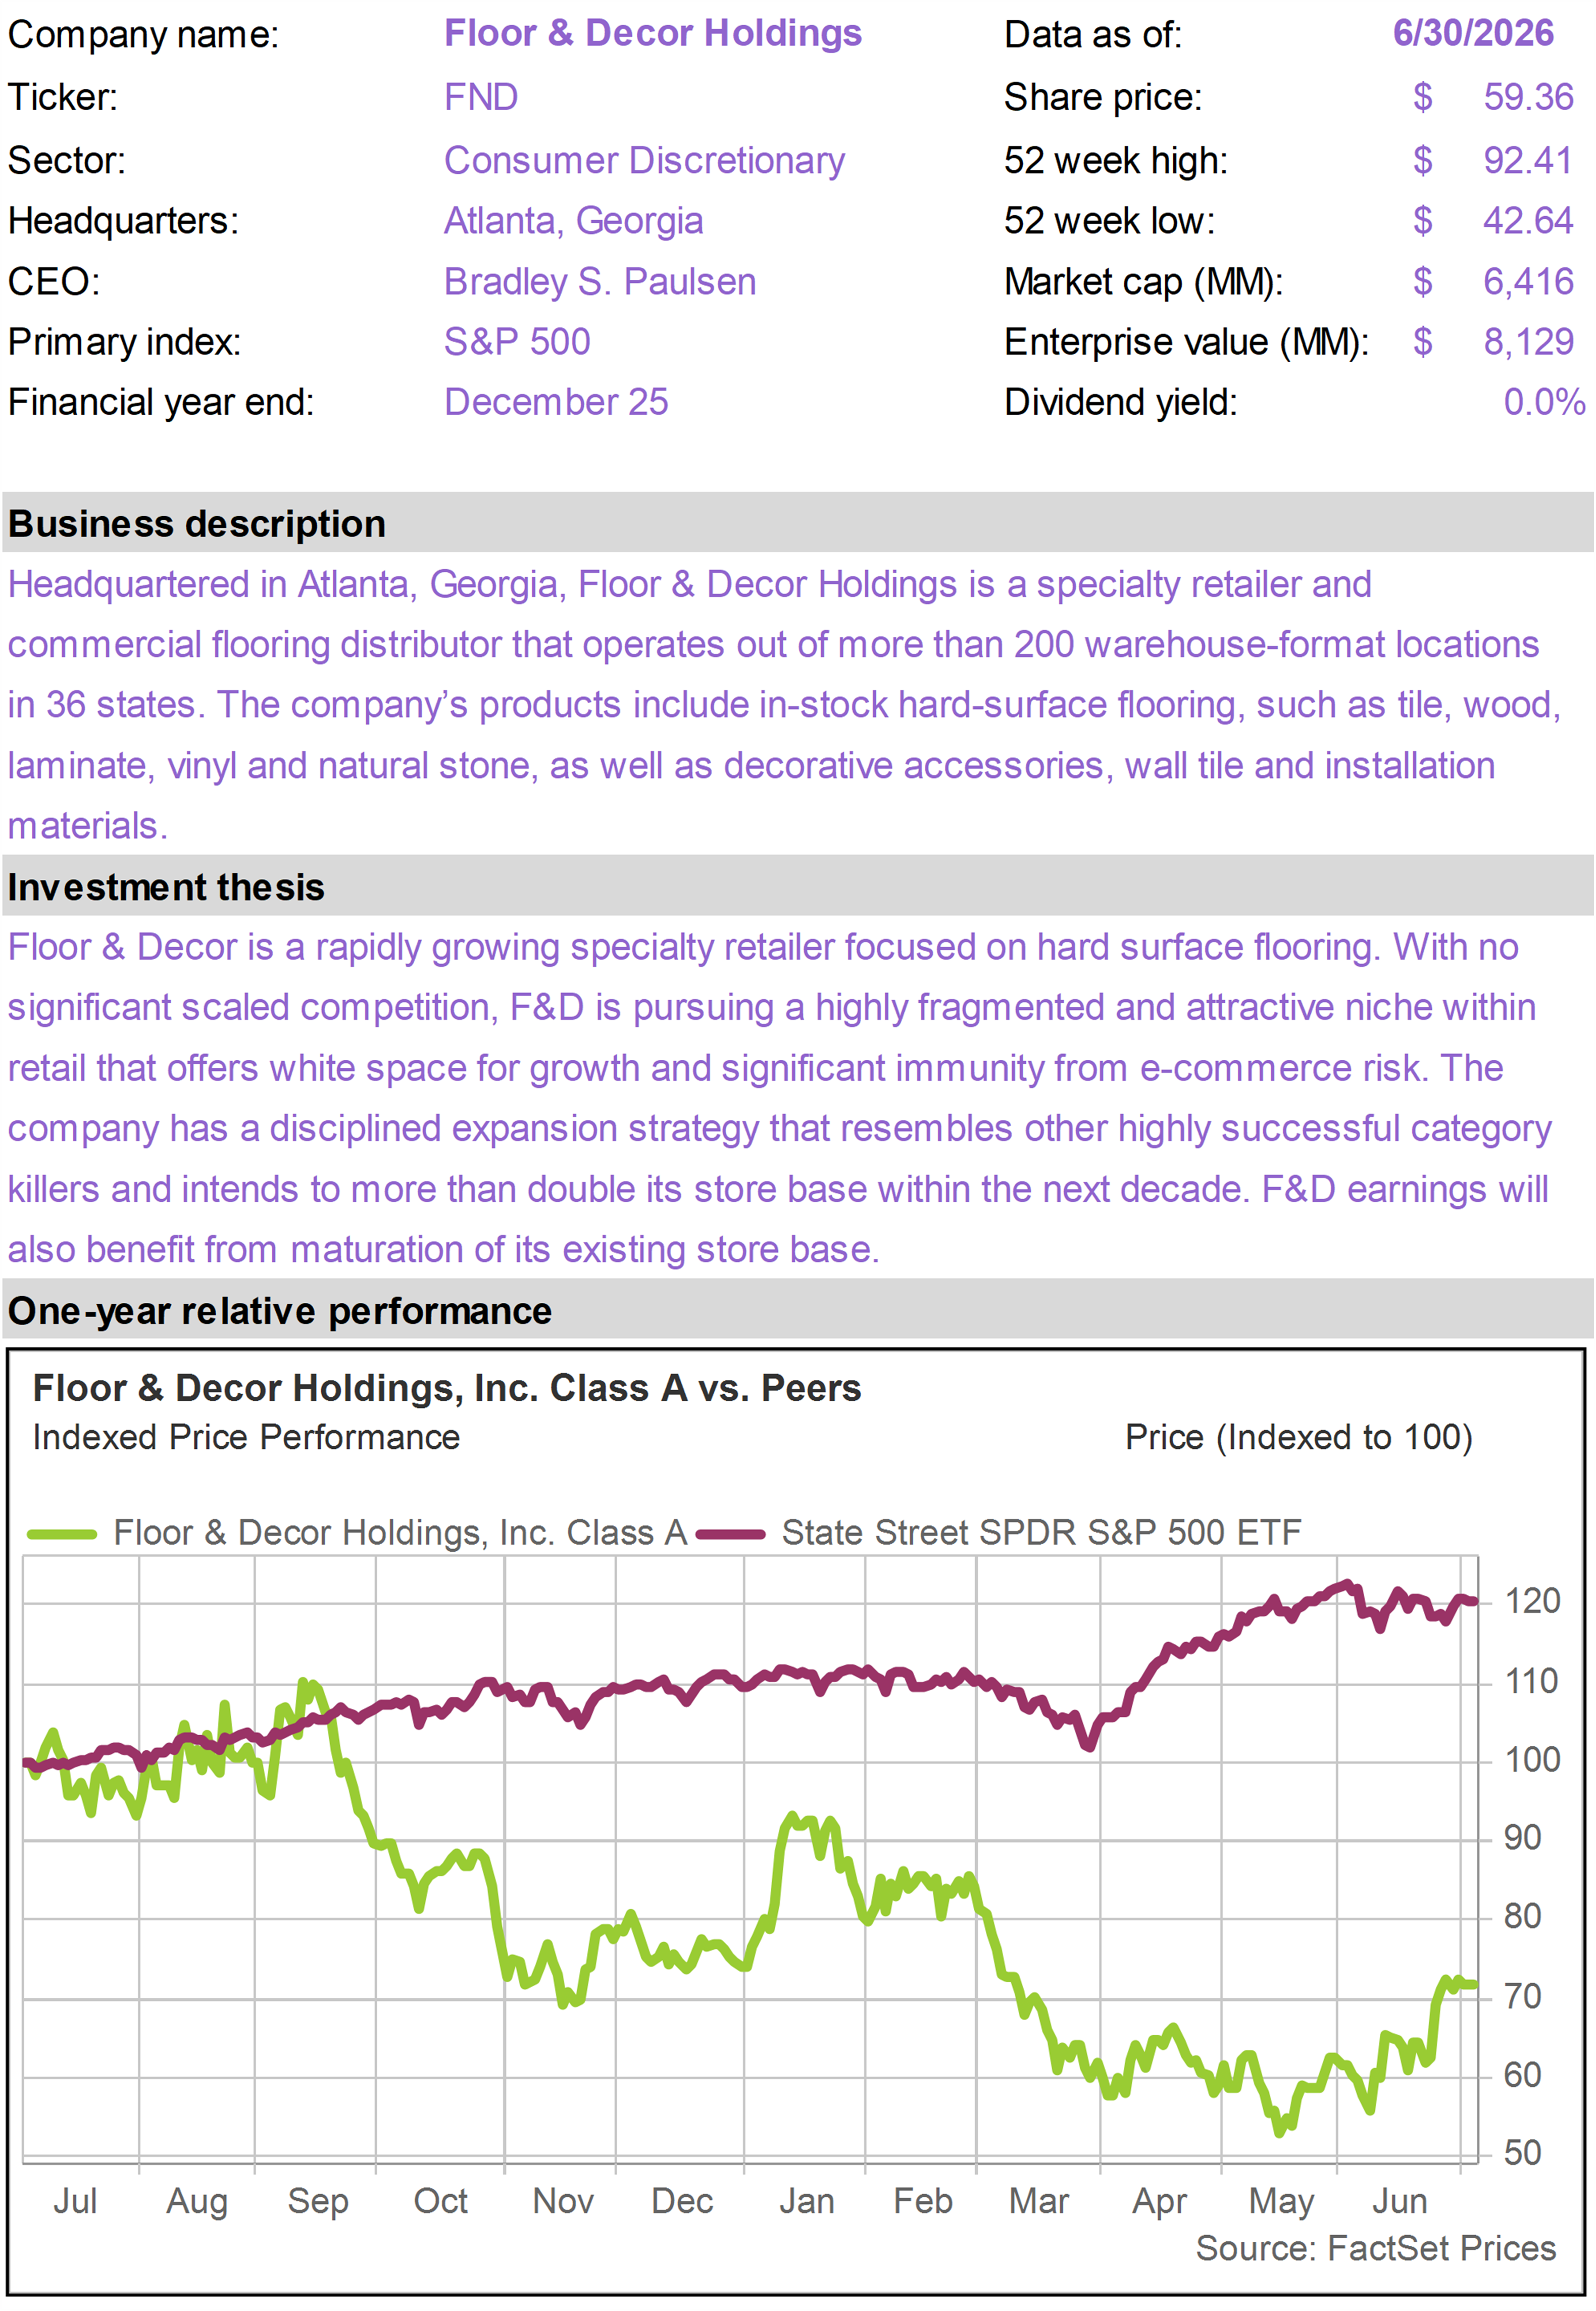
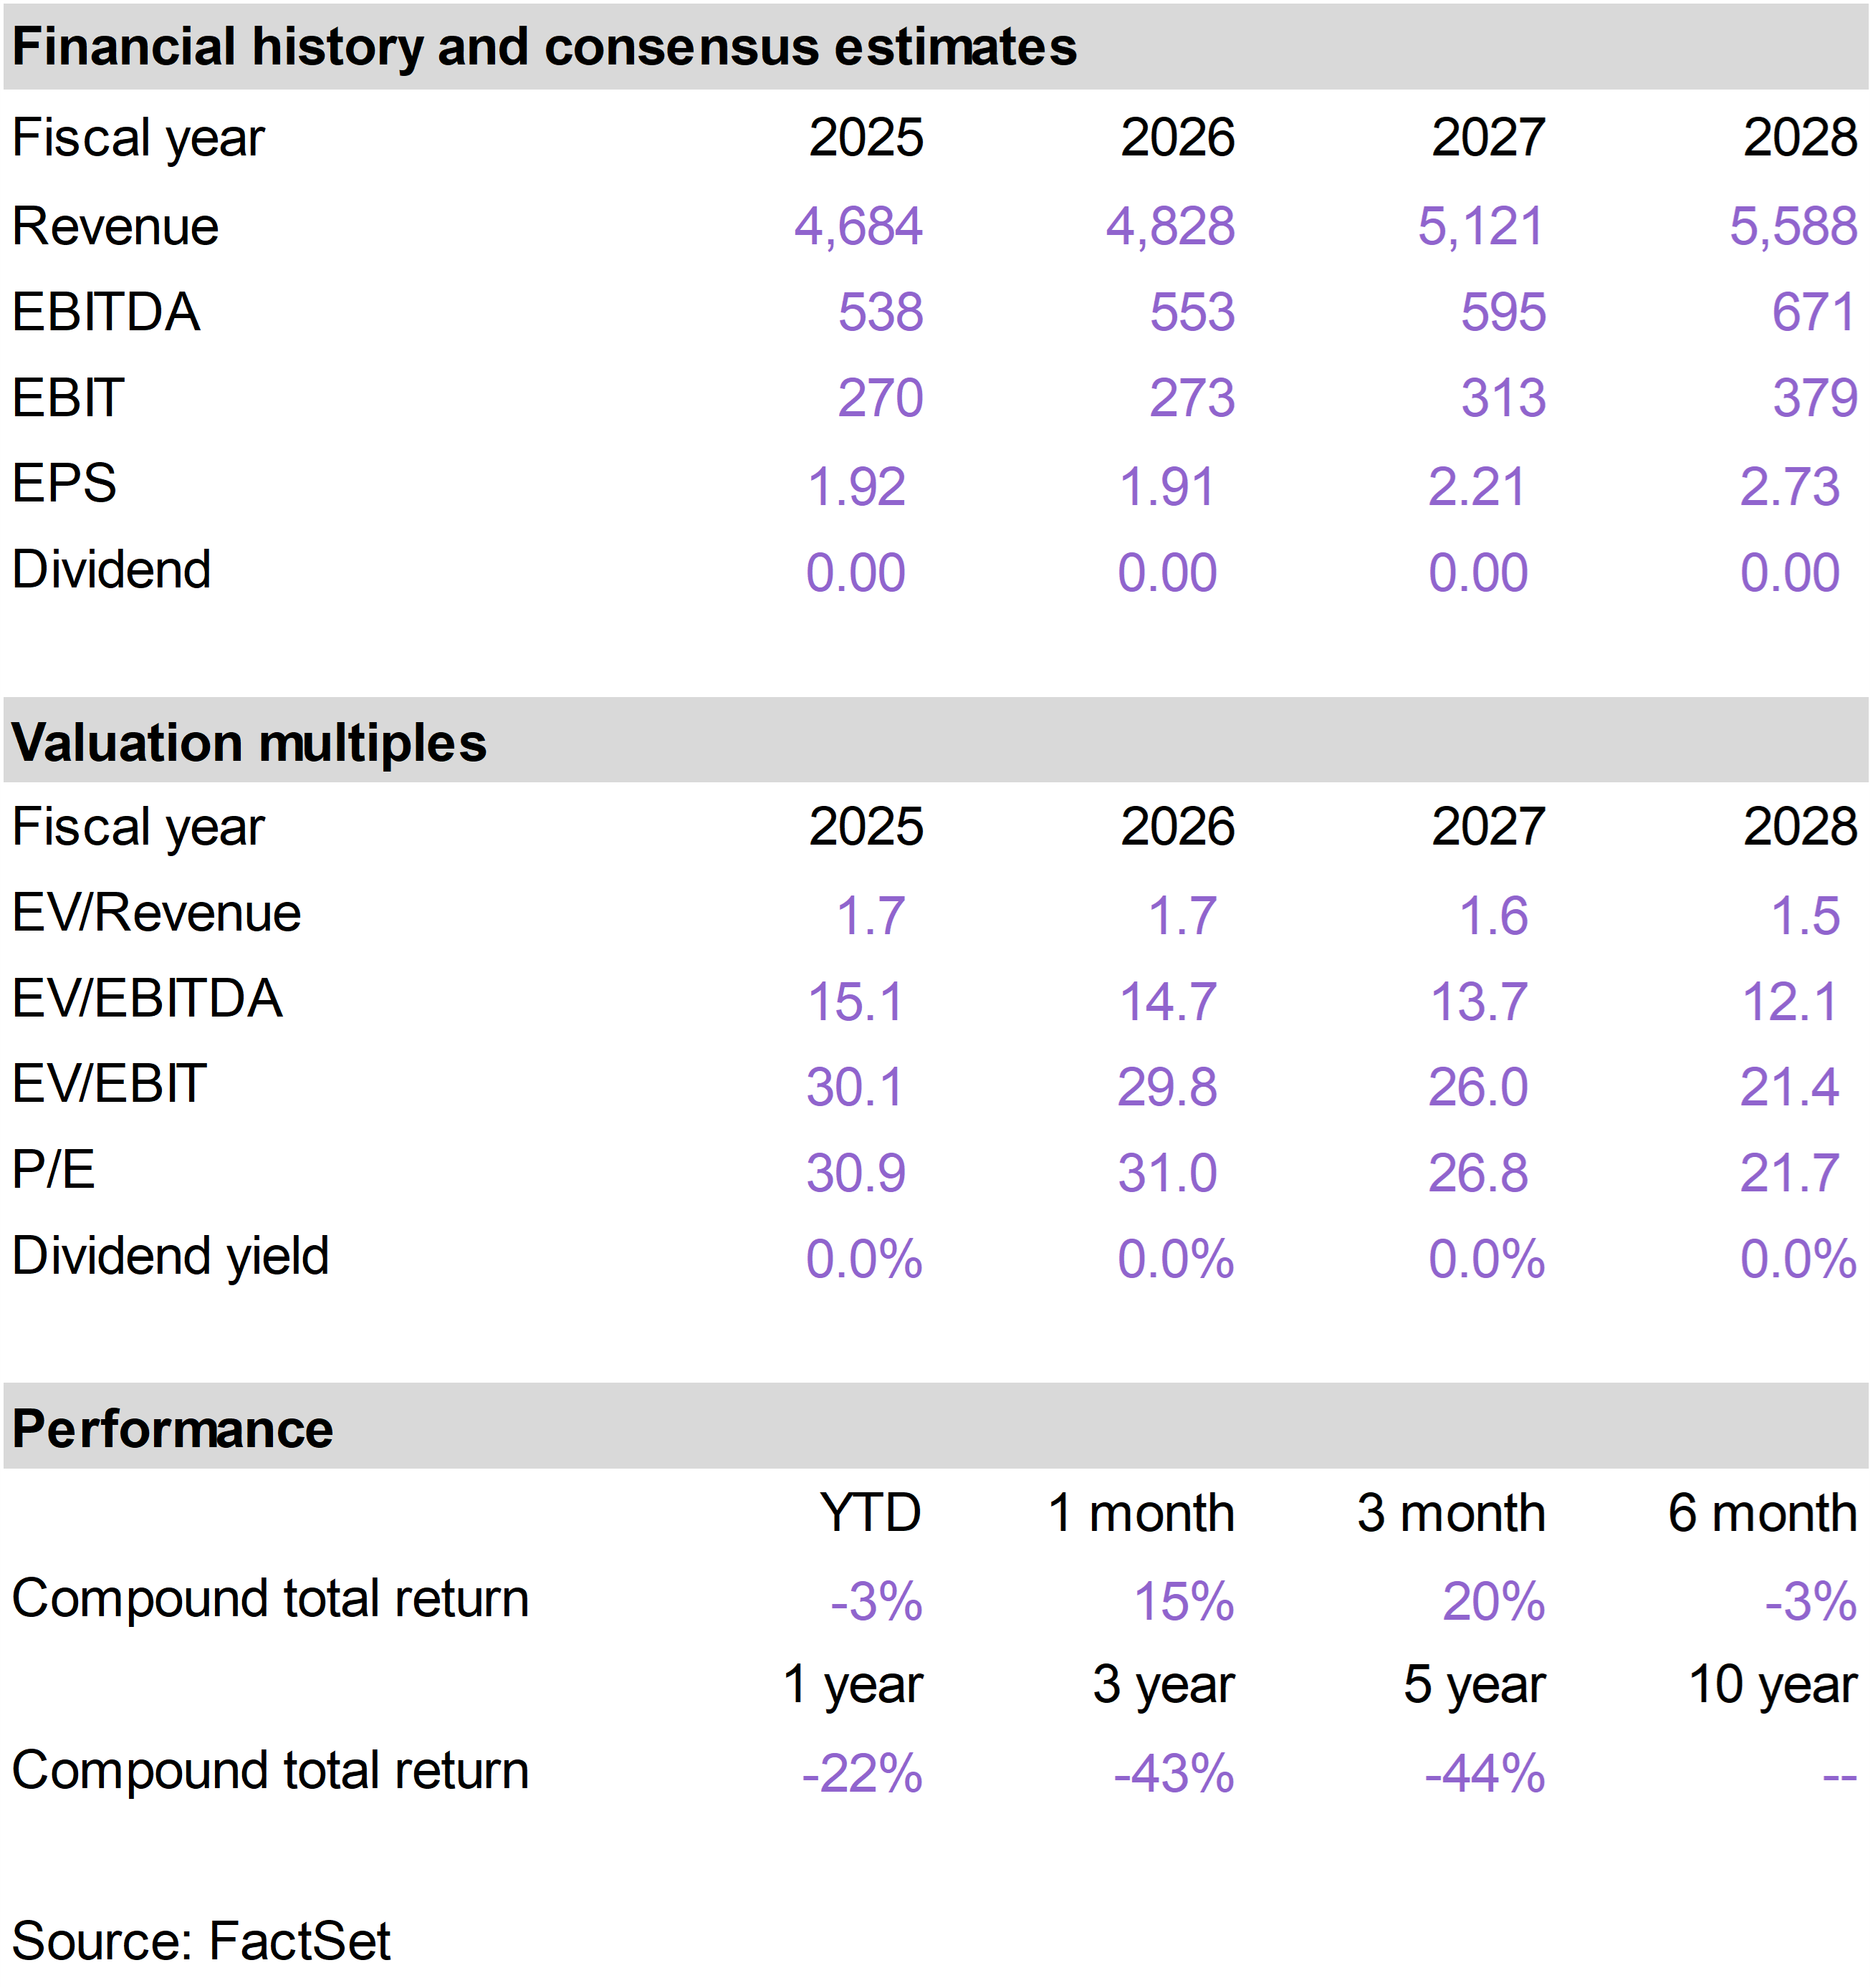
The top performing stocks in the Inflation Protection portfolio this month were Floor & Decor (FND), which returned 15%; Mid-America Apartment Communities (MAA), which returned 8%; and TransDigm (TDG), which returned 6%.
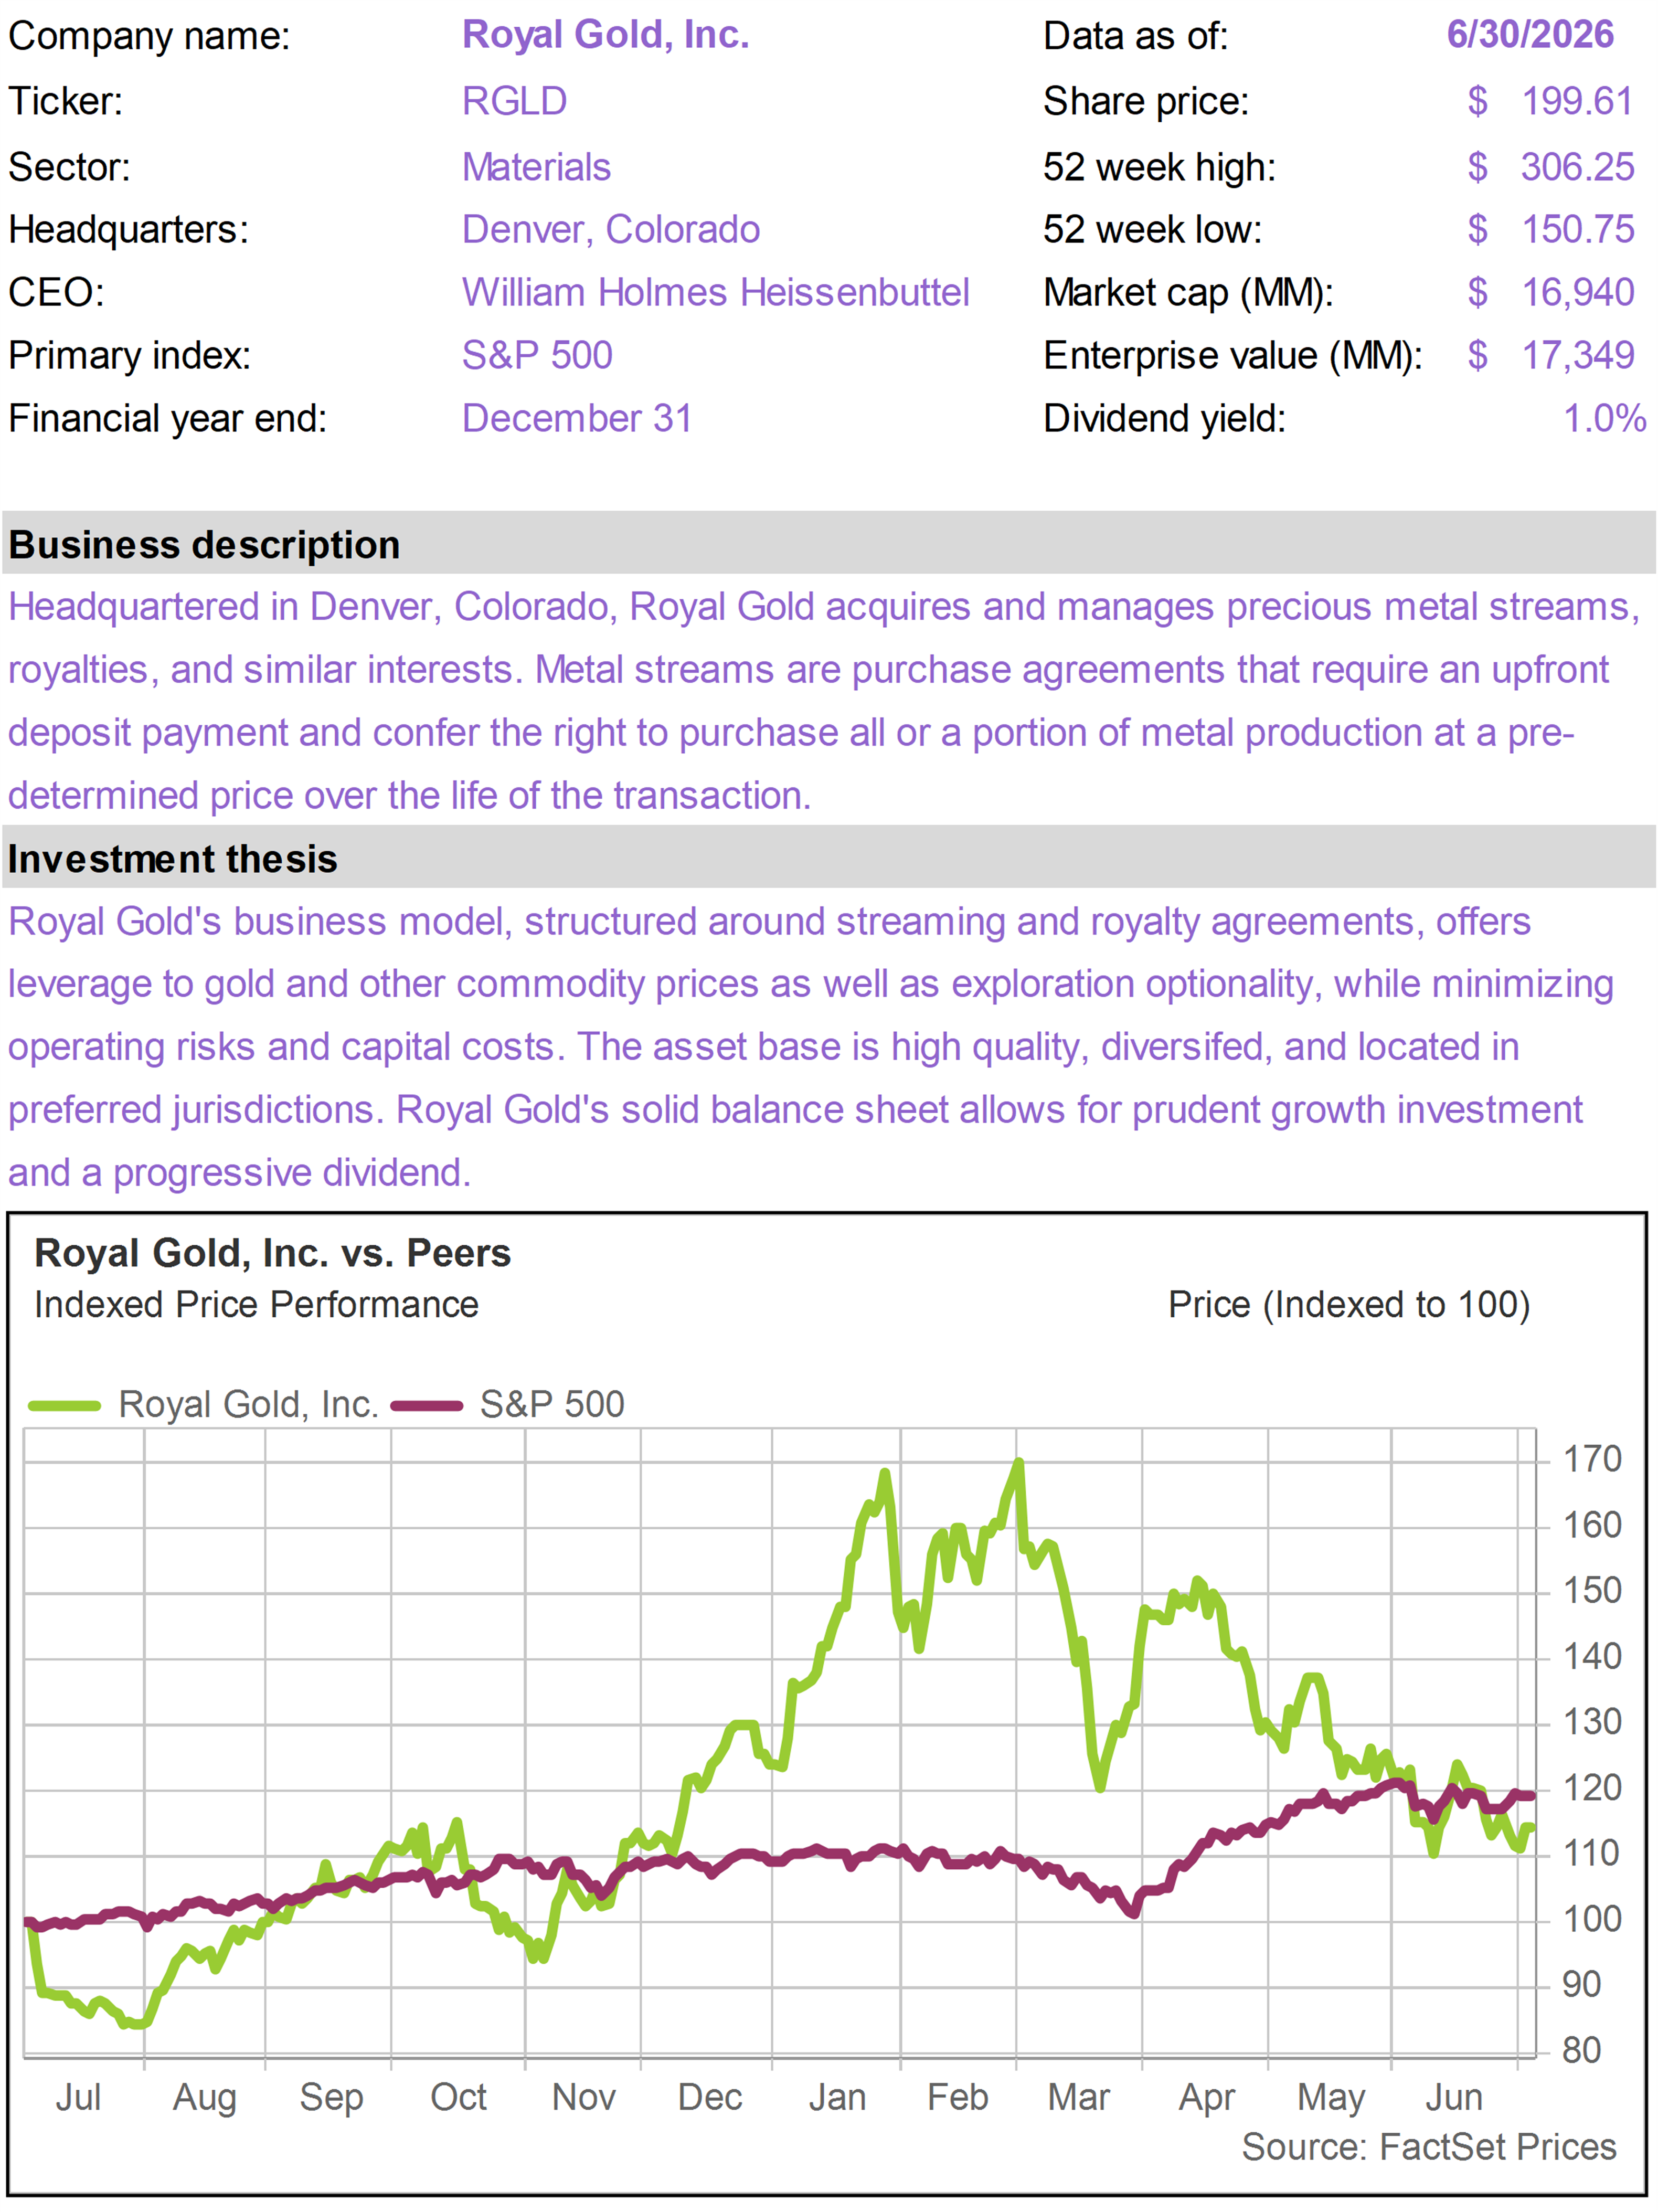
The worst performing stocks in the portfolio in June were Circle Internet Group (CRCL), which returned -45%; Wheaton Precious Metals (WPM), which returned -15%; and Royal Gold (RGLD), which returned -11%. |
|
| | FND performed well in June as investors began to look through the current housing downturn and recognize the potential for a powerful cyclical rebound.
As a leading specialty retailer of flooring, tile and related home improvement products, FND is highly exposed to residential repair and remodel activity, which has been unusually weak as high interest rates have reduced home sales, suppressed household mobility, and delayed larger discretionary home projects.
The flooring market has been through a deep multi-year downturn. As housing activity eventually normalizes, however, FND stands to benefit from substantial pent-up demand.
When homeowners delay moves, renovations, or replacement projects, demand for flooring is often deferred rather than permanently destroyed. A recovery in housing turnover, consumer confidence, or remodeling activity could therefore translate into a meaningful rebound in traffic and comparable-store sales.
The company has continued to improve the business during the downturn. Management remains committed to its long-term goal of 500 stores but is taking a more disciplined approach to new store productivity.
Gross margins have expanded despite weak same-store sales, helped by sourcing changes and operational discipline. Improved cost control means FND may now be able to generate operating leverage at lower levels of comparable-sales growth than it historically required.
The current environment remains difficult, but the stock had already discounted a great deal of bad news. If pent-up flooring and remodeling demand begins to normalize, FND has the potential to benefit from a combination of improving comps, better new-store productivity, and meaningful operating leverage. |
|
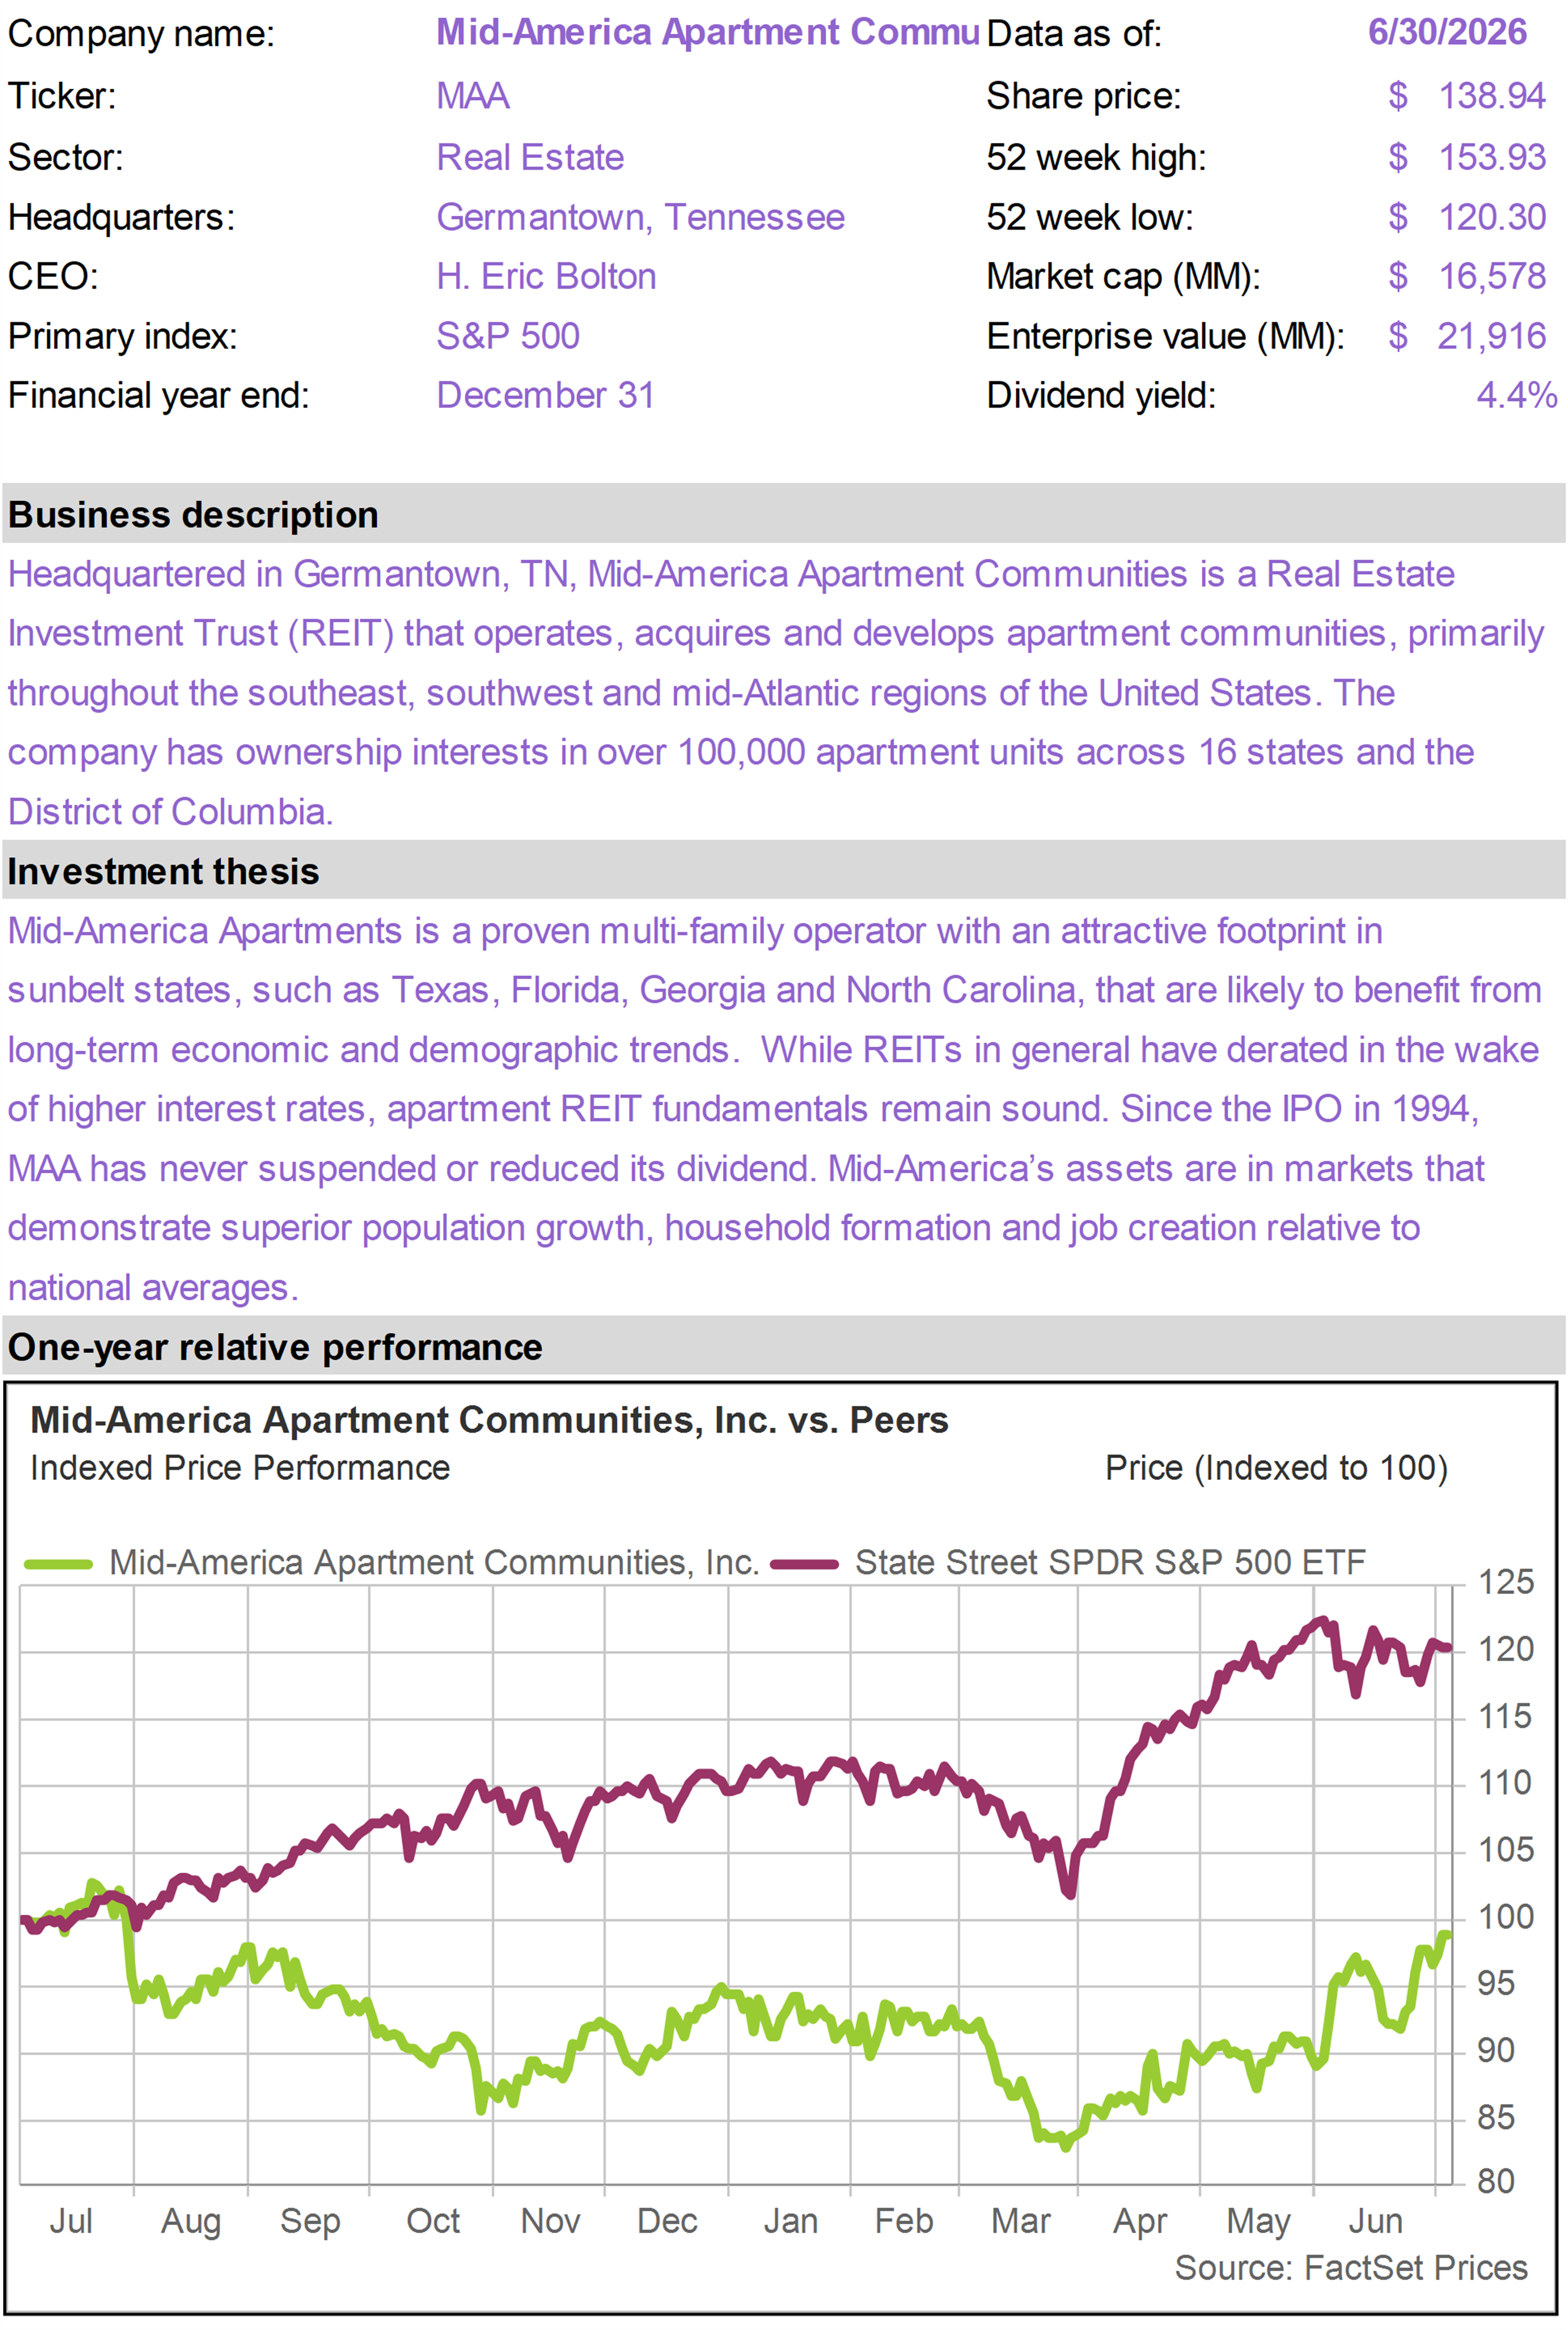
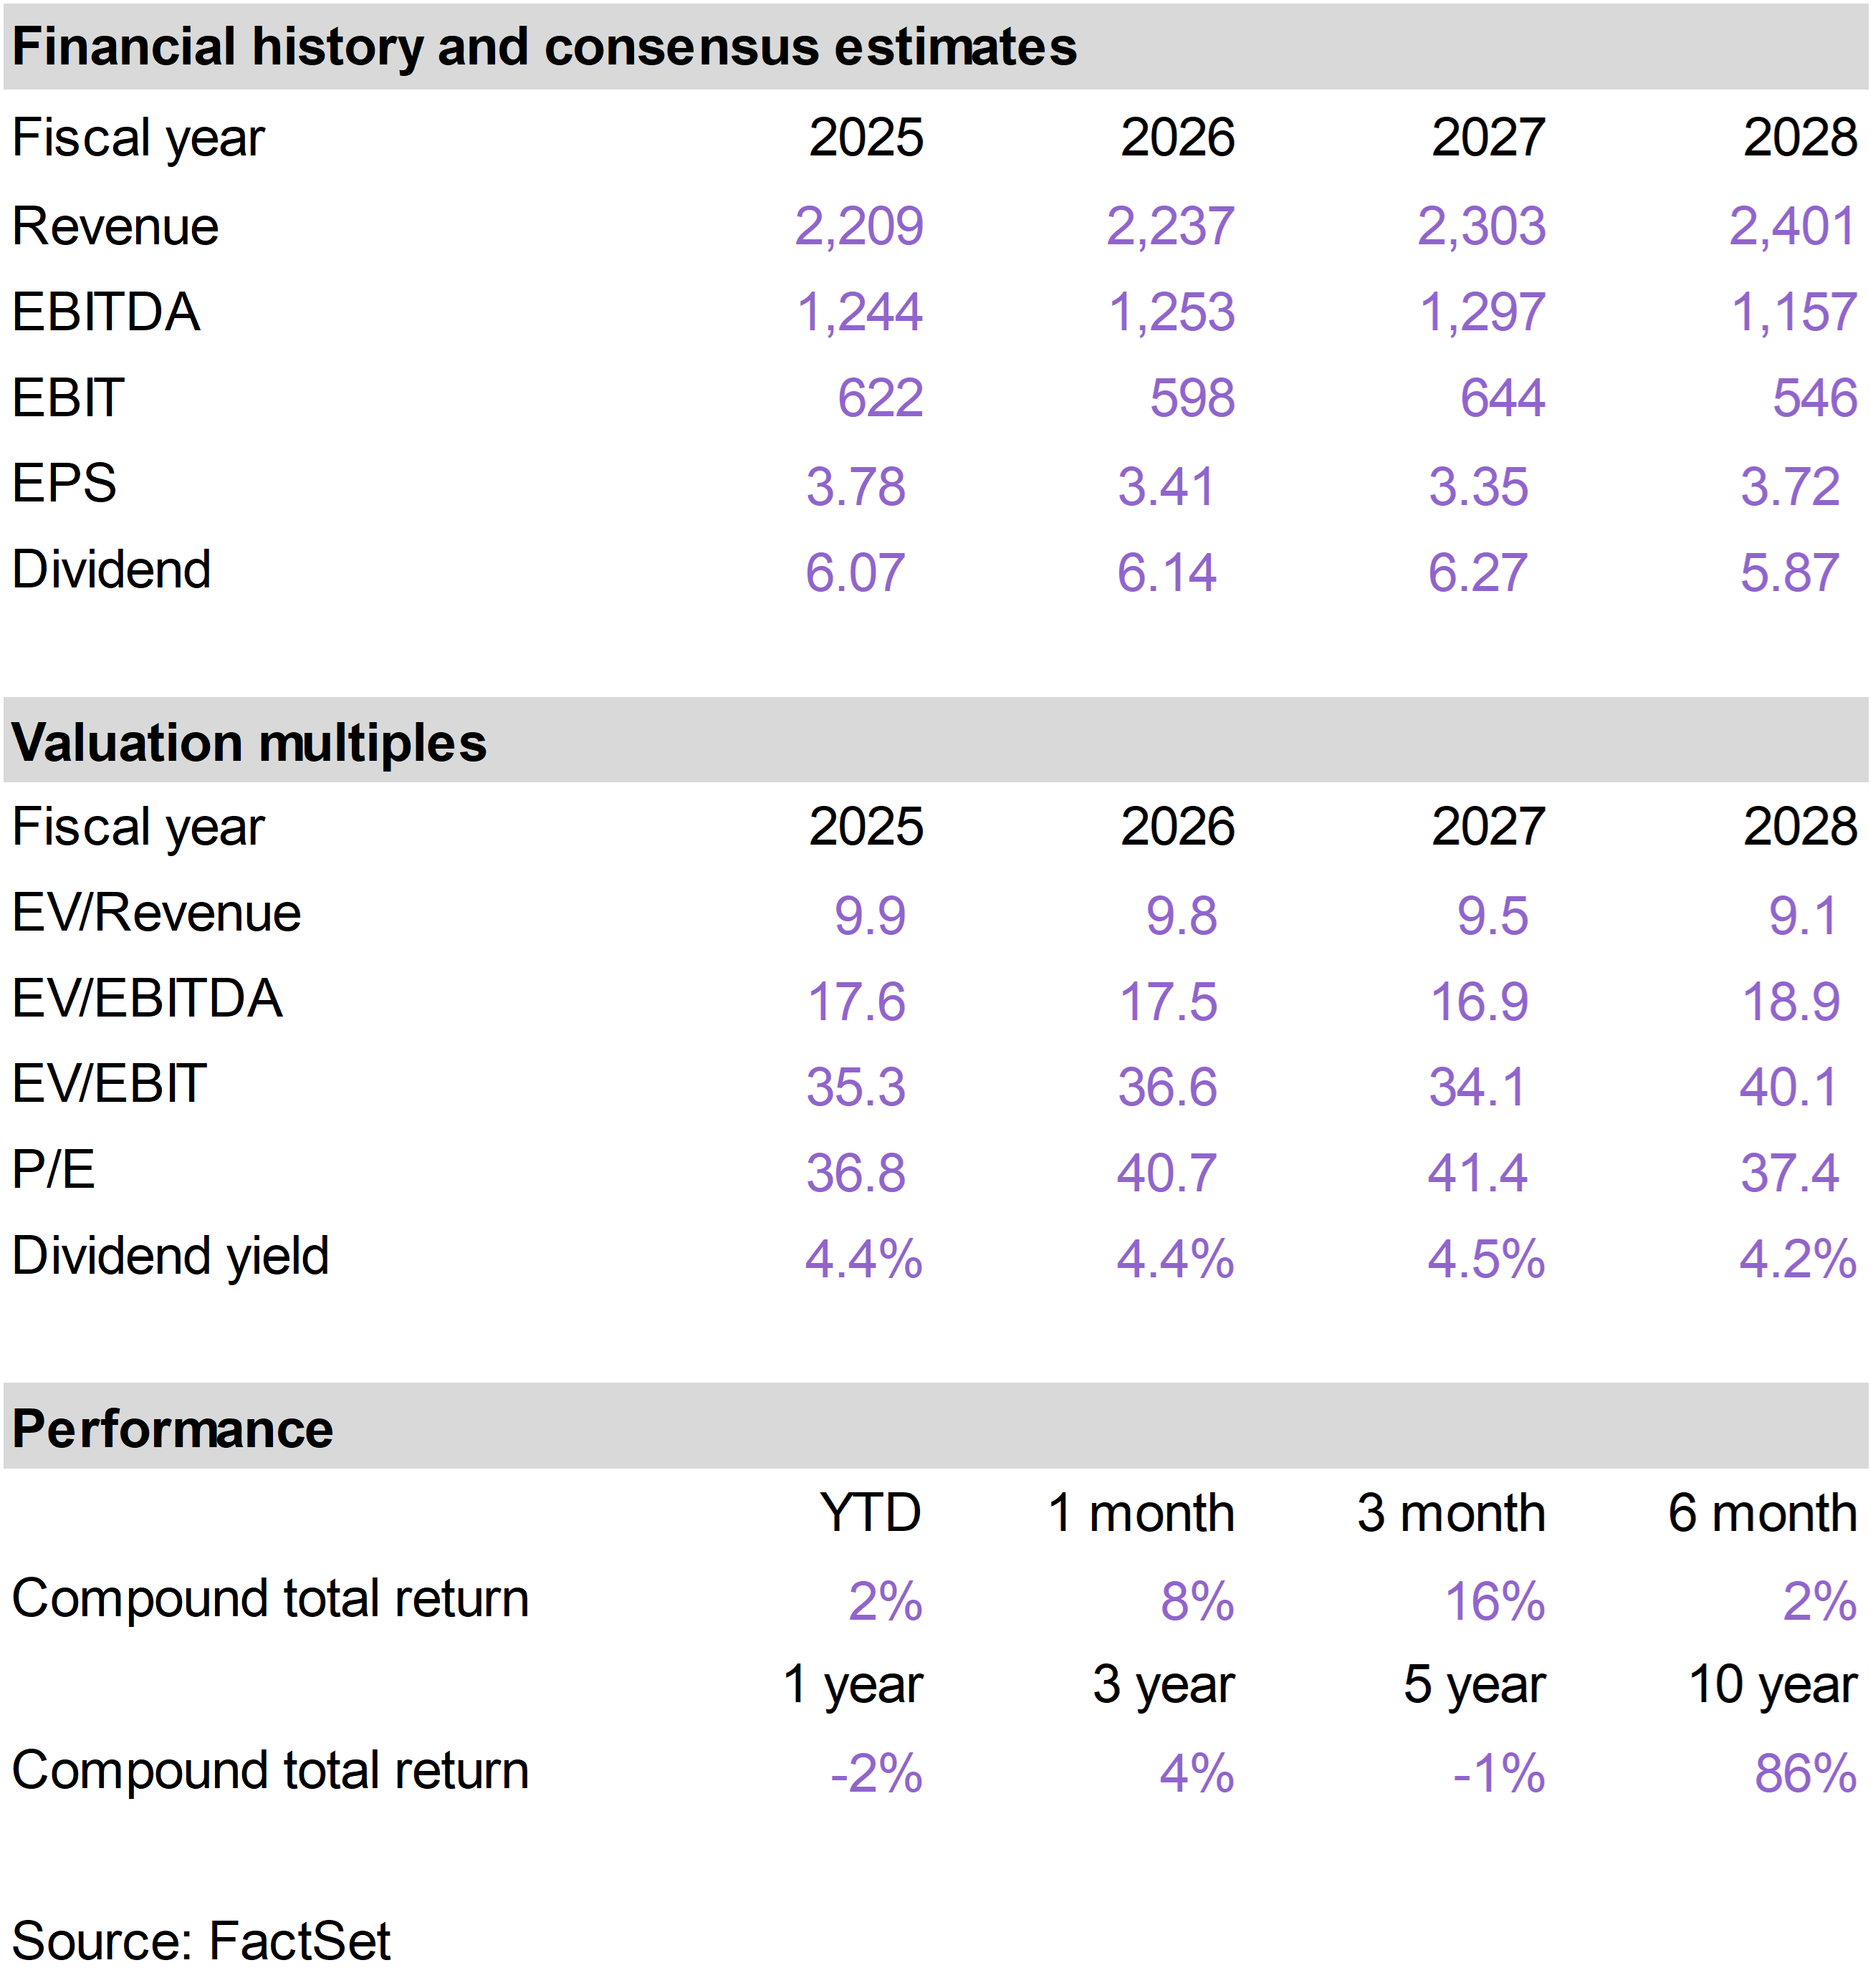
| | Shares of MAA saw upside this month as the market began to look through near-term Sunbelt apartment supply pressure and focus on improving fundamentals, attractive valuation, and the company’s strong balance sheet.
MAA is one of the largest apartment REITs in the United States, with a portfolio concentrated in Sunbelt and Southeast markets. These markets have been pressured by elevated new apartment supply, but they also continue to benefit from long-term population growth, household formation, job growth, and migration trends.
The key issue for MAA has been timing. New supply has weighed on rent growth, especially in Sunbelt markets, but recent data suggest the worst of the pressure may be starting to ease.
In the first quarter, MAA reported five consecutive quarters of improving year-over-year blended rent performance, with absorption outpacing deliveries and renewal pricing strengthening. Resident retention also remained very strong, with trailing twelve-month turnover at a record low.
MAA also benefited from its balance sheet and capital allocation flexibility. The company has low leverage and continued to repurchase shares earlier in the year.
MAA offers a combination of current income (approximately 4.5% dividend yield), balance sheet strength, and eventual recovery in Sunbelt apartment fundamentals. The stock does not require an immediate boom in rents to work. It needs evidence that supply pressure is peaking, demand remains healthy, and rent growth can gradually improve into 2027. |
|
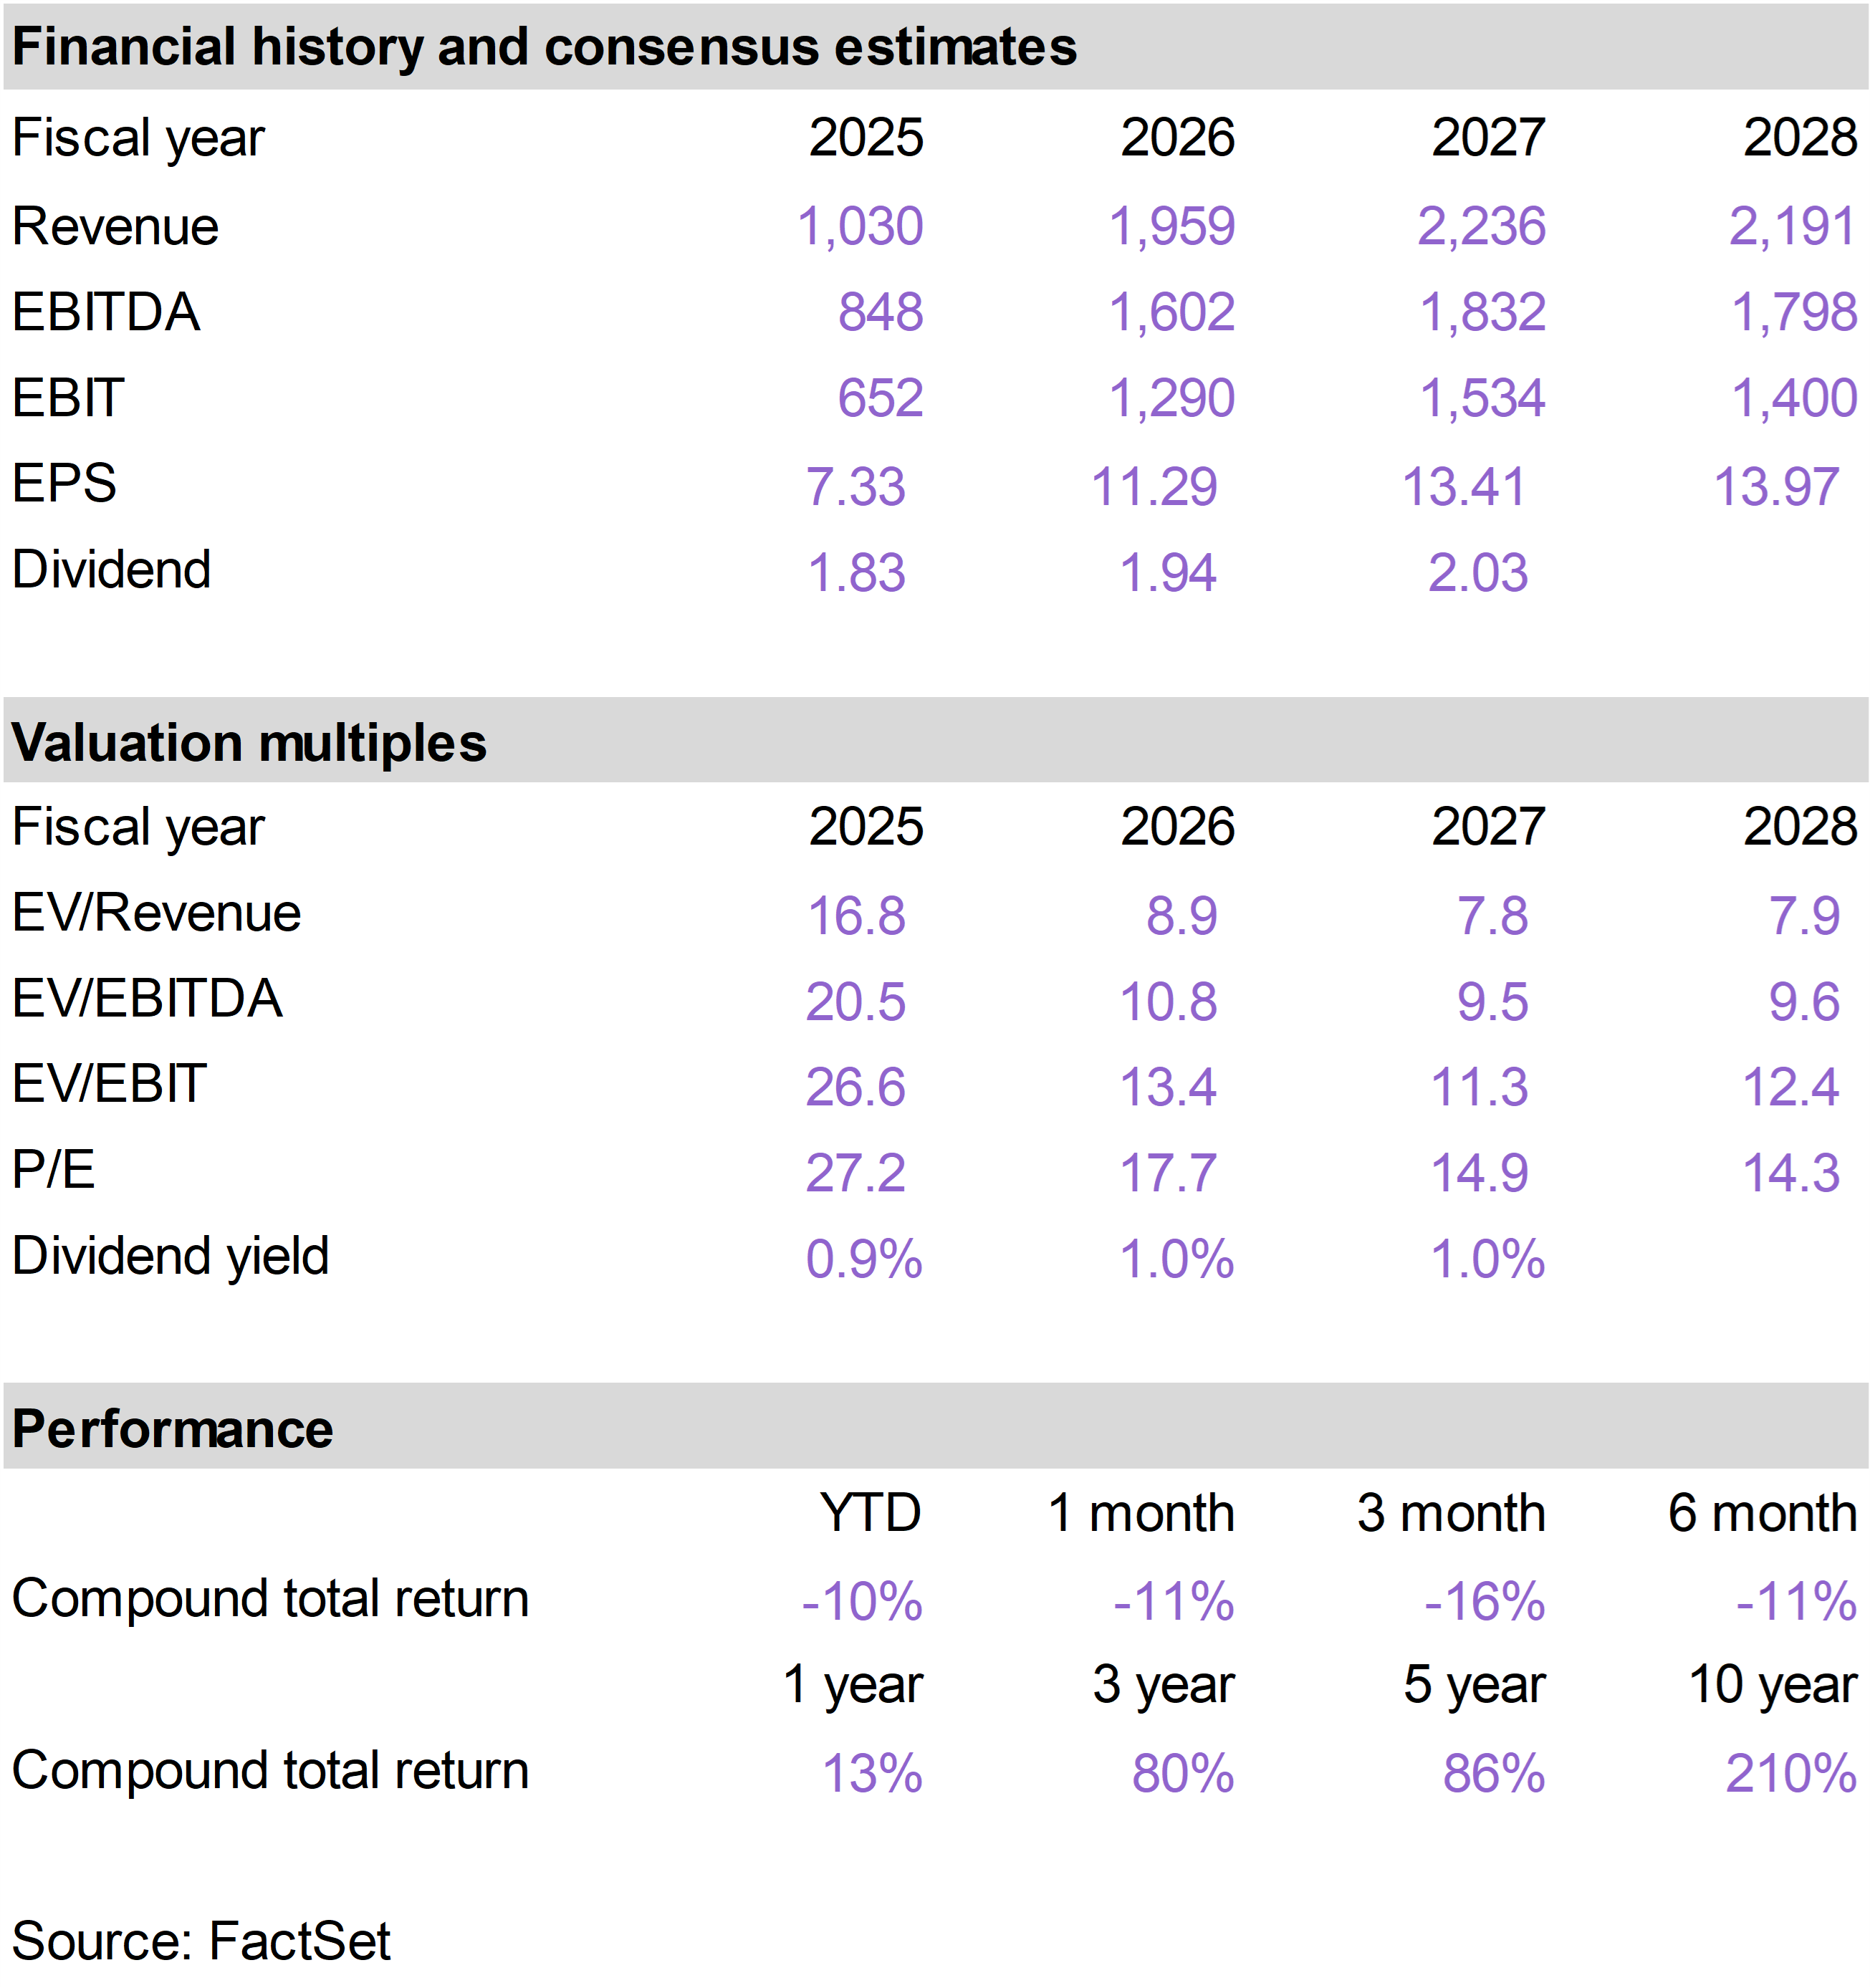
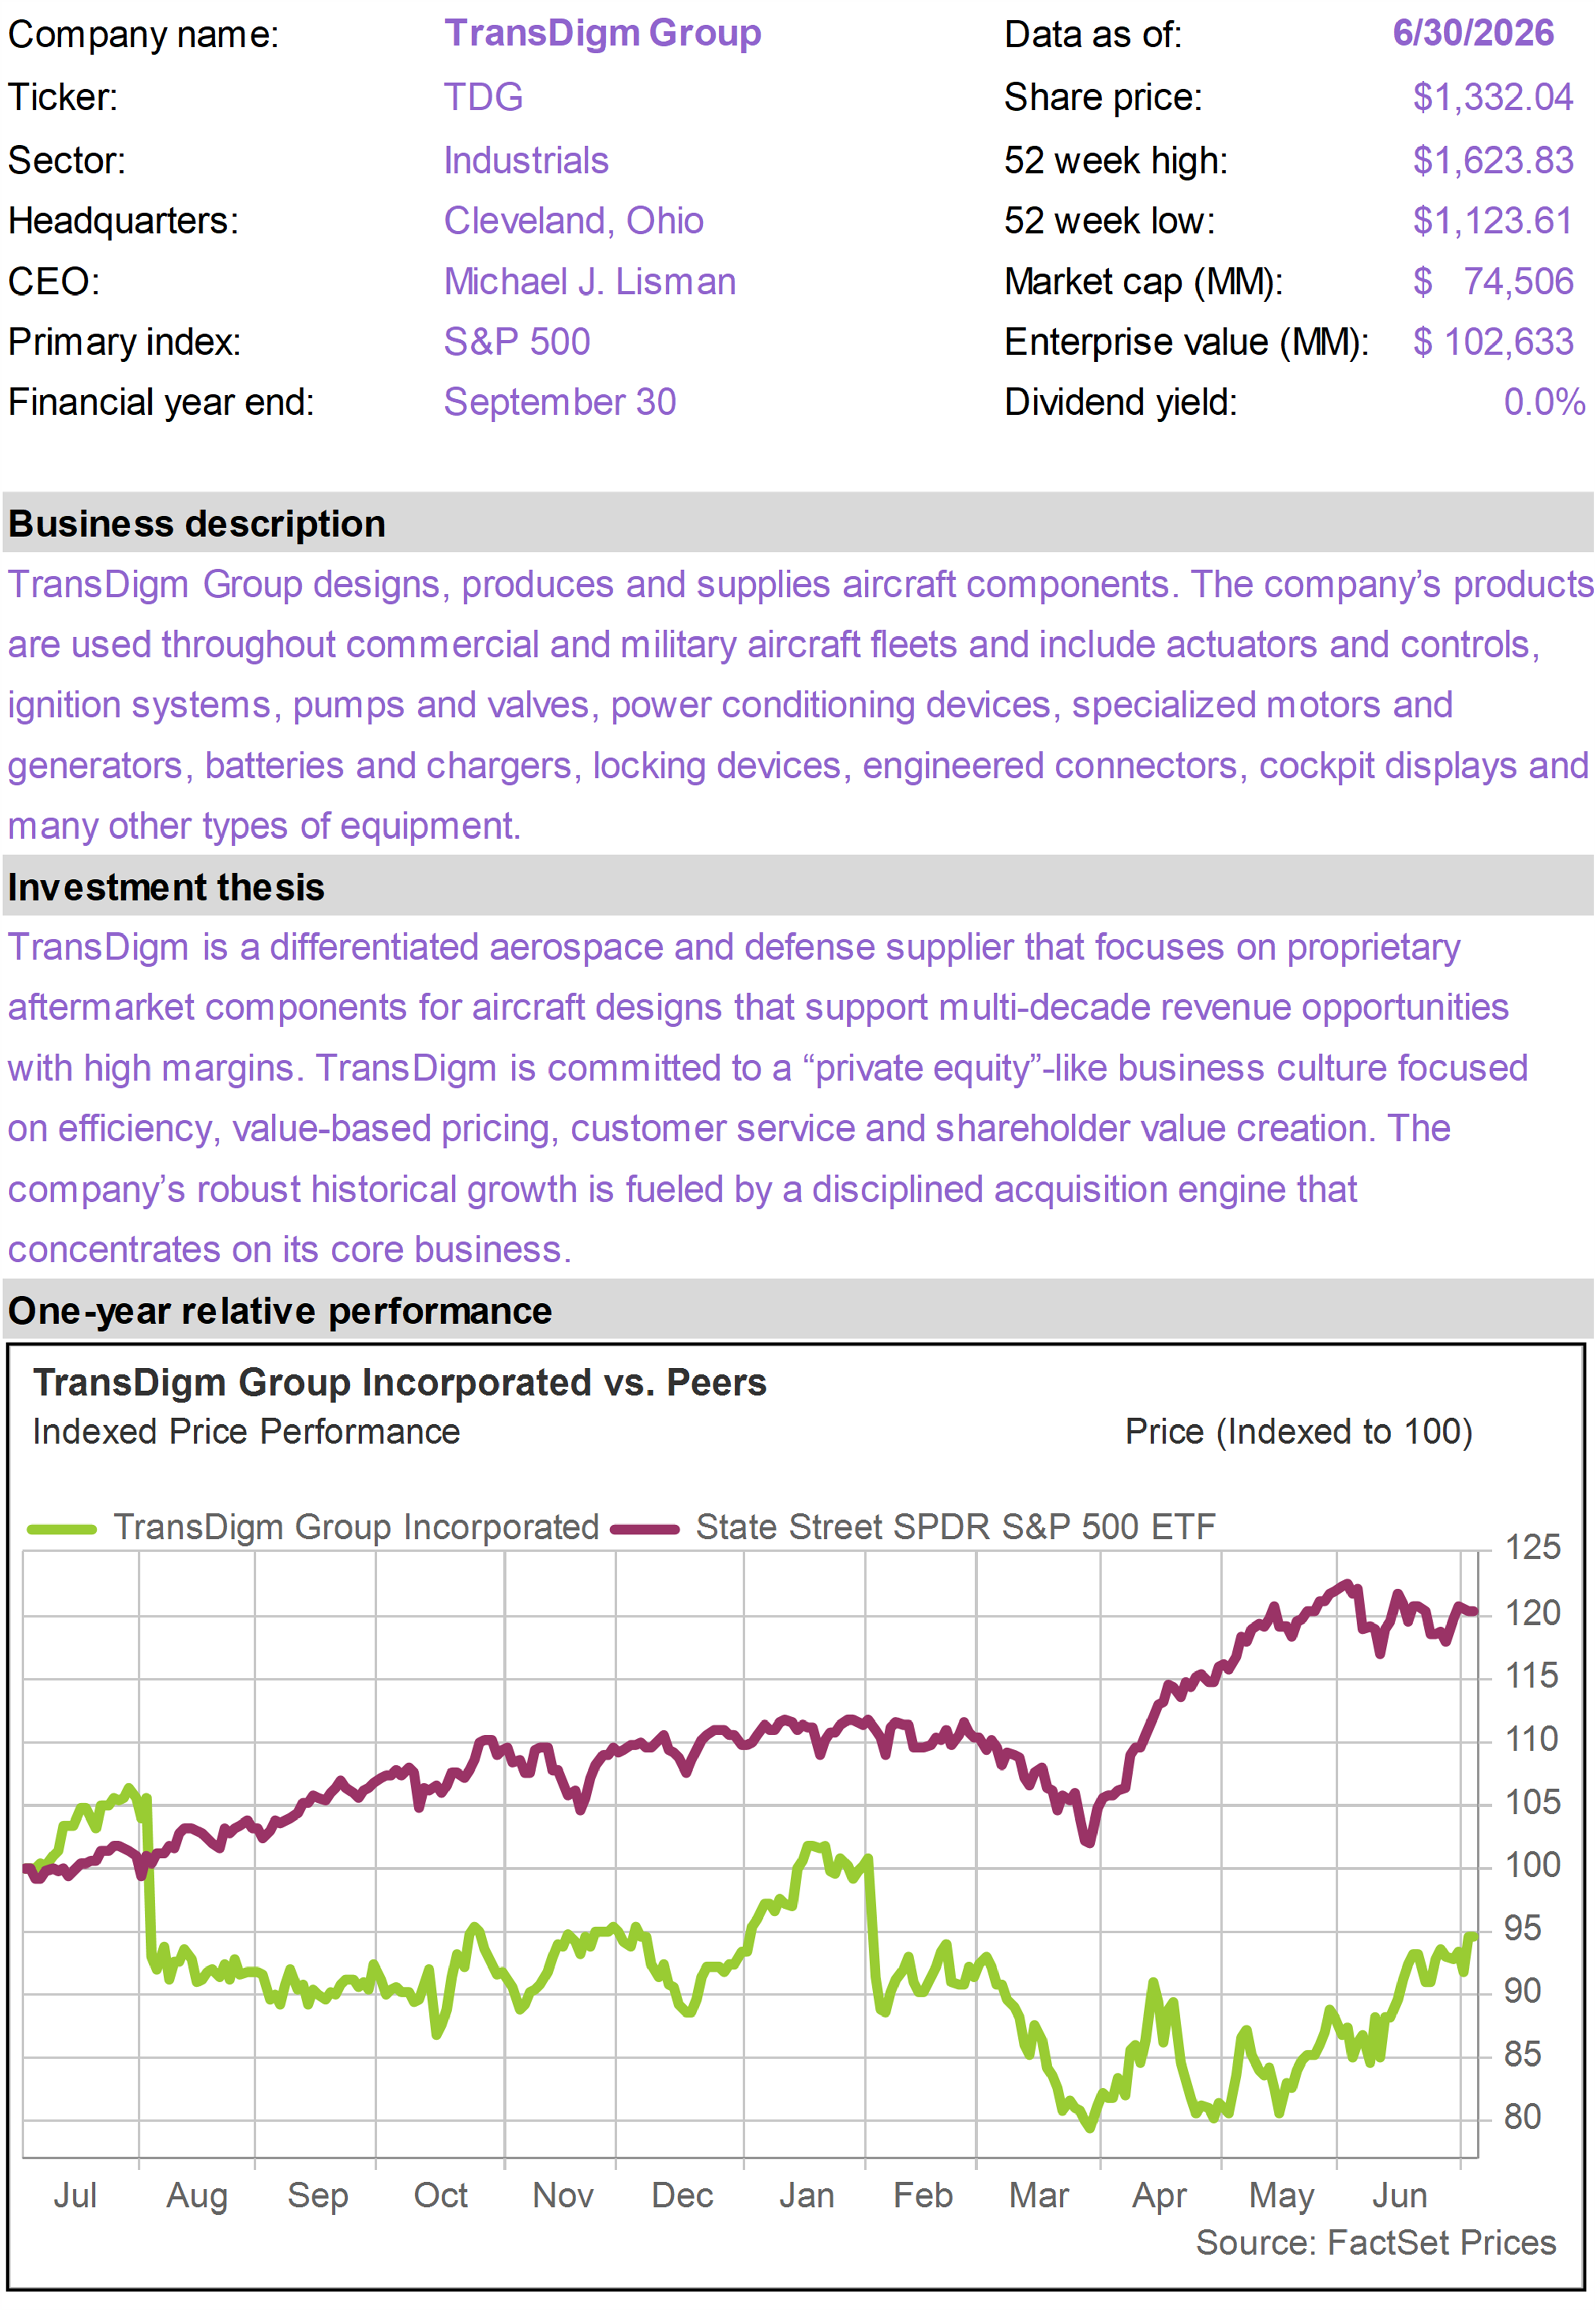
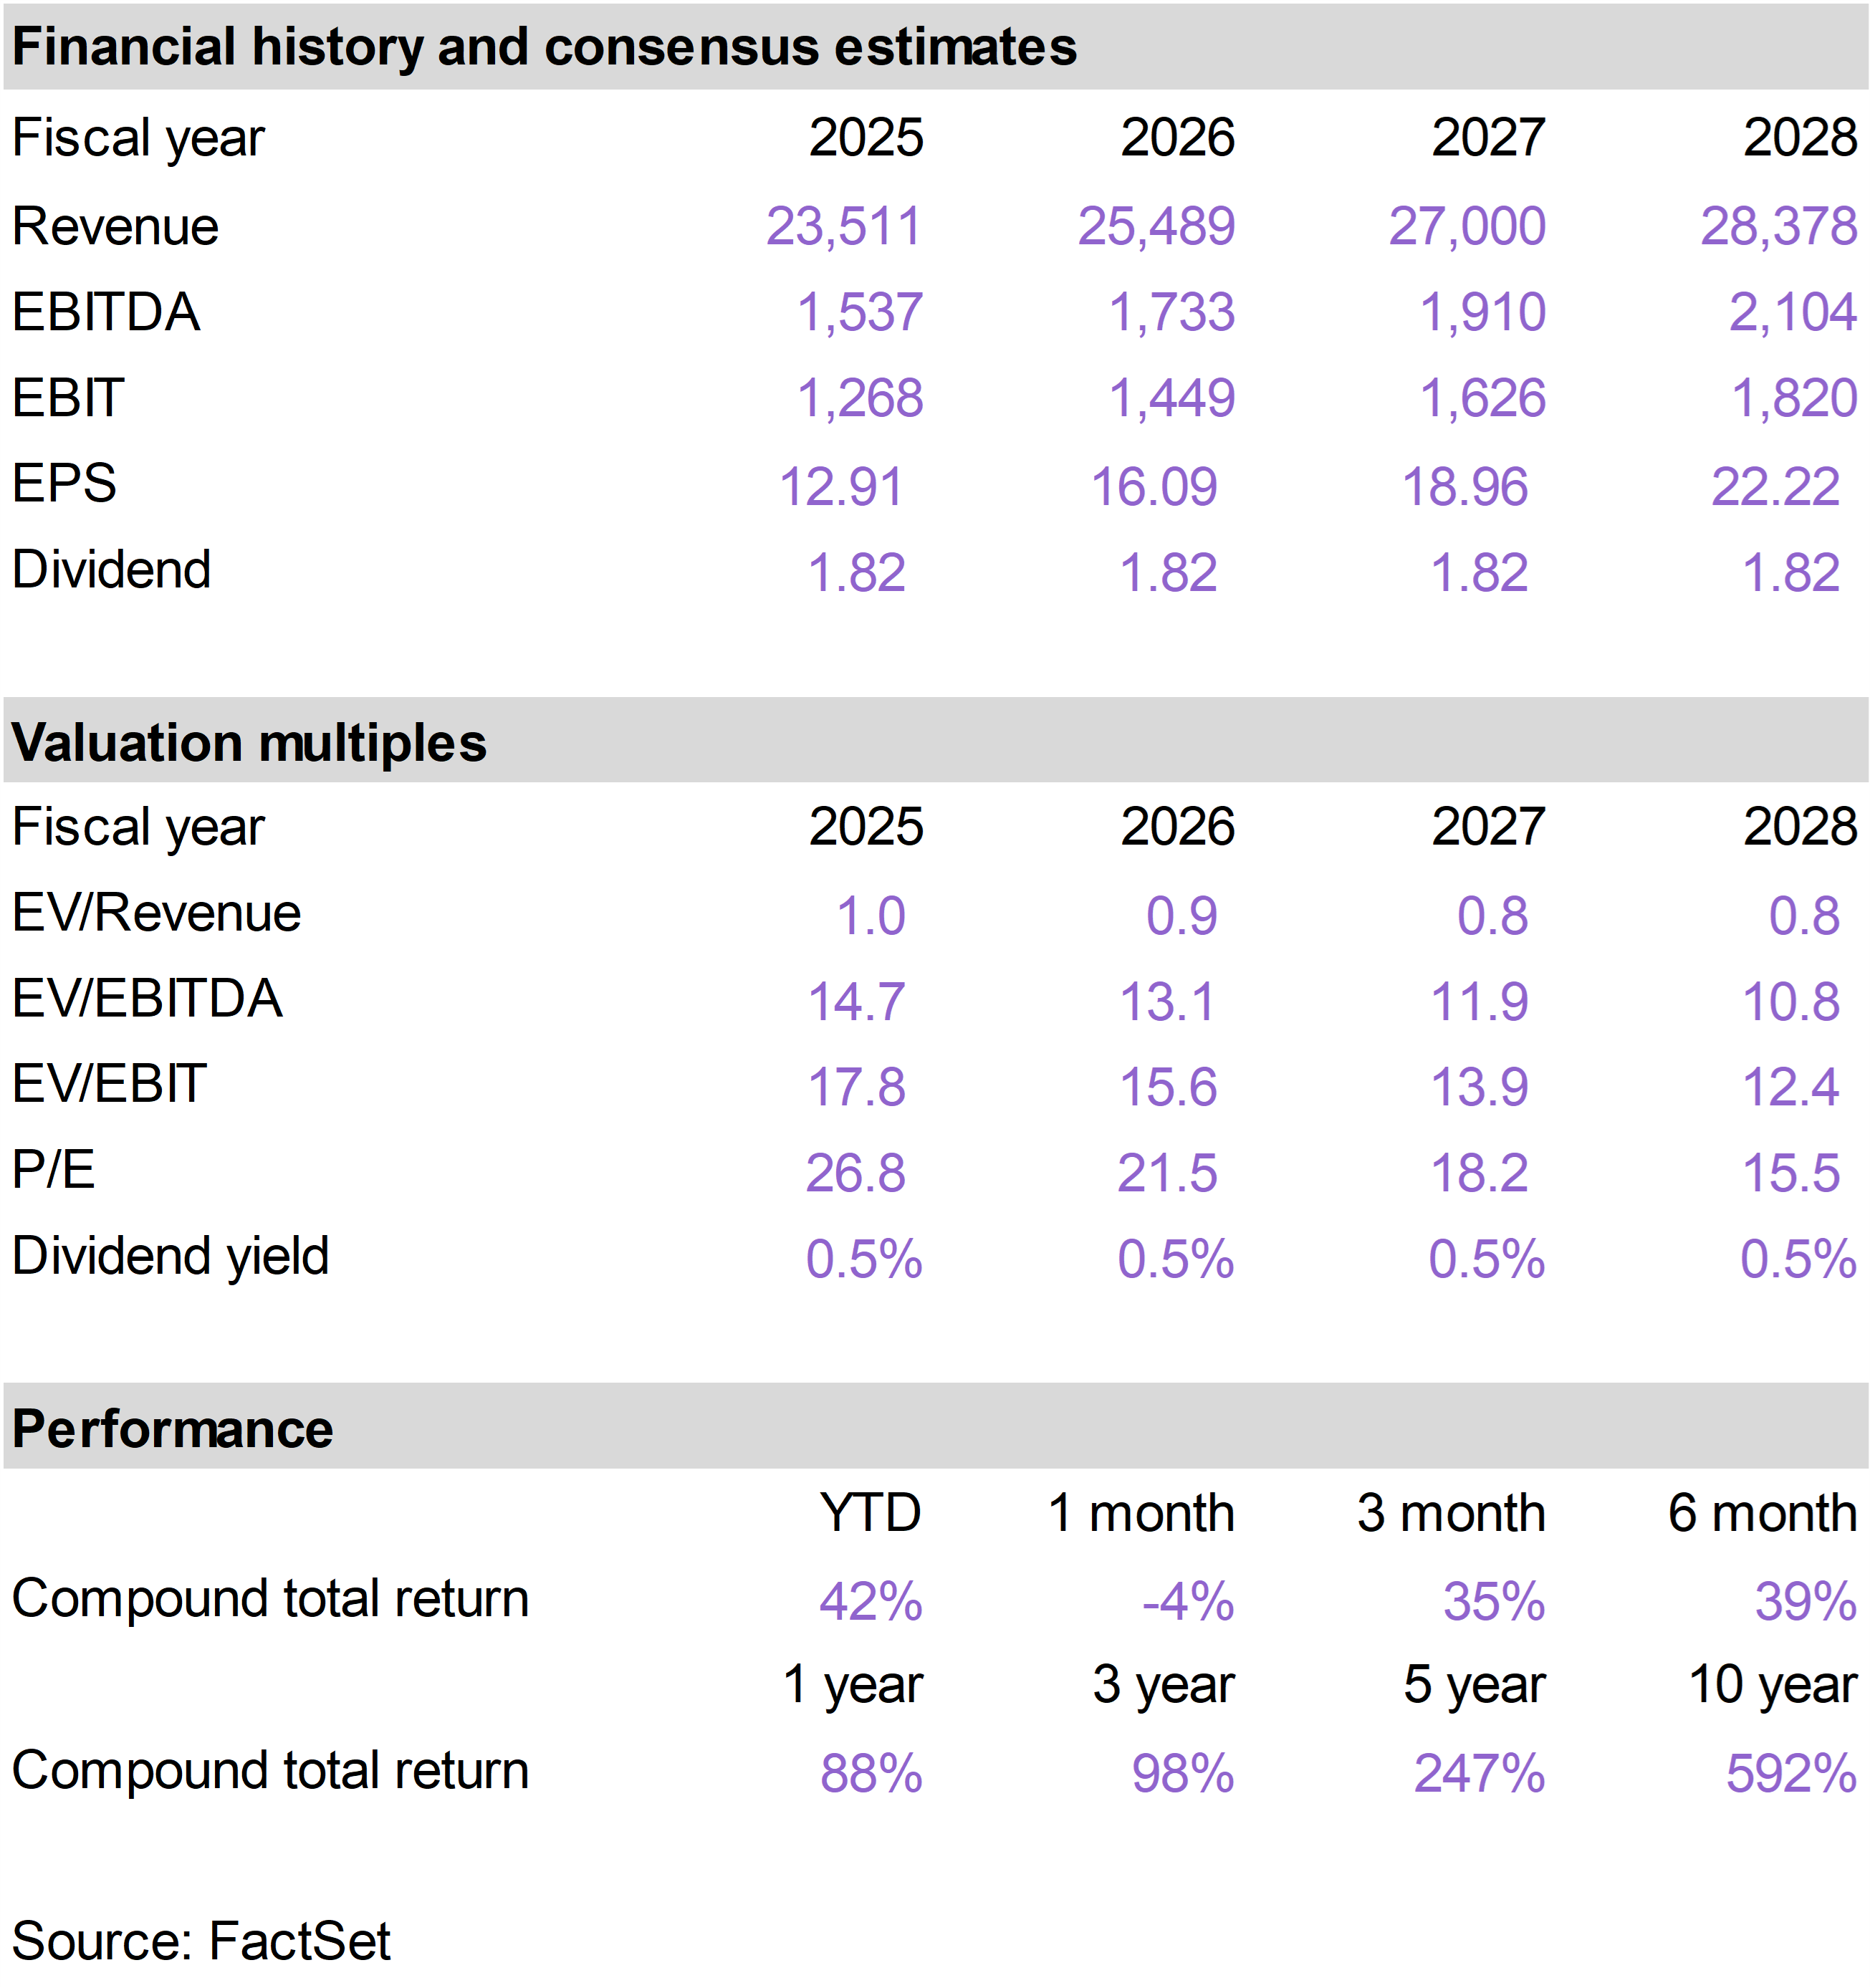
| | In June, investors rewarded TDG’s continued top-line strength, improving aerospace aftermarket demand, and proven ability to compound value through pricing, margins, acquisitions, and capital allocation.
As a leading aerospace components supplier focused on proprietary aircraft parts, the company’s business model is especially attractive because a large portion of revenue comes from aftermarket demand, where replacement parts are mission-critical, competition is limited, and margins are structurally high.
The June strength was supported by improving expectations for the business, with broad-based sales strength across end markets, including acceleration in the aftermarket. Bookings exceeded shipments across commercial original equipment, commercial aftermarket, and defense.
The aftermarket remains the key part of the investment case. As global air travel continues to recover and aircraft utilization rises, airlines need more replacement parts, repairs, and maintenance. That creates a powerful tailwind for TDG because aftermarket revenue tends to carry higher margins and greater pricing power than original equipment sales. |
|
| |
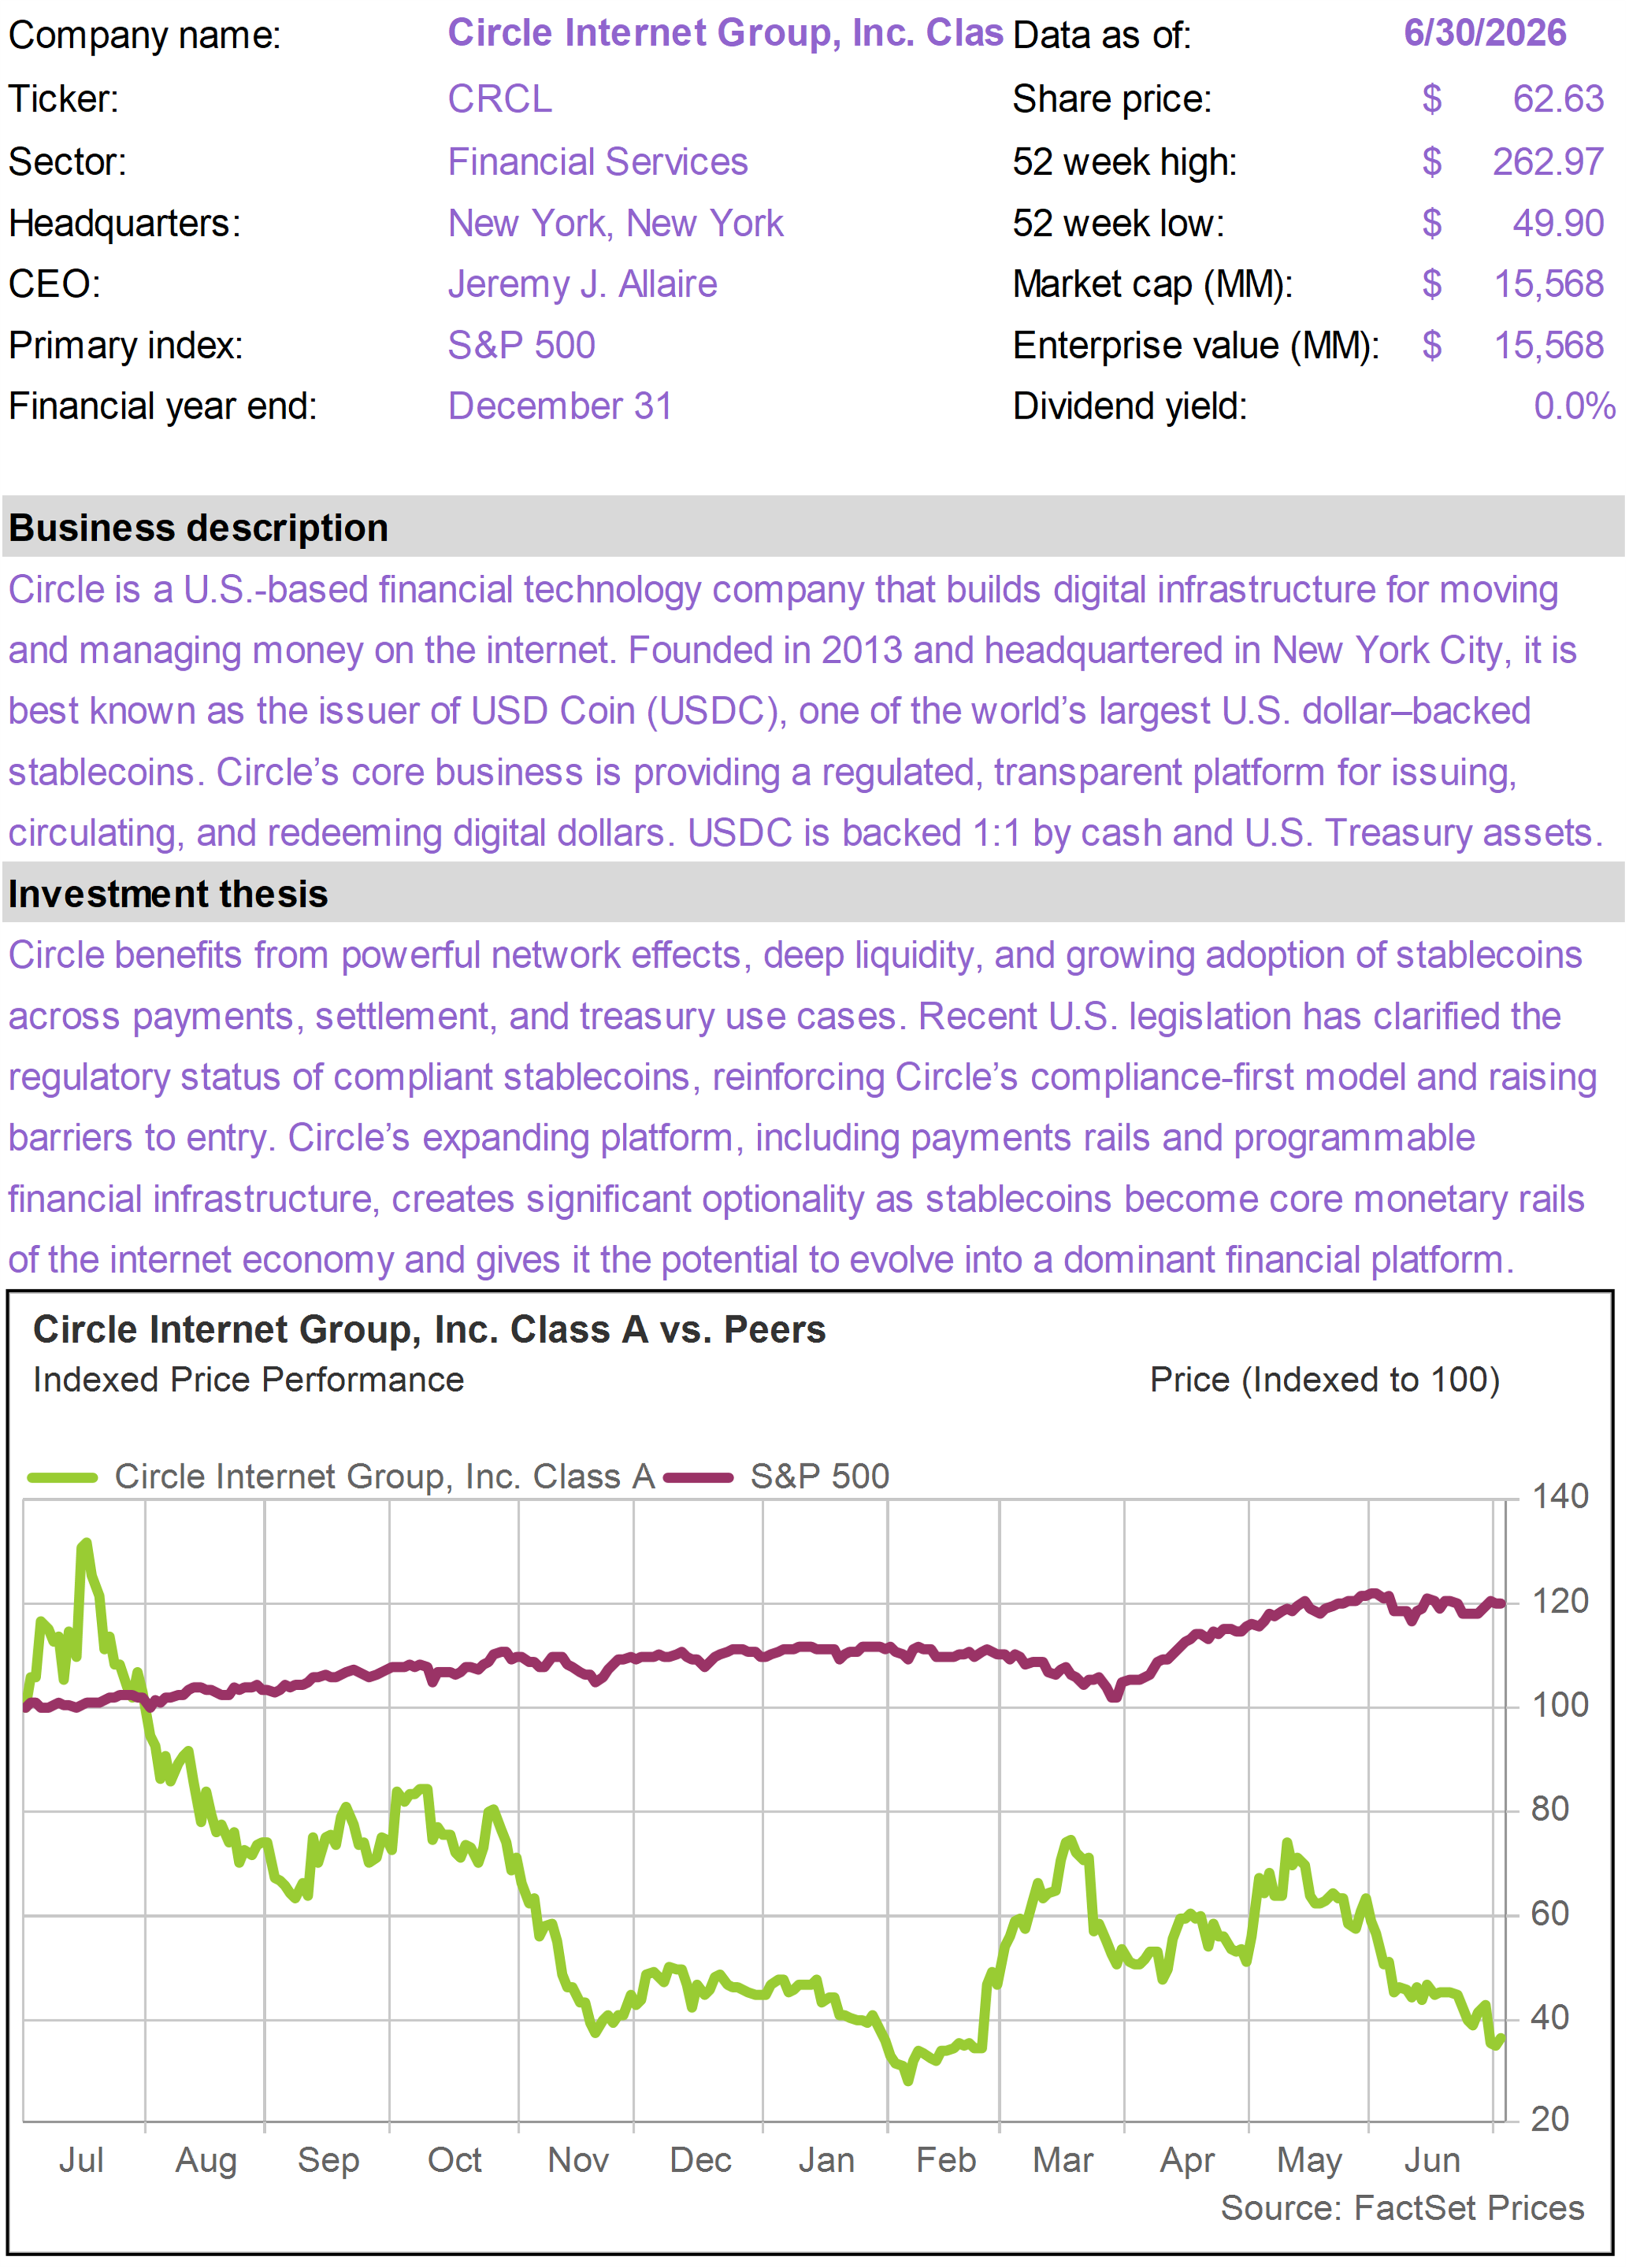
After a strong performance in May, CRCL traded down sharply in June with weak crypto sentiment weighing on digital-asset-related equities and investors reacting negatively to a new competitive threat in stablecoins.
CRCL is the issuer of USDC, the second-largest stablecoin in the world. While the stock was pressured by the broader risk-off move in crypto, the sharper concern late in the month was the announced launch of a competing stablecoin, Open USD.
We believe the market reaction was excessive. Competition in stablecoins is inevitable, especially given the enormous potential size of the market. But competition also validates the opportunity. New entrants are effectively confirming that regulated digital dollars are becoming a major financial infrastructure category.
CEO Jeremy Allaire made a similar point in response to the Open USD announcement. He emphasized that stablecoins are platform and network-effect businesses, where liquidity, integrations, regulatory reach, and repeated transaction usage compound over time.
In other words, the threat is not simply whether a consortium can announce a competing stablecoin; the real test is whether it can build the trusted, liquid, widely integrated network that USDC already has. Consortiums like this have a poor track record of commercial success.
USDC already has a roughly $73 billion market capitalization, nearly 15 times larger than the closest GENIUS Act-compliant competitor.
Open USD does not appear to solve a problem that USDC has failed to address. CRCL already offers the scale, liquidity, regulatory positioning, partner incentives, and stablecoin movement infrastructure that a new entrant would need years to replicate.
In our view, the June selloff appears more like a sentiment-driven reset than a broken investment thesis. Crypto weakness and fear of competition hurt the stock, but the underlying case remains intact: USDC has scale, regulatory positioning, brand trust, and infrastructure advantages that will be difficult for new entrants to replicate. |
|
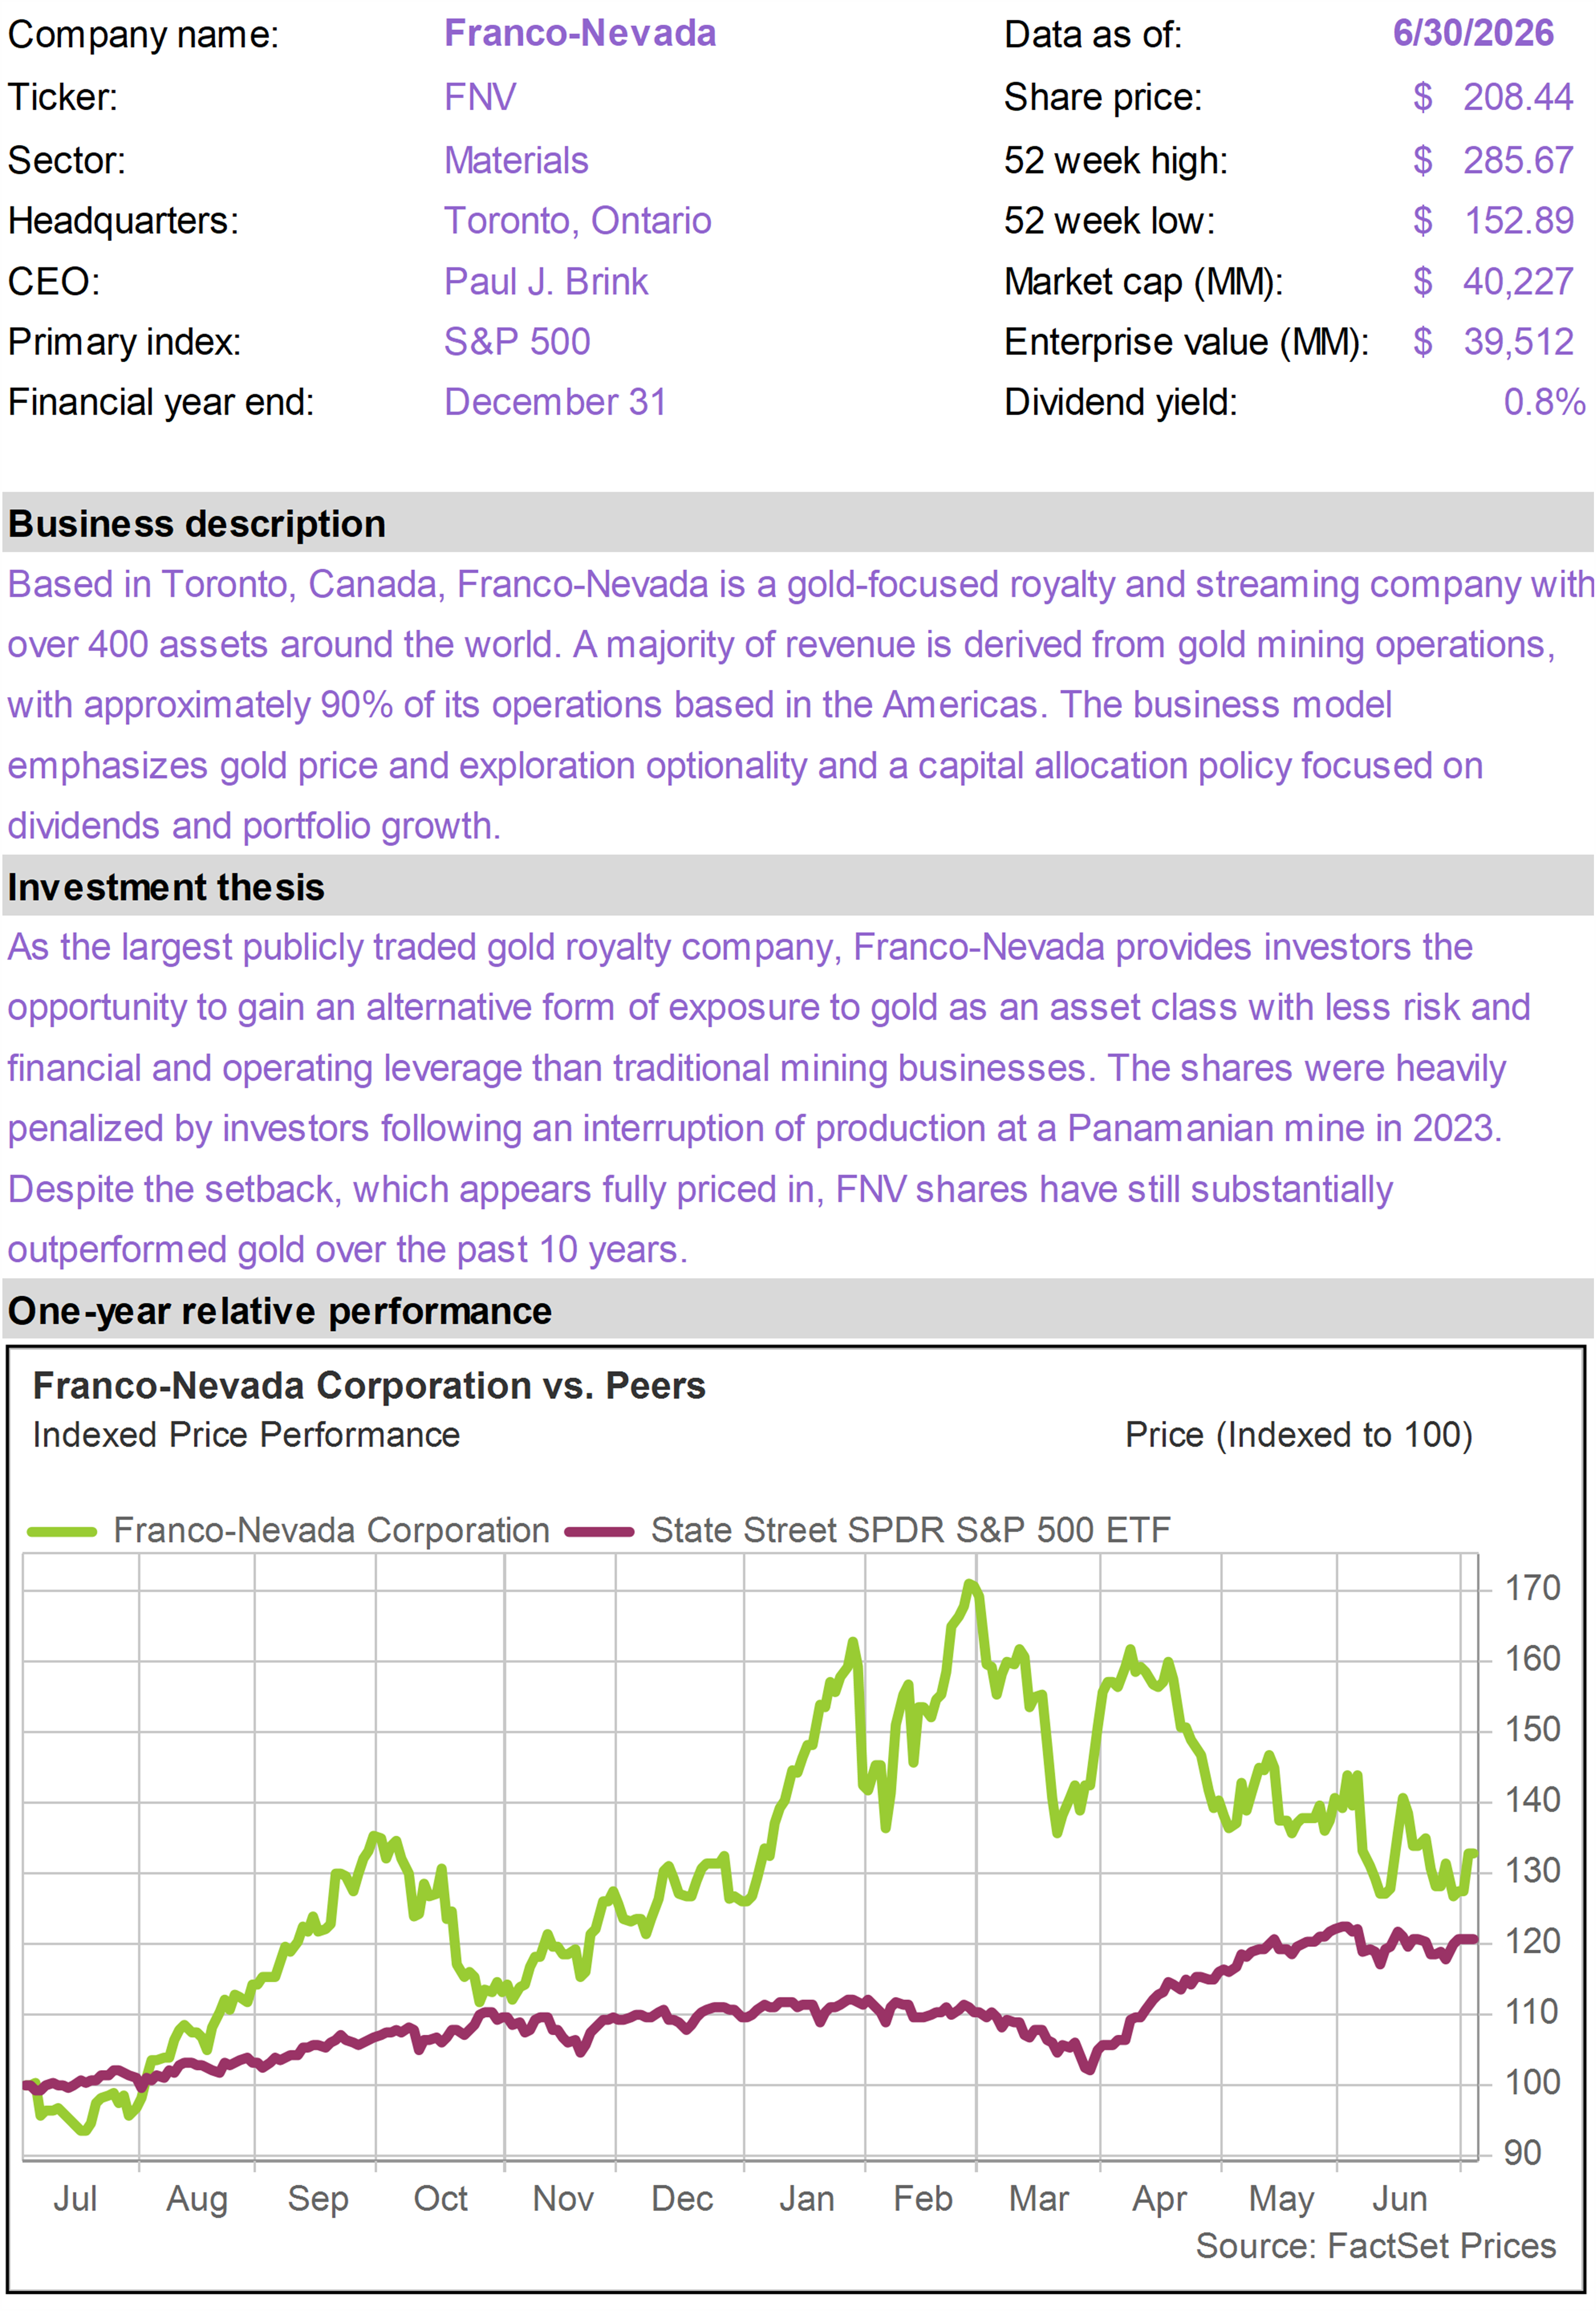
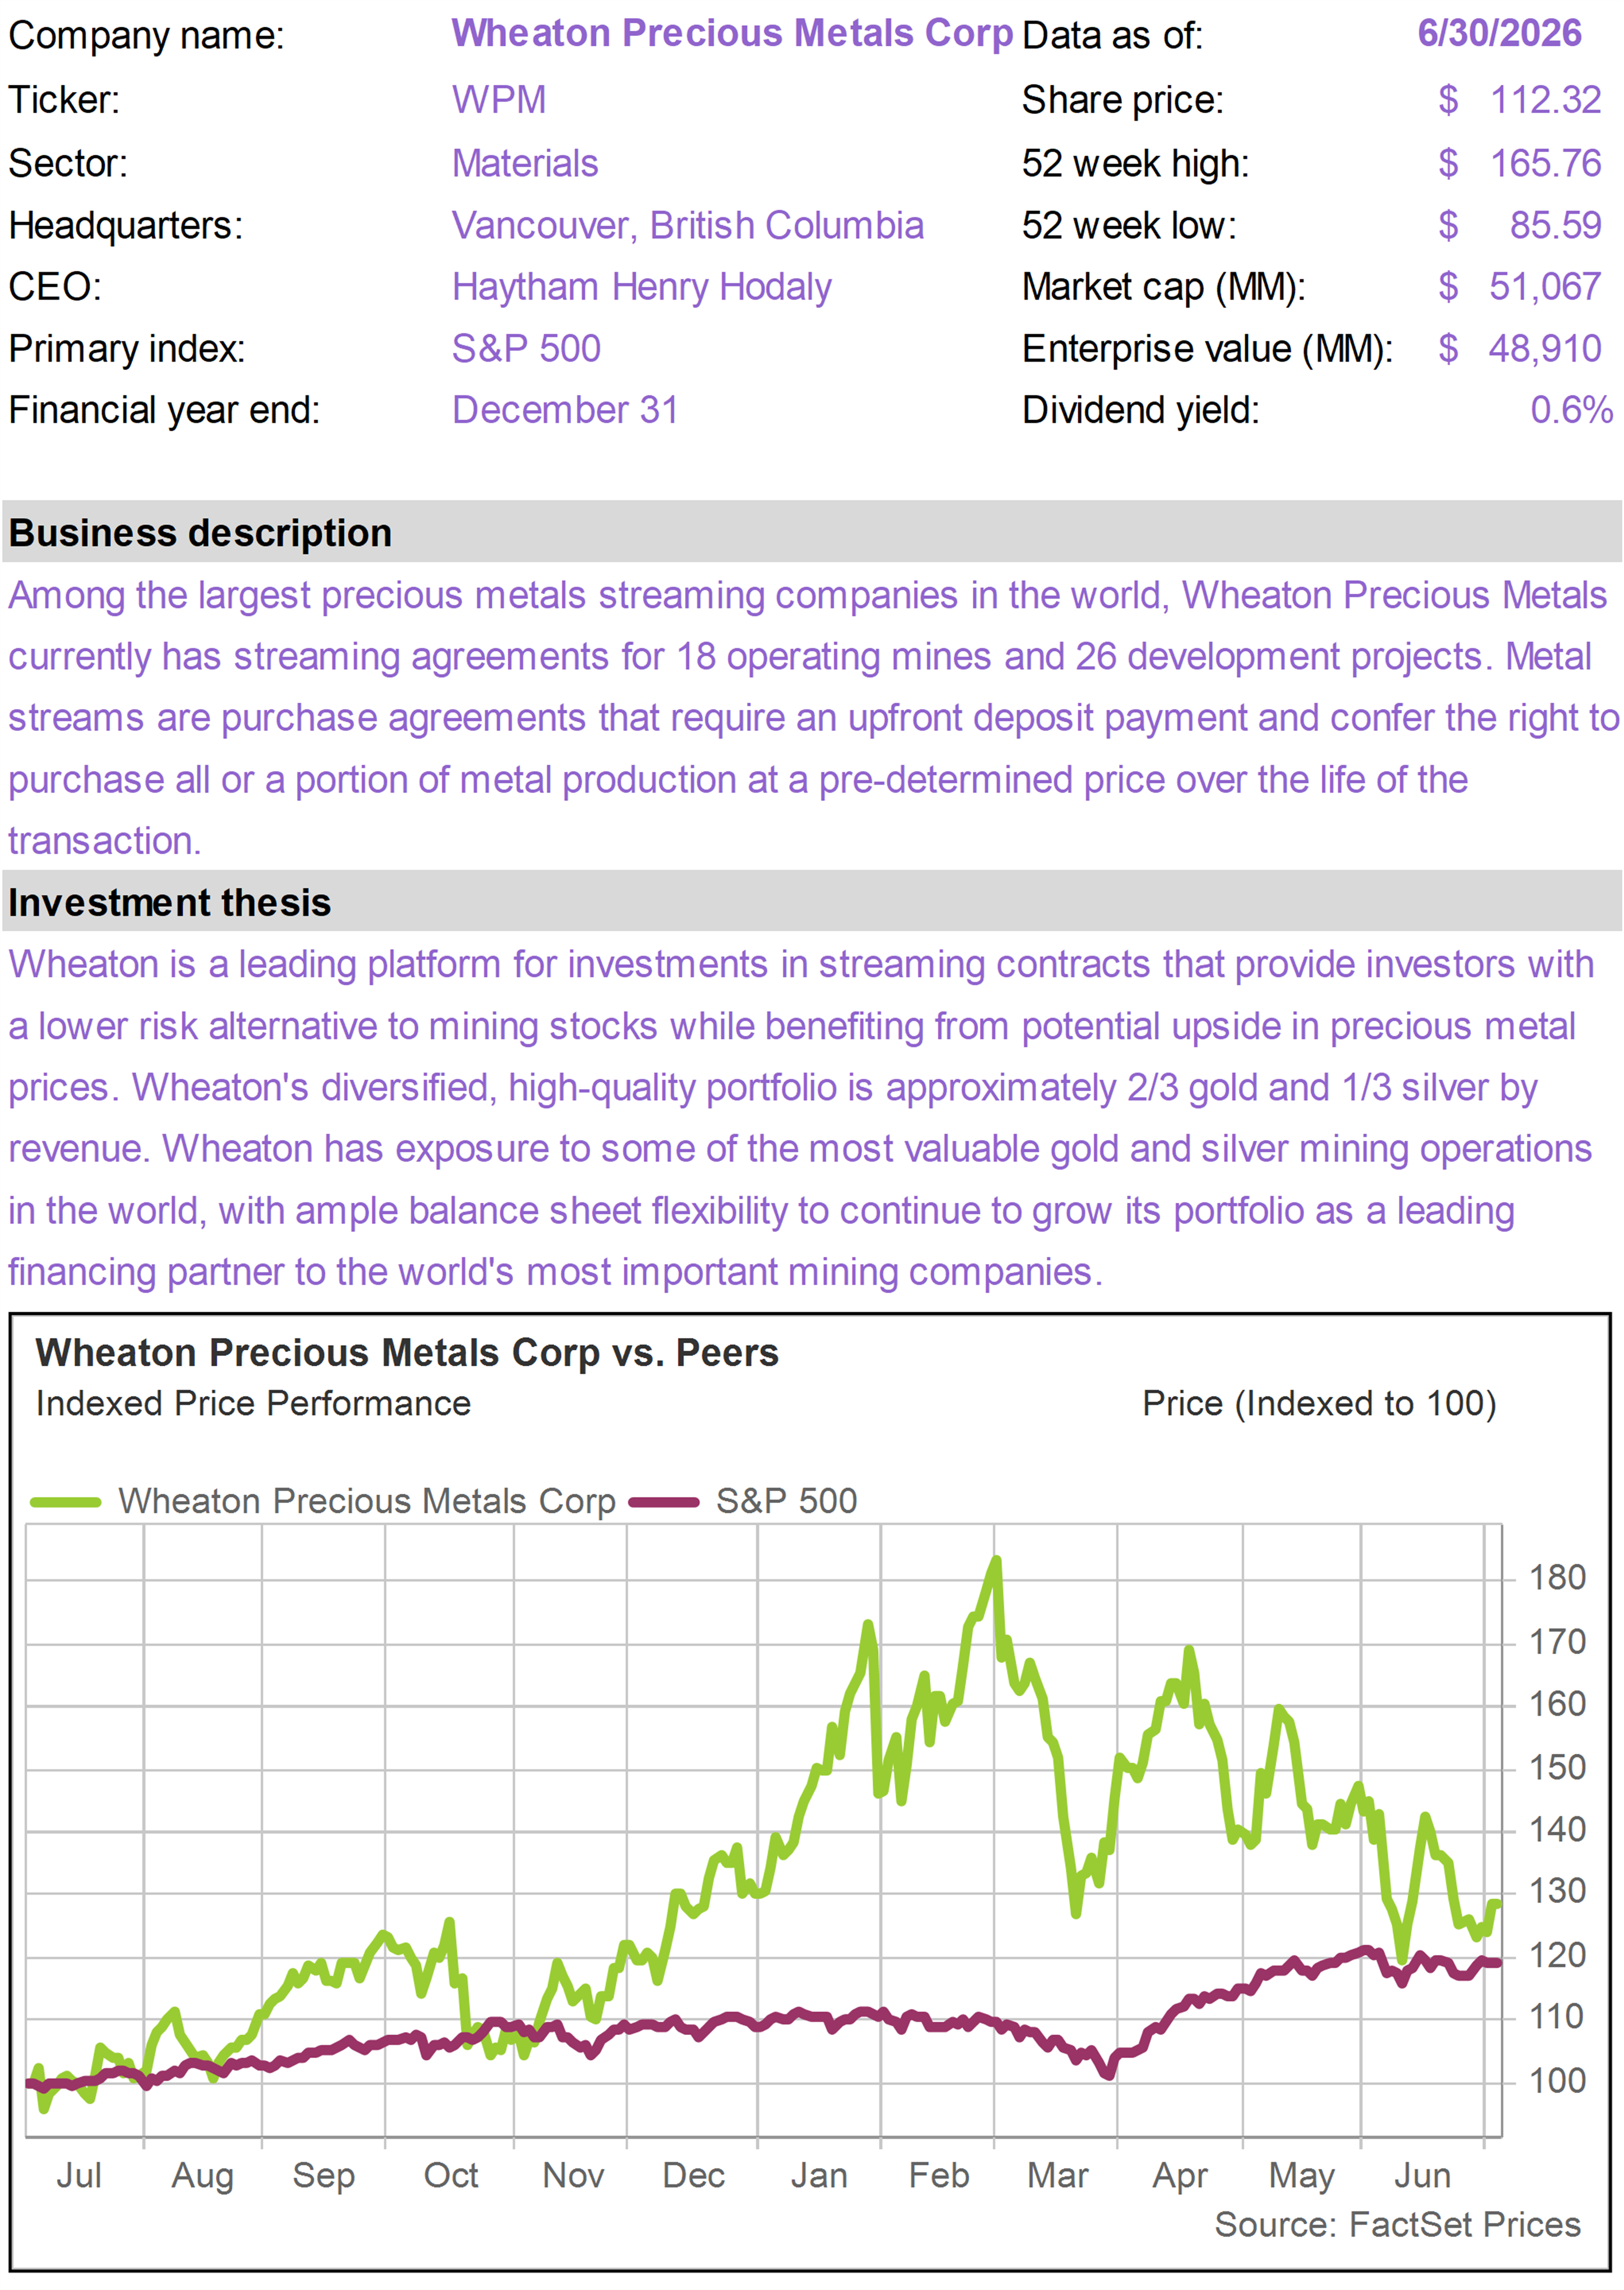
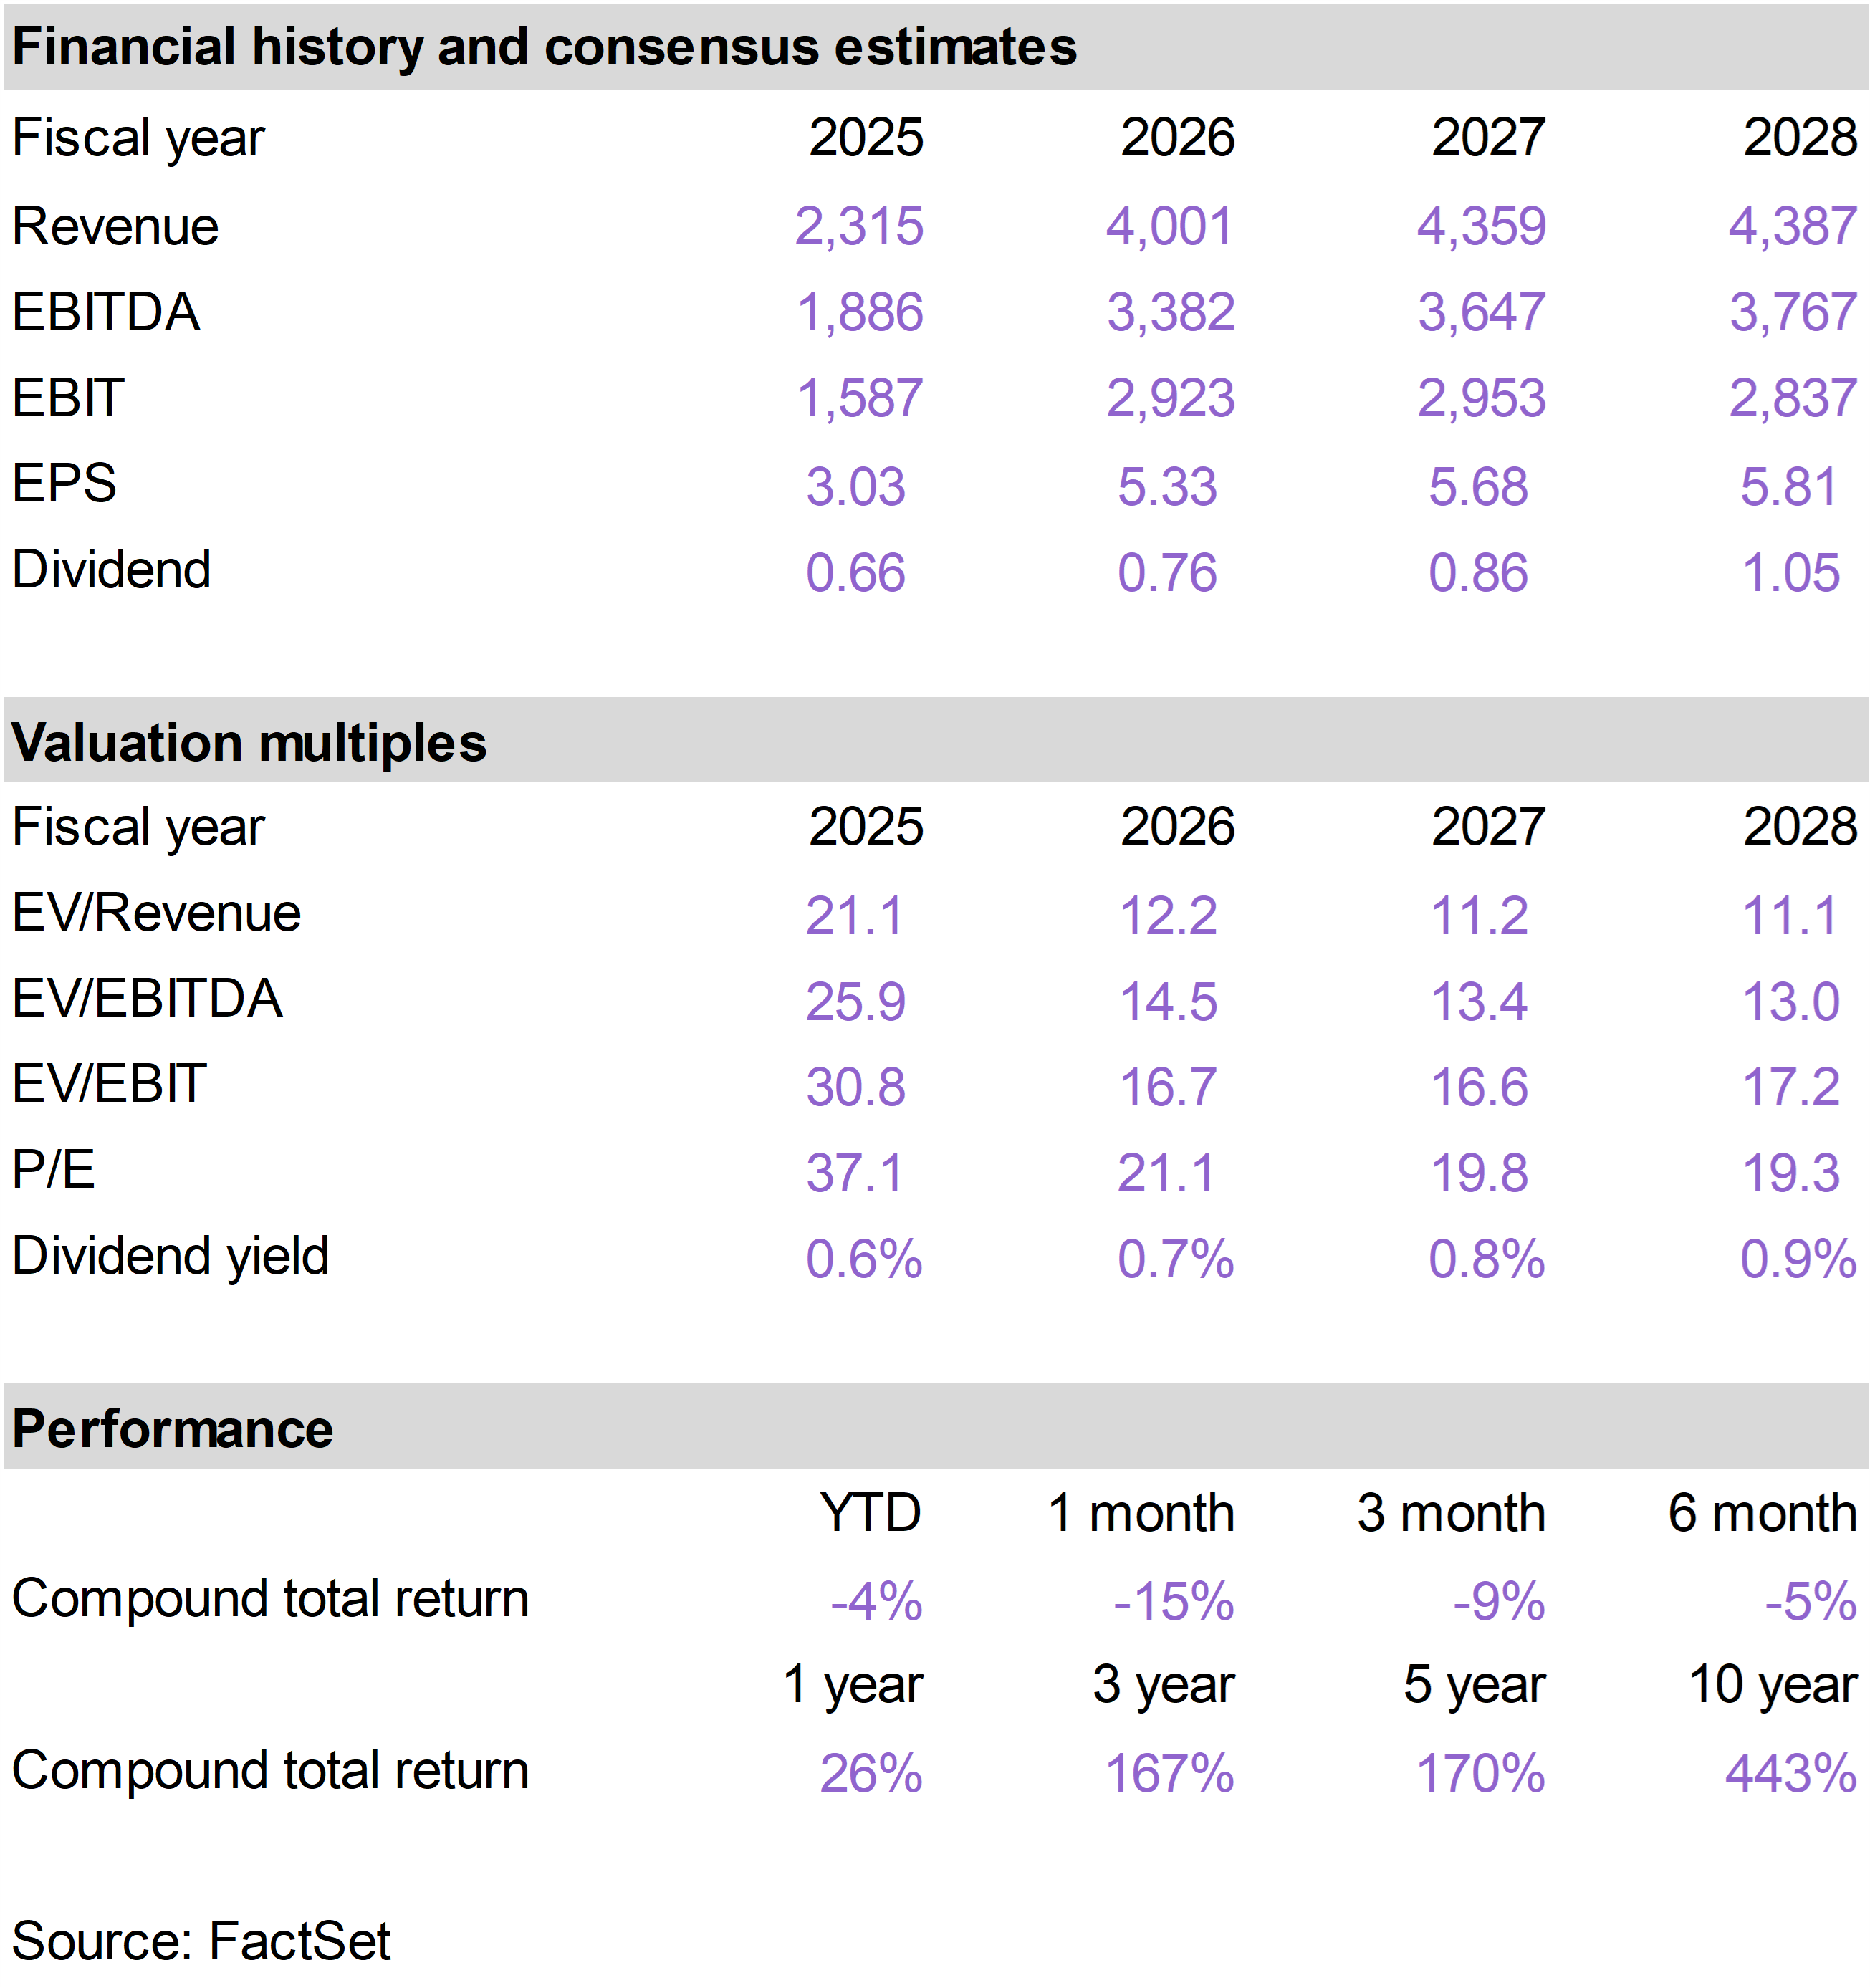
| | WPM and FNV declined in June as weakness in the gold price weighed on precious metals equities, including the royalty and streaming companies. Gold declined approximately 12% in June, likely influenced by Warsh’s unexpected hawkishness.
Rather than operate mines directly, WPM and FNV provide capital to mining companies in exchange for the right to receive a portion of future production or revenue. This gives them exposure to gold, silver, and other commodities, but with generally lower operating risk than traditional miners.
While the June weakness was largely a function of commodity-price sensitivity, operational news remained constructive.
For FNV, key long-term catalysts include potential progress at the Cobre Panama mine in the Caribbean. FNV’s liquidity position remains strong with approximately $4 billion available for transaction opportunities.
For WPM, the growth outlook is also attractive. Longer term, WPM expects attributable production to reach approximately 1.2 million gold-equivalent ounces by 2030, representing roughly 50% growth.
WPM management also described a robust transaction pipeline focused mainly on precious metals opportunities, typically in the $200 million to $500 million range, with some larger opportunities as well.
We continue to view WPM and FNV as high-quality ways to maintain precious metals exposure. Near-term returns will remain tied to gold and silver prices, but the operational picture remains favorable, especially given production growth, project catalysts, and continued transaction opportunities.
While investors in the gold space may have been disappointed by Warsh’s debut, a dovish shift in monetary policy going forward would naturally benefit gold and gold-related equities. |
|
| | | |
| | |
| | |
| | | |
|
| | |
|
| | Mid-America Apartment (MAA) |
|
|
|
| | |
|
| | |
|
| | |
|
| | Circle Internet Group (CRCL) |
|
|
|
| | Diamondback Energy (FANG) |
|
|
|
| | Floor & Decor Holdings (FND) |
|
|
|
| | |
|
| | |
|
| | |
|
| | WESCO International (WCC) |
|
|
|
| | Wheaton Precious Metals (WPM) |
|
|
|
| | The 76research Inflation Protection Model Portfolio emphasizes business models that benefit from inflationary pressure. Holdings are typically selected from industries based on supply constrained real assets, including commodity and energy businesses, or companies that otherwise demonstrate superior pricing power. Drawing from an investable universe of expected inflation beneficiaries, specific holdings are chosen based on valuation and general business quality, growth and risk considerations. |
|
| | FOR SUBSCRIBER USE ONLY. DO NOT FORWARD OR SHARE. |
|
| | | |
|
|
|
|
|