|
| Income Builder Model Portfolio |
|
| Monthly Portfolio Review: December 2025Publication date: January 5, 2026 |
|
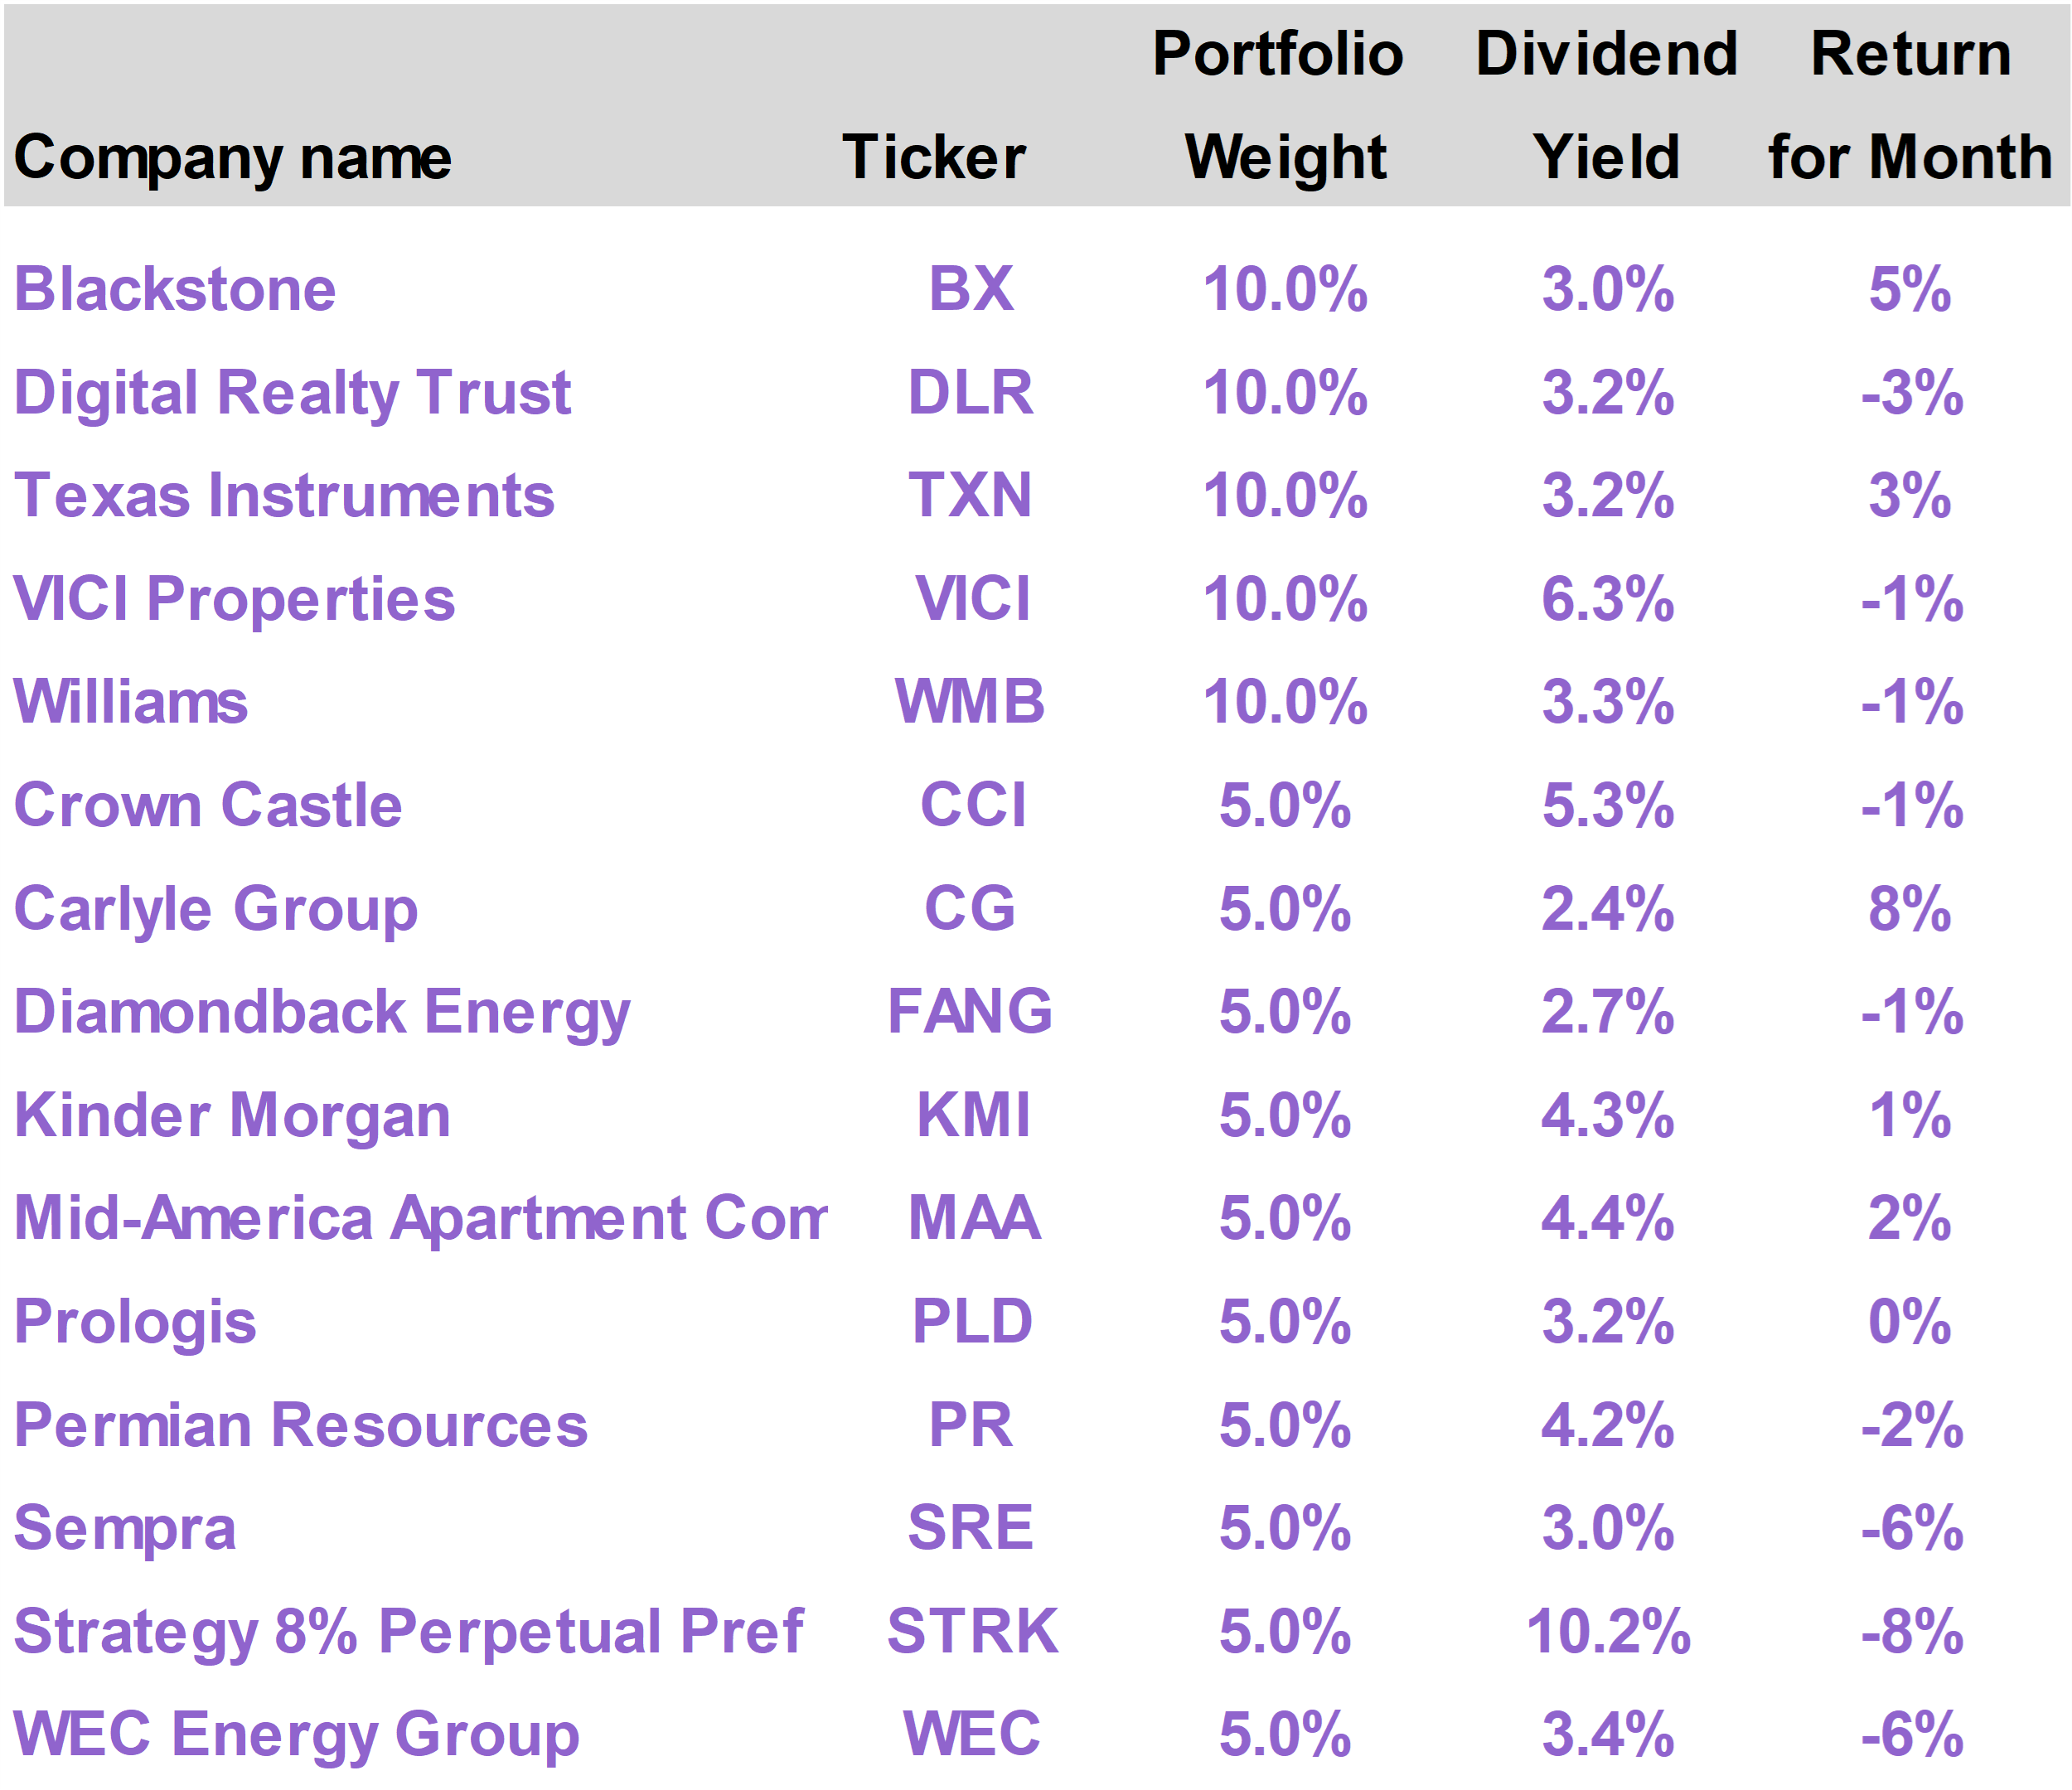
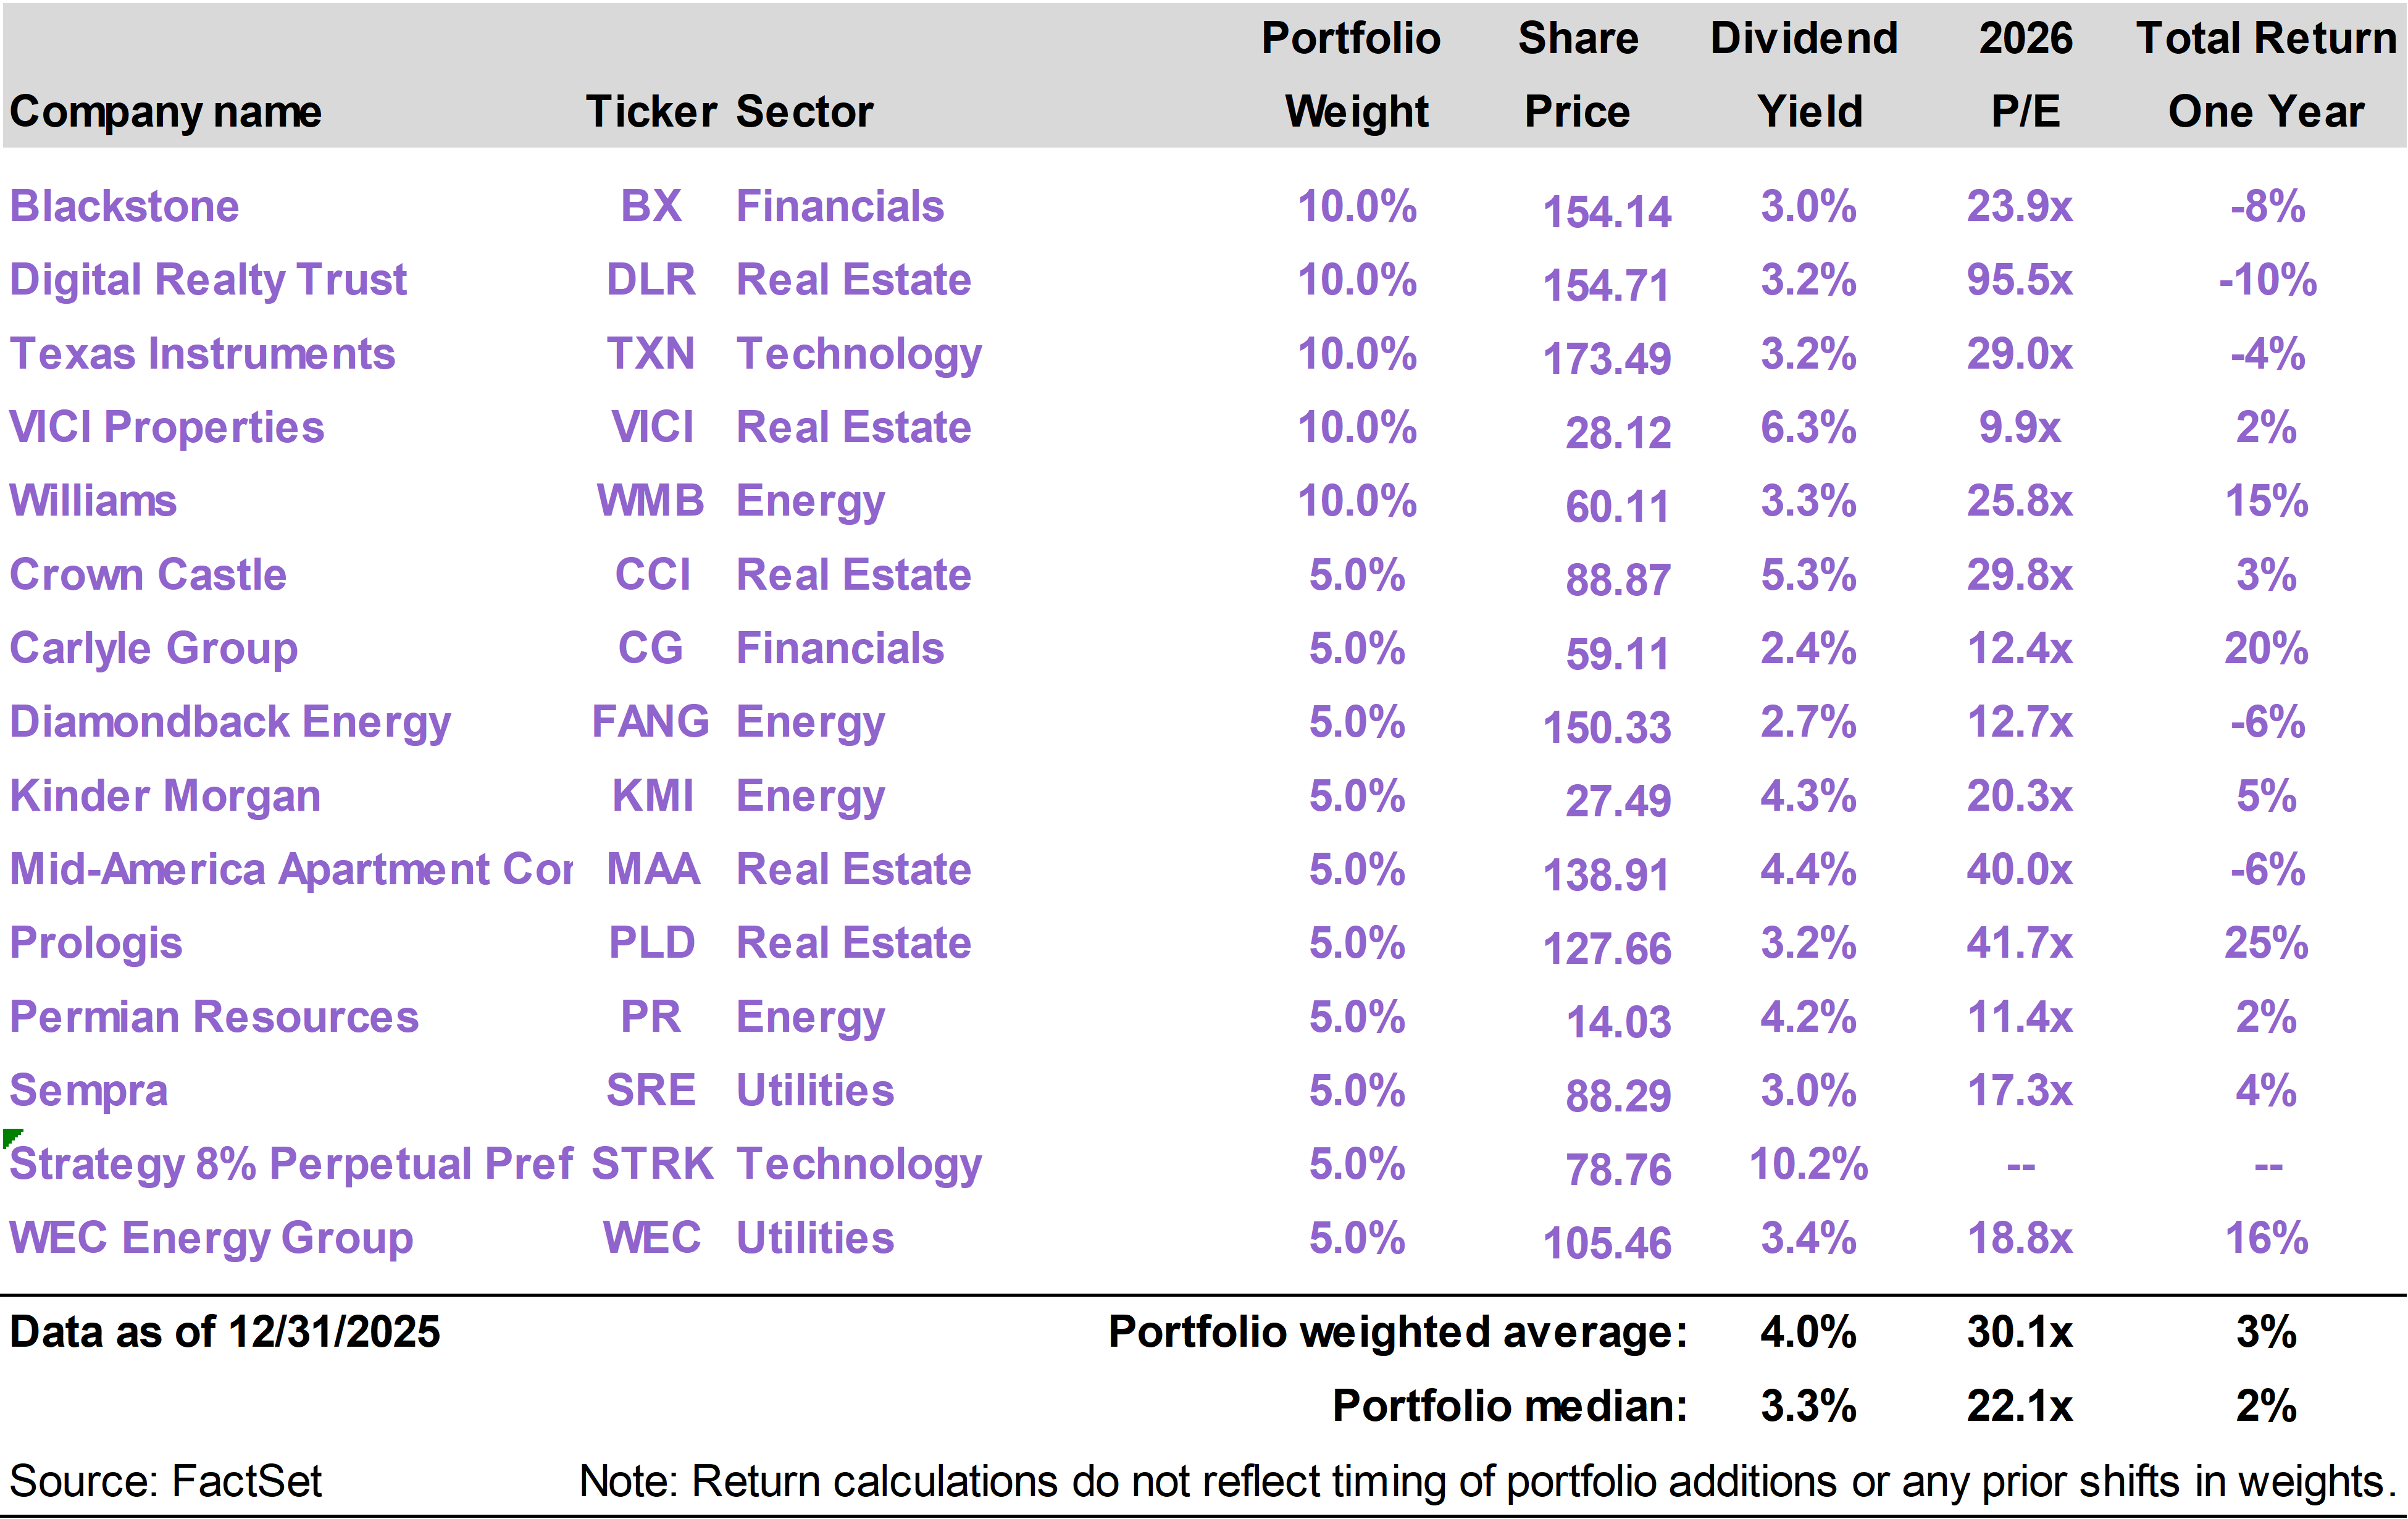
| | | Current portfolio holdings |
|
|
| | FOR SUBSCRIBER USE ONLY. DO NOT FORWARD OR SHARE. |
|
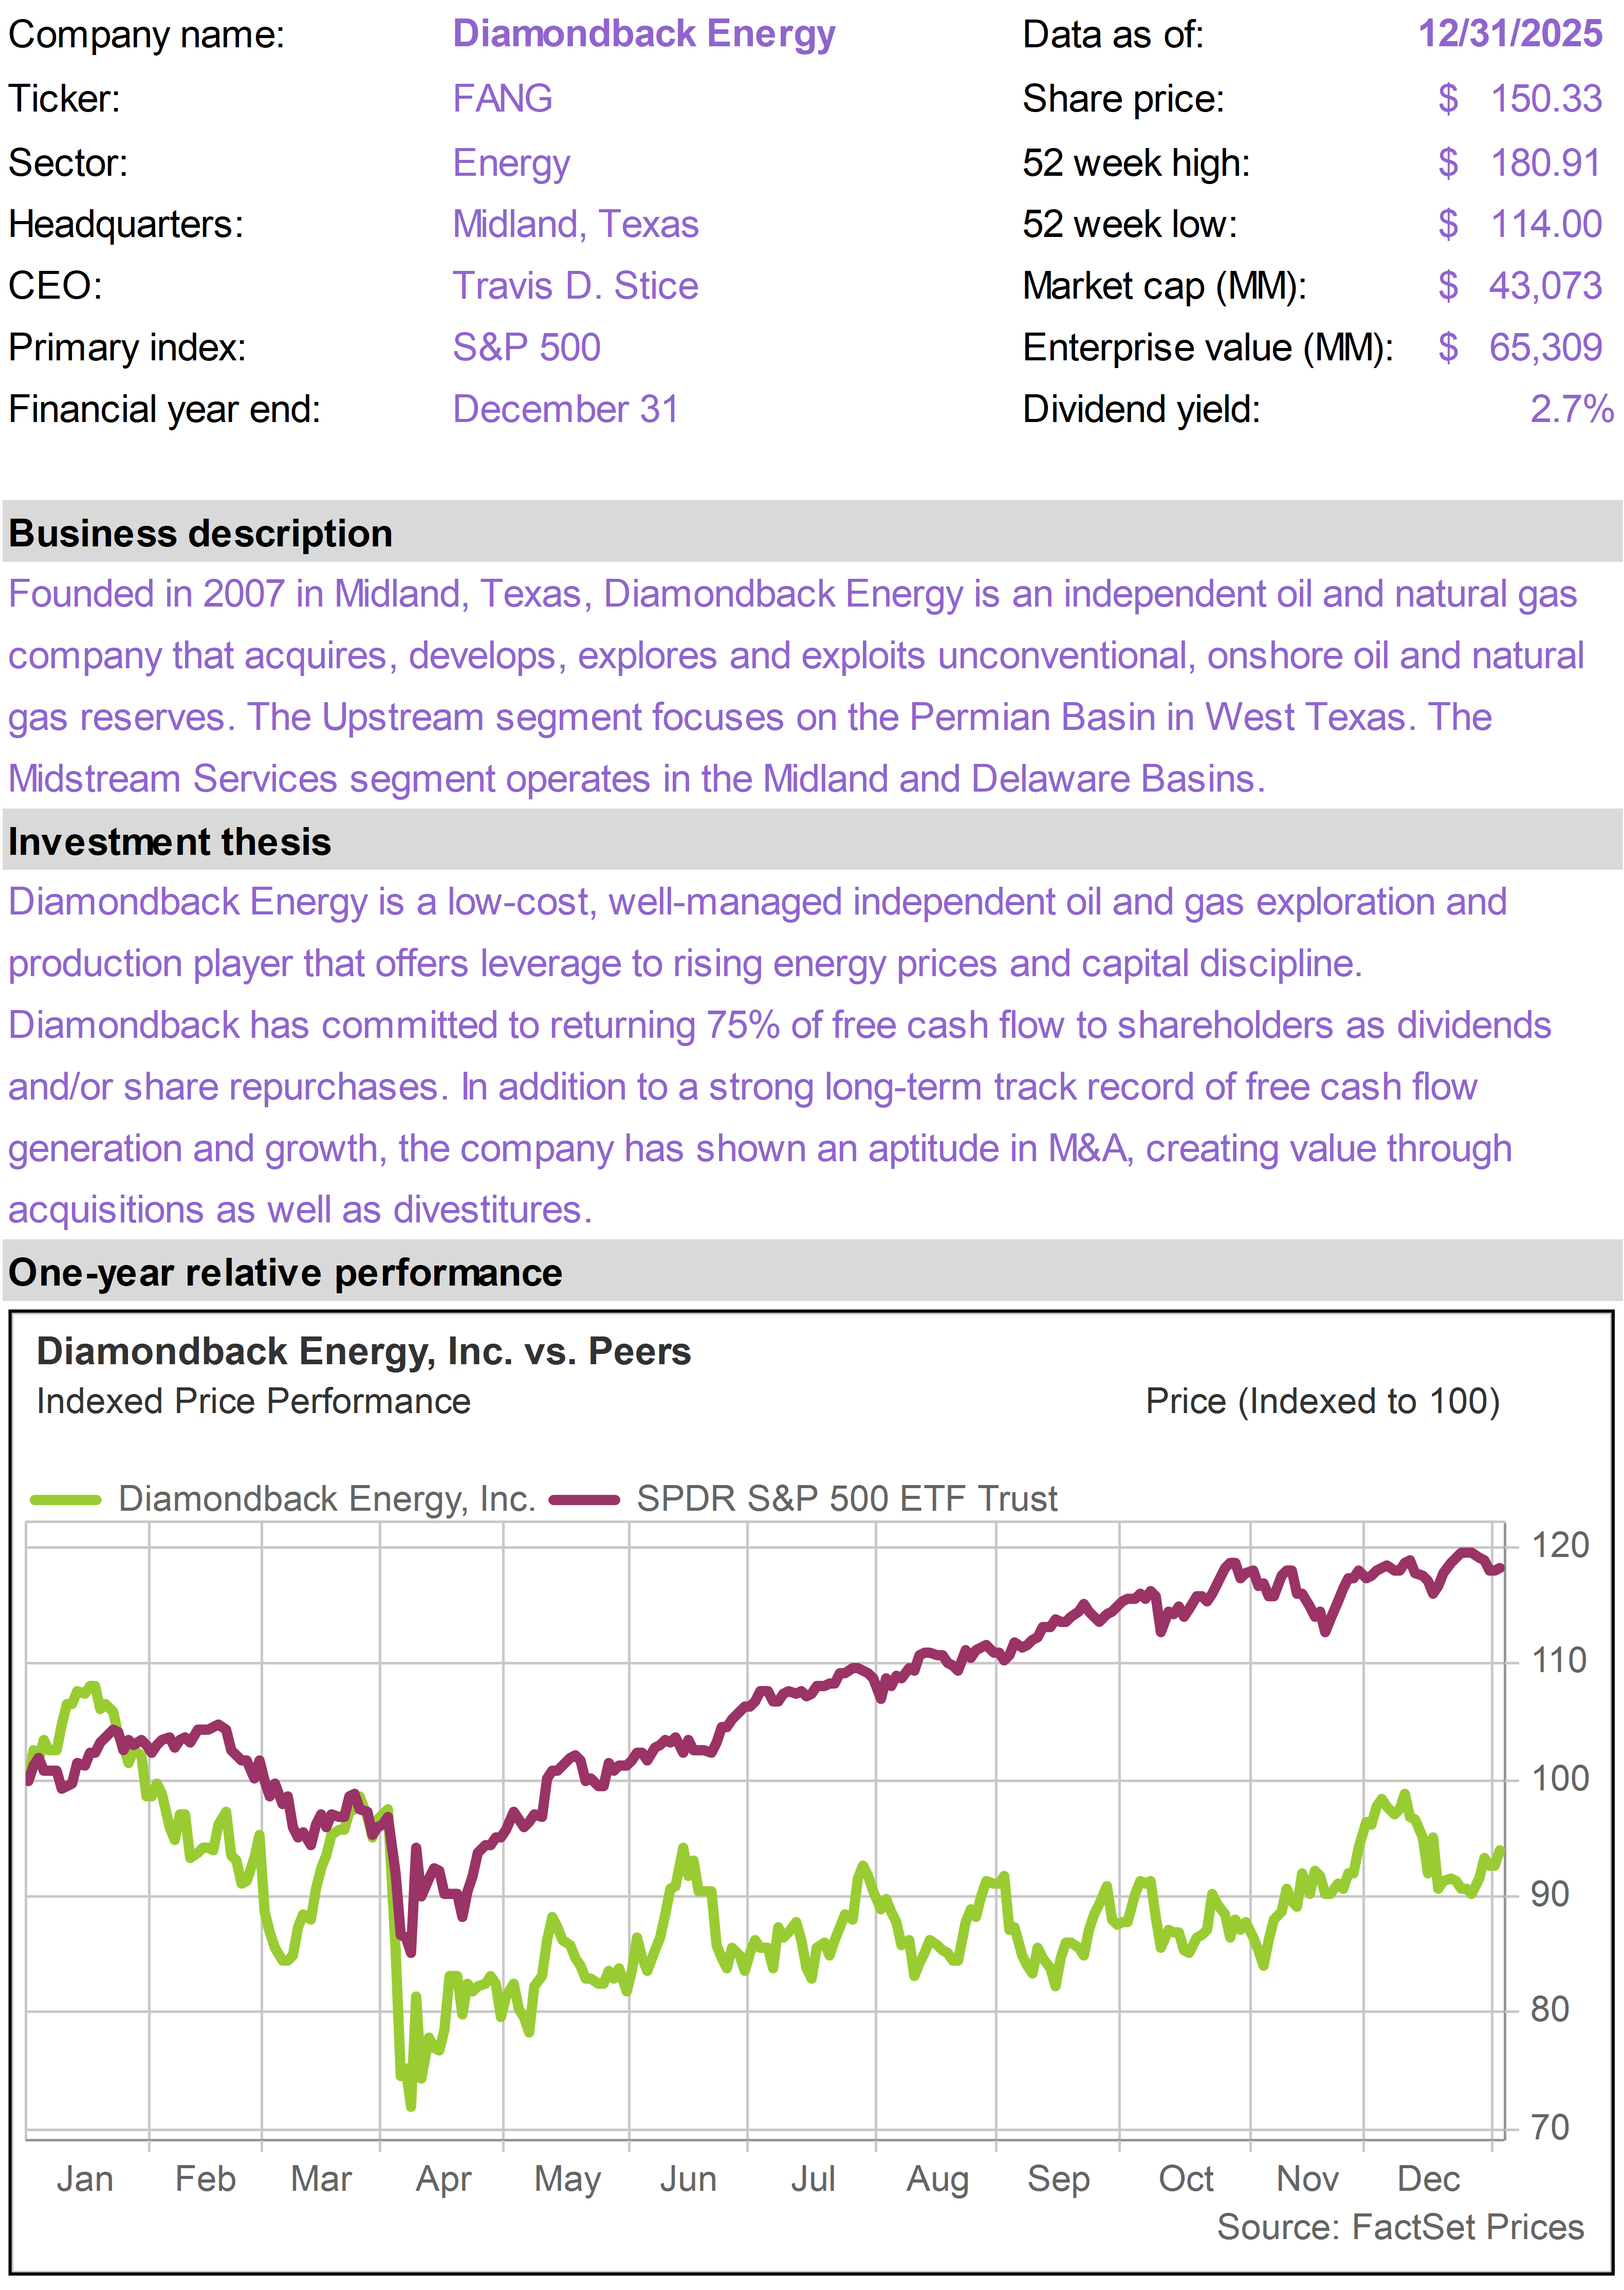
| | | After a volatile November, stocks were generally stable in December. The S&P 500 was flat and the Nasdaq Composite traded down slightly. The Income Builder portfolio was also flat in December. Although tech stocks were somewhat weak in December, 2025 was a strong year for tech, with a handful of mega-cap AI leaders having a disproportionate impact on major indexes. Decelerating inflation was also an important tailwind for stocks in 2025, especially in the latter part of the year. The portfolio’s alternative asset managers, Carlyle Group (CG) and Blackstone (BX), performed well in December, reflecting strong growth prospects heading into 2026. The most significant portfolio detractor this month was Strategy 8% Preferred (STRK); however, in the first few trading days of January, STRK shares have recovered sharply, more than offsetting the year-end weakness. With inflation subsiding, we see strong potential upside in the portfolio from easier monetary policy—especially with Trump set to announce his proposed replacement of Fed Chair Jerome Powell.
|
|
| | | The Income Builder portfolio returned -0.2% in December, while the S&P 500 Index returned 0.1%. On a one-year basis through the end of the month, the portfolio returned 2.4%, versus 17.9% for the index.
The top performing positions in the portfolio in December were Carlyle Group (CG), which returned 8%; Blackstone (BX), which returned 5%; and Texas Instruments (TXN), which returned 3%.
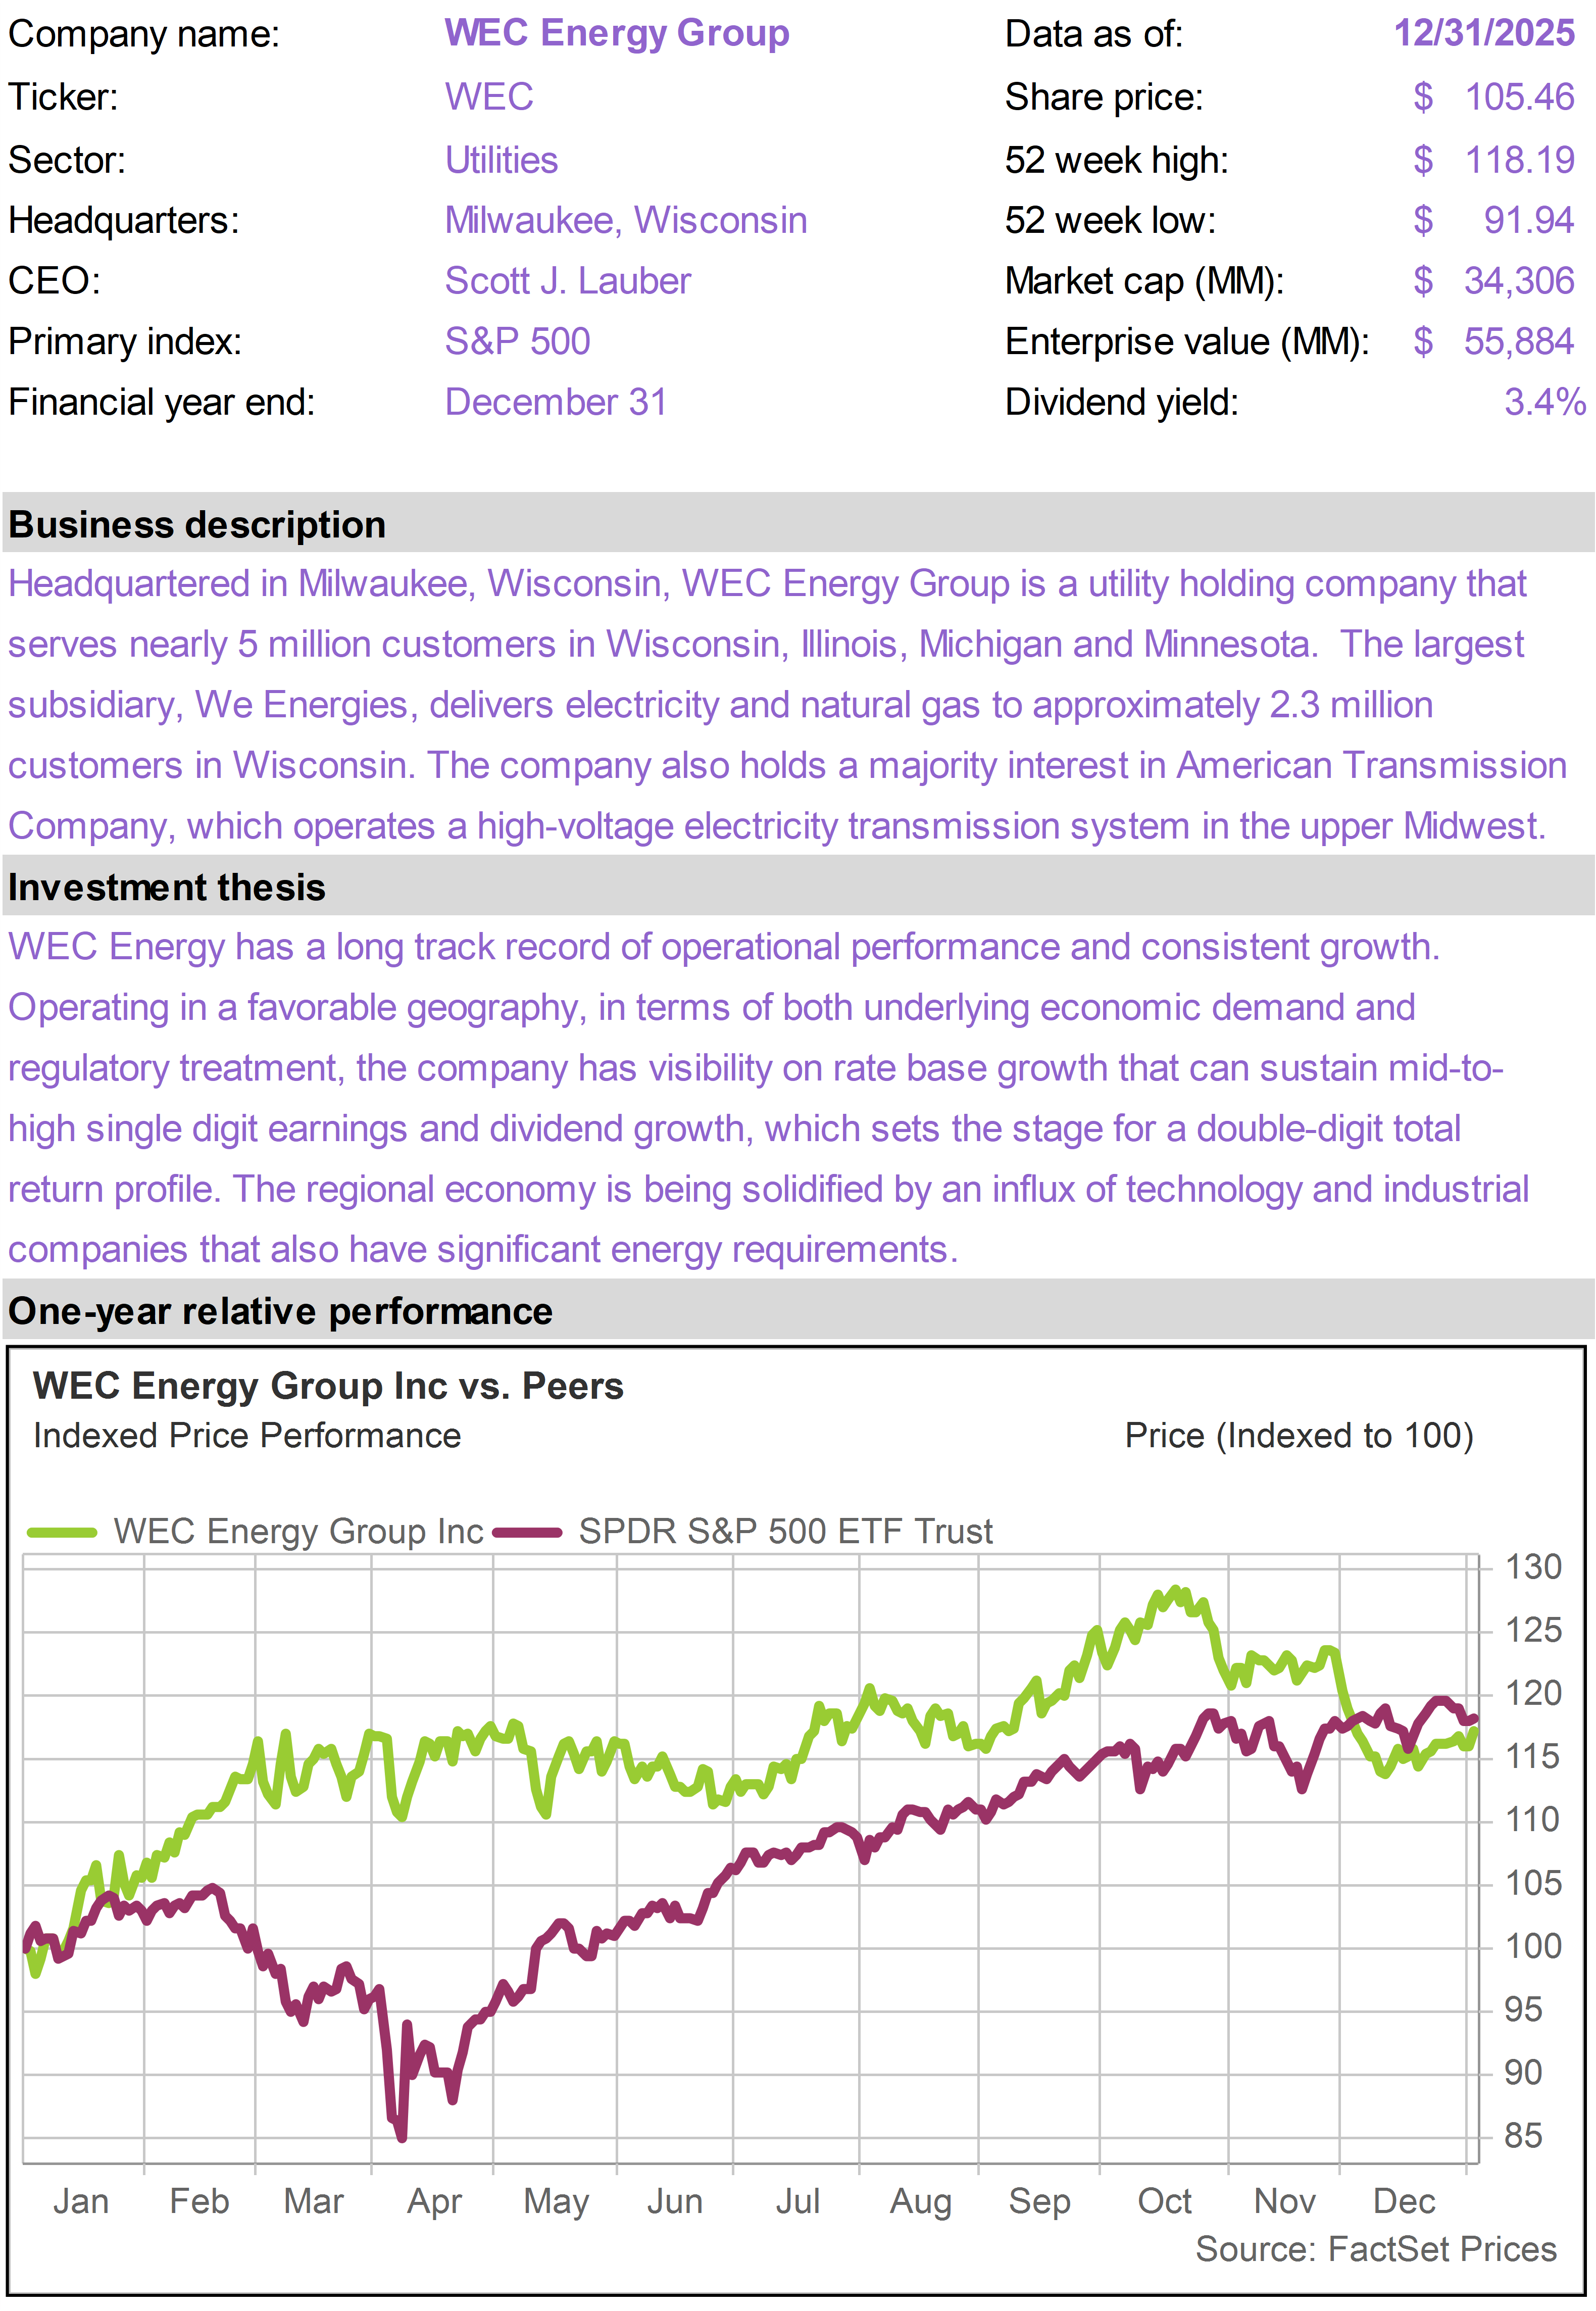
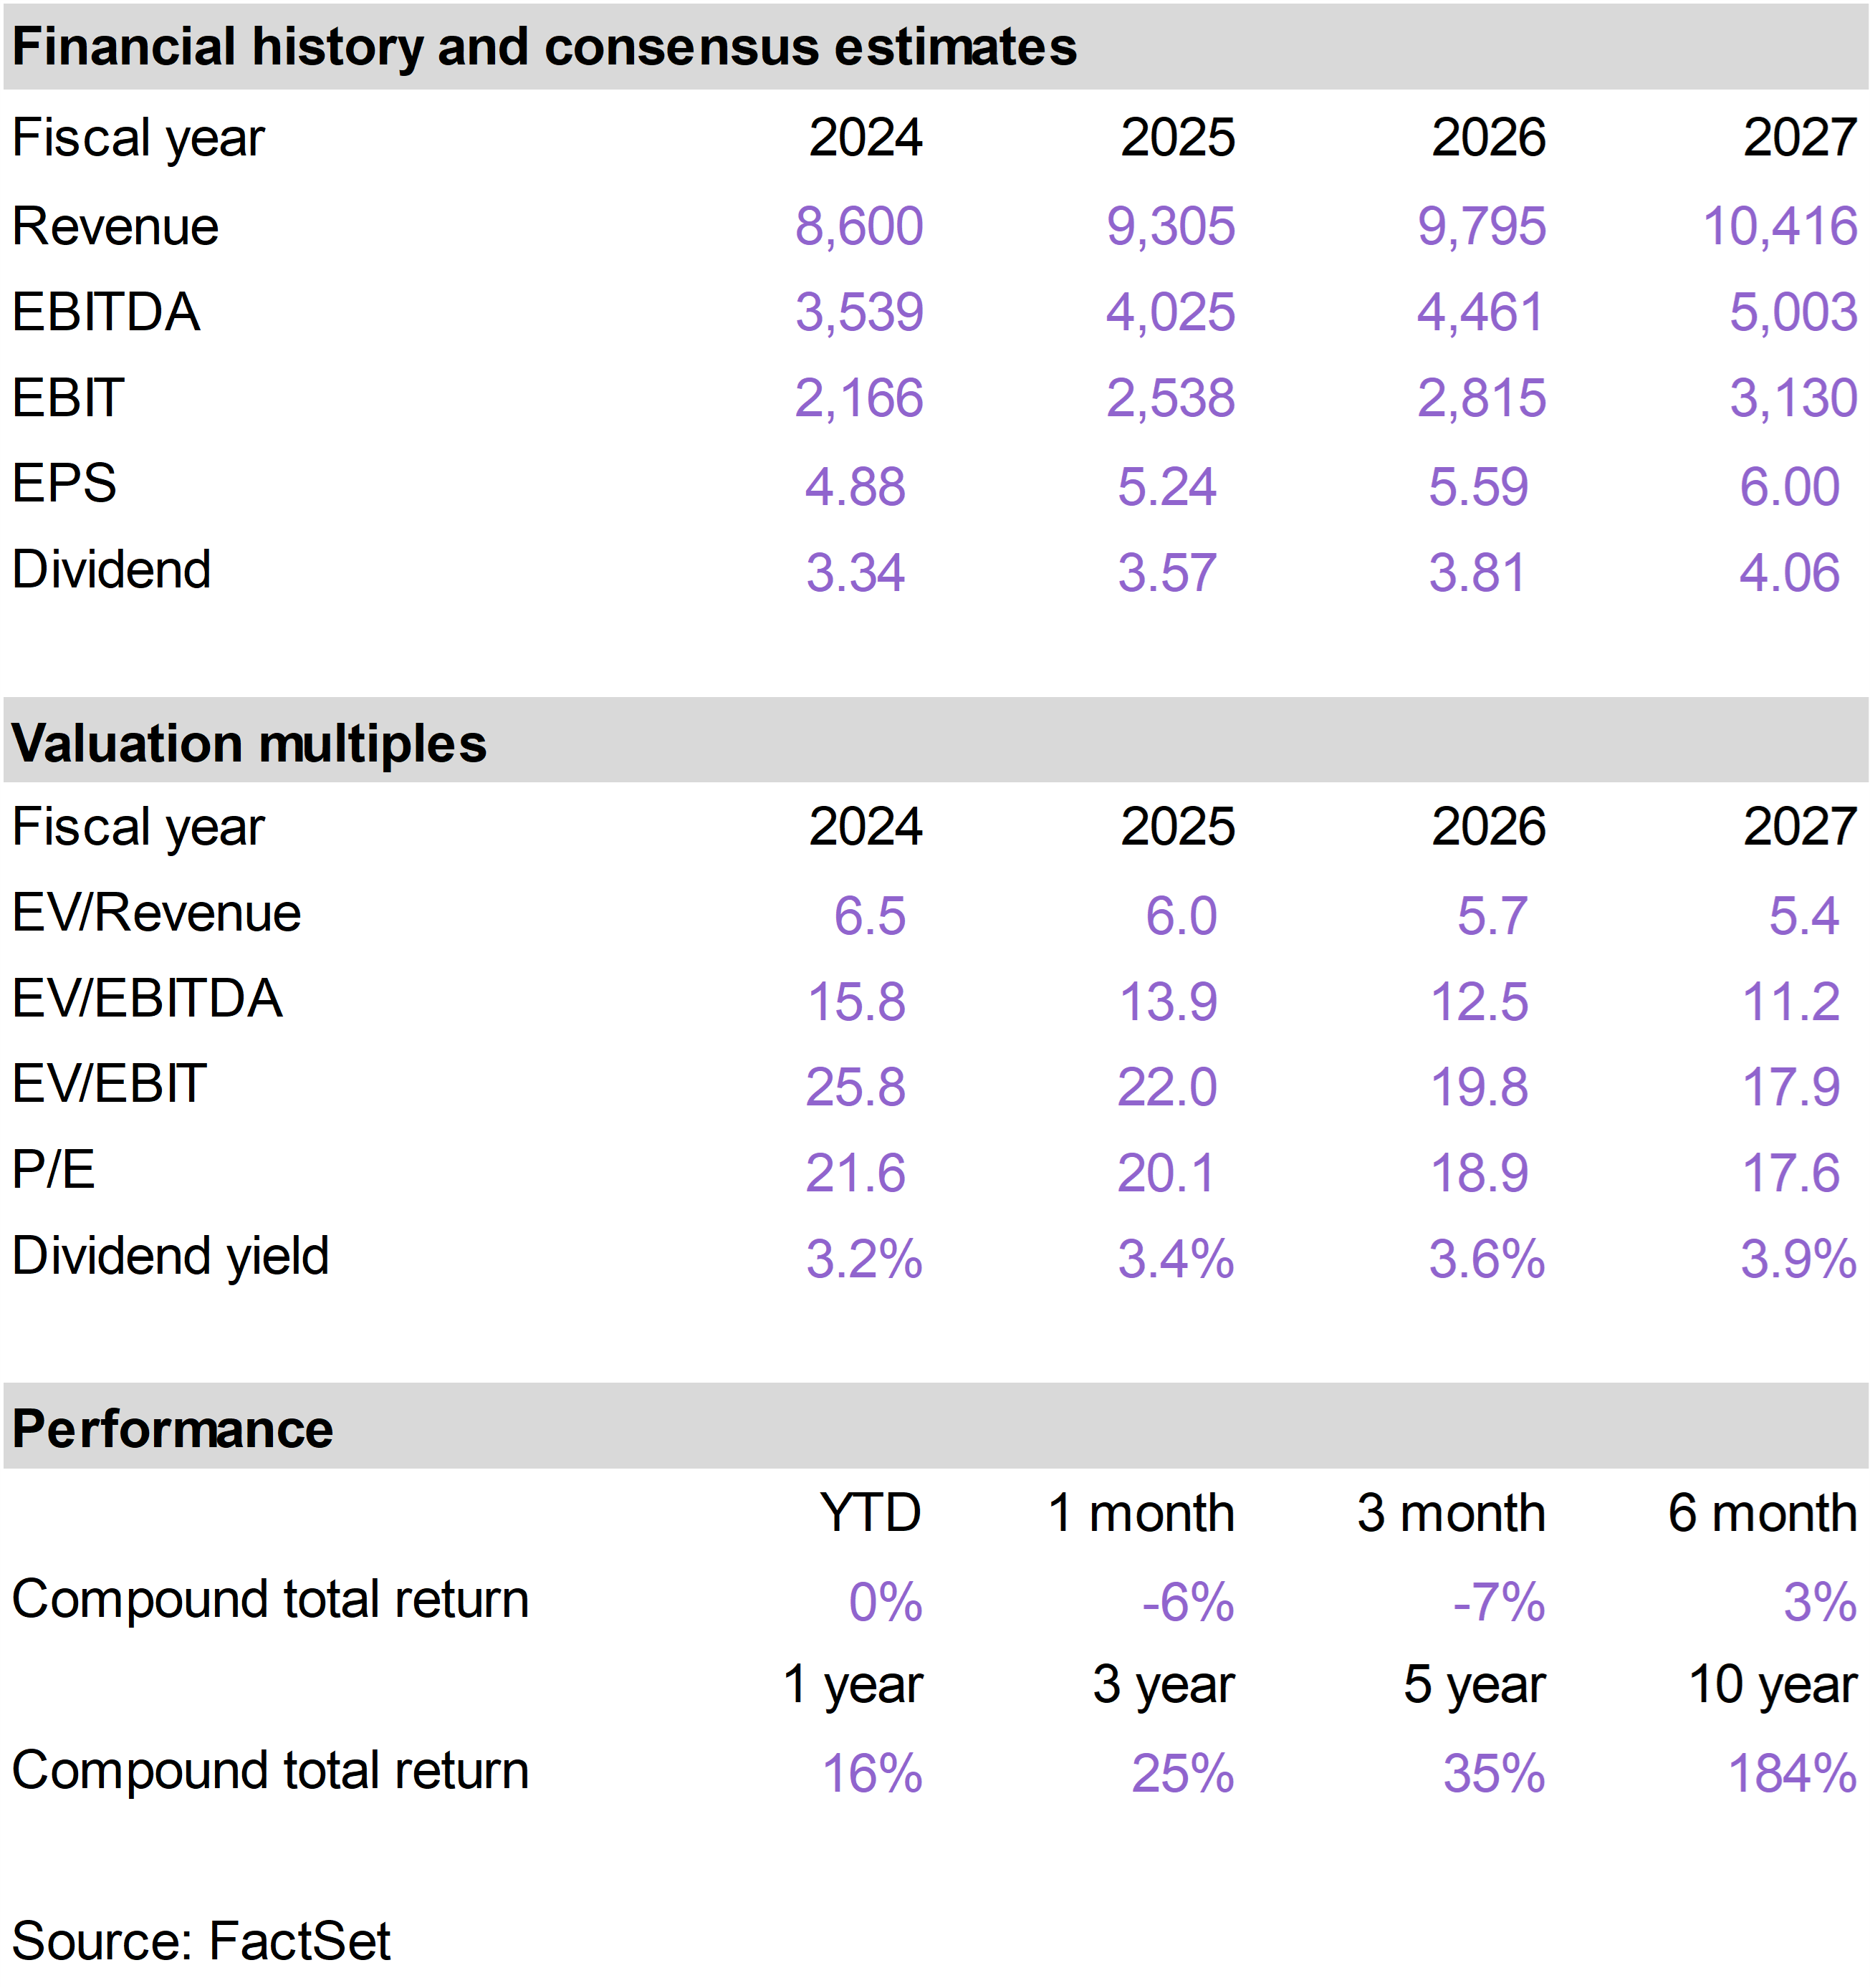
Notable detractors in the portfolio were Strategy 8% Preferred (STRK), which returned -8%; Sempra (SRE), which returned -6%; and WEC Energy Group (WEC), which returned -6%. |
|
|
Calm end to a strong year
While December was basically a flat month for stocks, the bigger picture is that stocks generally delivered quite strong returns over the course of the year. The S&P 500 closed the year just about 1% below its all-time highest levels.
Technology stocks mildly underperformed in December but ultimately led the way in 2025. The indexes with the most tech exposure did the best.
The NASDAQ Composite returned 21% in 2025, versus 18% for the S&P 500 and 11% for the S&P 500 Equal Weighted Index (which captures the average stock in the index and has much lower exposure to mega-cap tech stocks). |
|
|
|
S&P 500, NASDAQ, S&P 500 Equal WeightTotal Return (12/31/24 - 12/31/25) |
|
|
Mag 7 continue to lead
Given their extreme importance to the market now, we have begun tracking the Magnificent Seven mega-caps, including Broadcom (AVGO), directly via our regularly recurring Mag 7 Monitor.
These stocks played a critical role in driving the upside in the broader market last year, delivering an average total return of approximately 26%, which exceeded the Nasdaq. |
|
|
|
Mag 7 - Total Return(12/31/24 - 12/31/25 |
|
|
The success of the Mag 7 in 2025 was clearly AI-driven. Interestingly, only three of the stocks—AVGO, Alphabet (GOOGL), and NVIDIA (NVDA)—actually outperformed the S&P 500. But the performance of these three stocks was extremely strong and made up for the relatively subdued performance of the rest of them.
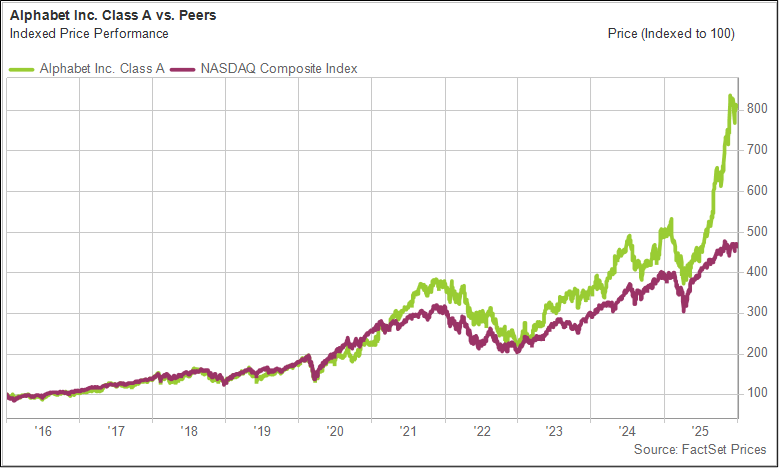
GOOGL’s success this year (up 66%) was particularly notable, after about a decade of basically in-line performance with the Nasdaq.
GOOGL shares broke out in the final months of 2025 as investors recognized the success of its Gemini AI offering as a top AI model. The market also now has greater confidence in GOOGL’s ability to use AI to reinvent its leading internet search business without cannibalizing it. |
|
|
|
GOOGL vs. Nasdaq- Total Return(Last 10 Years) |
|
|
NVDA and AVGO succeeded in 2025 as the two leading hardware players in AI.
Despite some volatility along the way, especially in April with the tariff panic, NVDA shares delivered another impressive result on the back of continued earnings growth and a healthy outlook.
In 2025, AVGO asserted itself as a critically important AI hardware player through Application-Specific Integrated Circuits (ASICS). The company designs and manufactures these custom AI chips, often in close partnership with its customers, including GOOGL.
While there is concern among tech investors that AVGO’s ASICS represent a competitive threat to NVDA’s Graphics Processing Units (GPUs), both companies thrived in 2025 on broad demand for the key equipment that makes AI possible.
Heading into the new year, AI remains the growth engine of the stock market. Companies across the economy are benefiting from the AI build-out and increasingly from AI adoption, which allows for faster growth and lower costs.
Real progress on inflation
AI growth may be driving the economy and stock market forward, but inflation is the main factor holding them back. Inflation remains somewhat elevated, keeping the Federal Reserve in a still “restrictive” policy stance.
The good news is that inflation appears to be easing—a main reason stocks touched all-time highs in the final quarter of the year. That easing trend showed up across several measures as the year progressed.
Goods inflation continued to cool as supply chains normalized, while housing-related inflation—one of the stickier components—began to decelerate with a lag.
Wage growth also moderated without a sharp rise in unemployment, reinforcing confidence that inflation could come down without a recession.
Against the backdrop of moderating inflation, at its most recent meeting in December, the Fed dropped short-term rates by another quarter-point. This was the third rate cut since Jerome Powell’s late-August 2025 pivot in Jackson Hole.
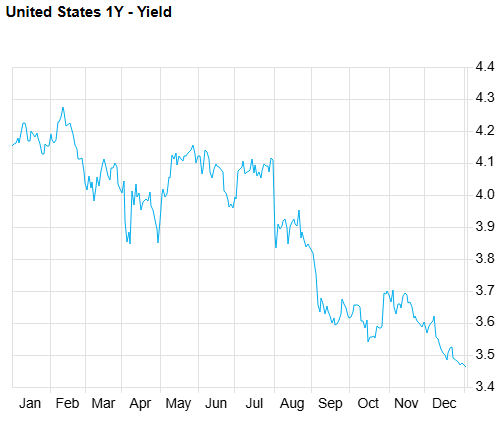
An improving inflation outlook led to a substantial decline in One-year Treasury yields over the course of the year, especially in the final months. |
|
|
|
One-Year Treasury Yields(Last 12 months) |
|
|
Rates influence sector performance
The Financial sector led performance in December. This can be explained to a large degree by shifts in the yield curve.
With the December interest rate cut, short-term interest rates fell notably. The One-year Treasury yield fell from 3.59% at the end of November to 3.47% at the end of December.
Meanwhile, partly as a result of an improved growth outlook, long-term Treasury yields rose. The Ten-year Treasury yield increased from 4.01% at the end of November to 4.17% at the end of December.
These shifts in the yield curve—in this case, a “steepening,” with short rates coming down and long rates going up—were not extreme but can be impactful in an otherwise relatively quiet market.
Financial stocks, especially banks, benefit from a steeper yield curve. Banks have to pay depositors less in an environment of lower short-term interest rates. If long-term rates simultaneously rise, they can earn more by placing those funds into higher yielding long-term instruments. |
|
|
| |
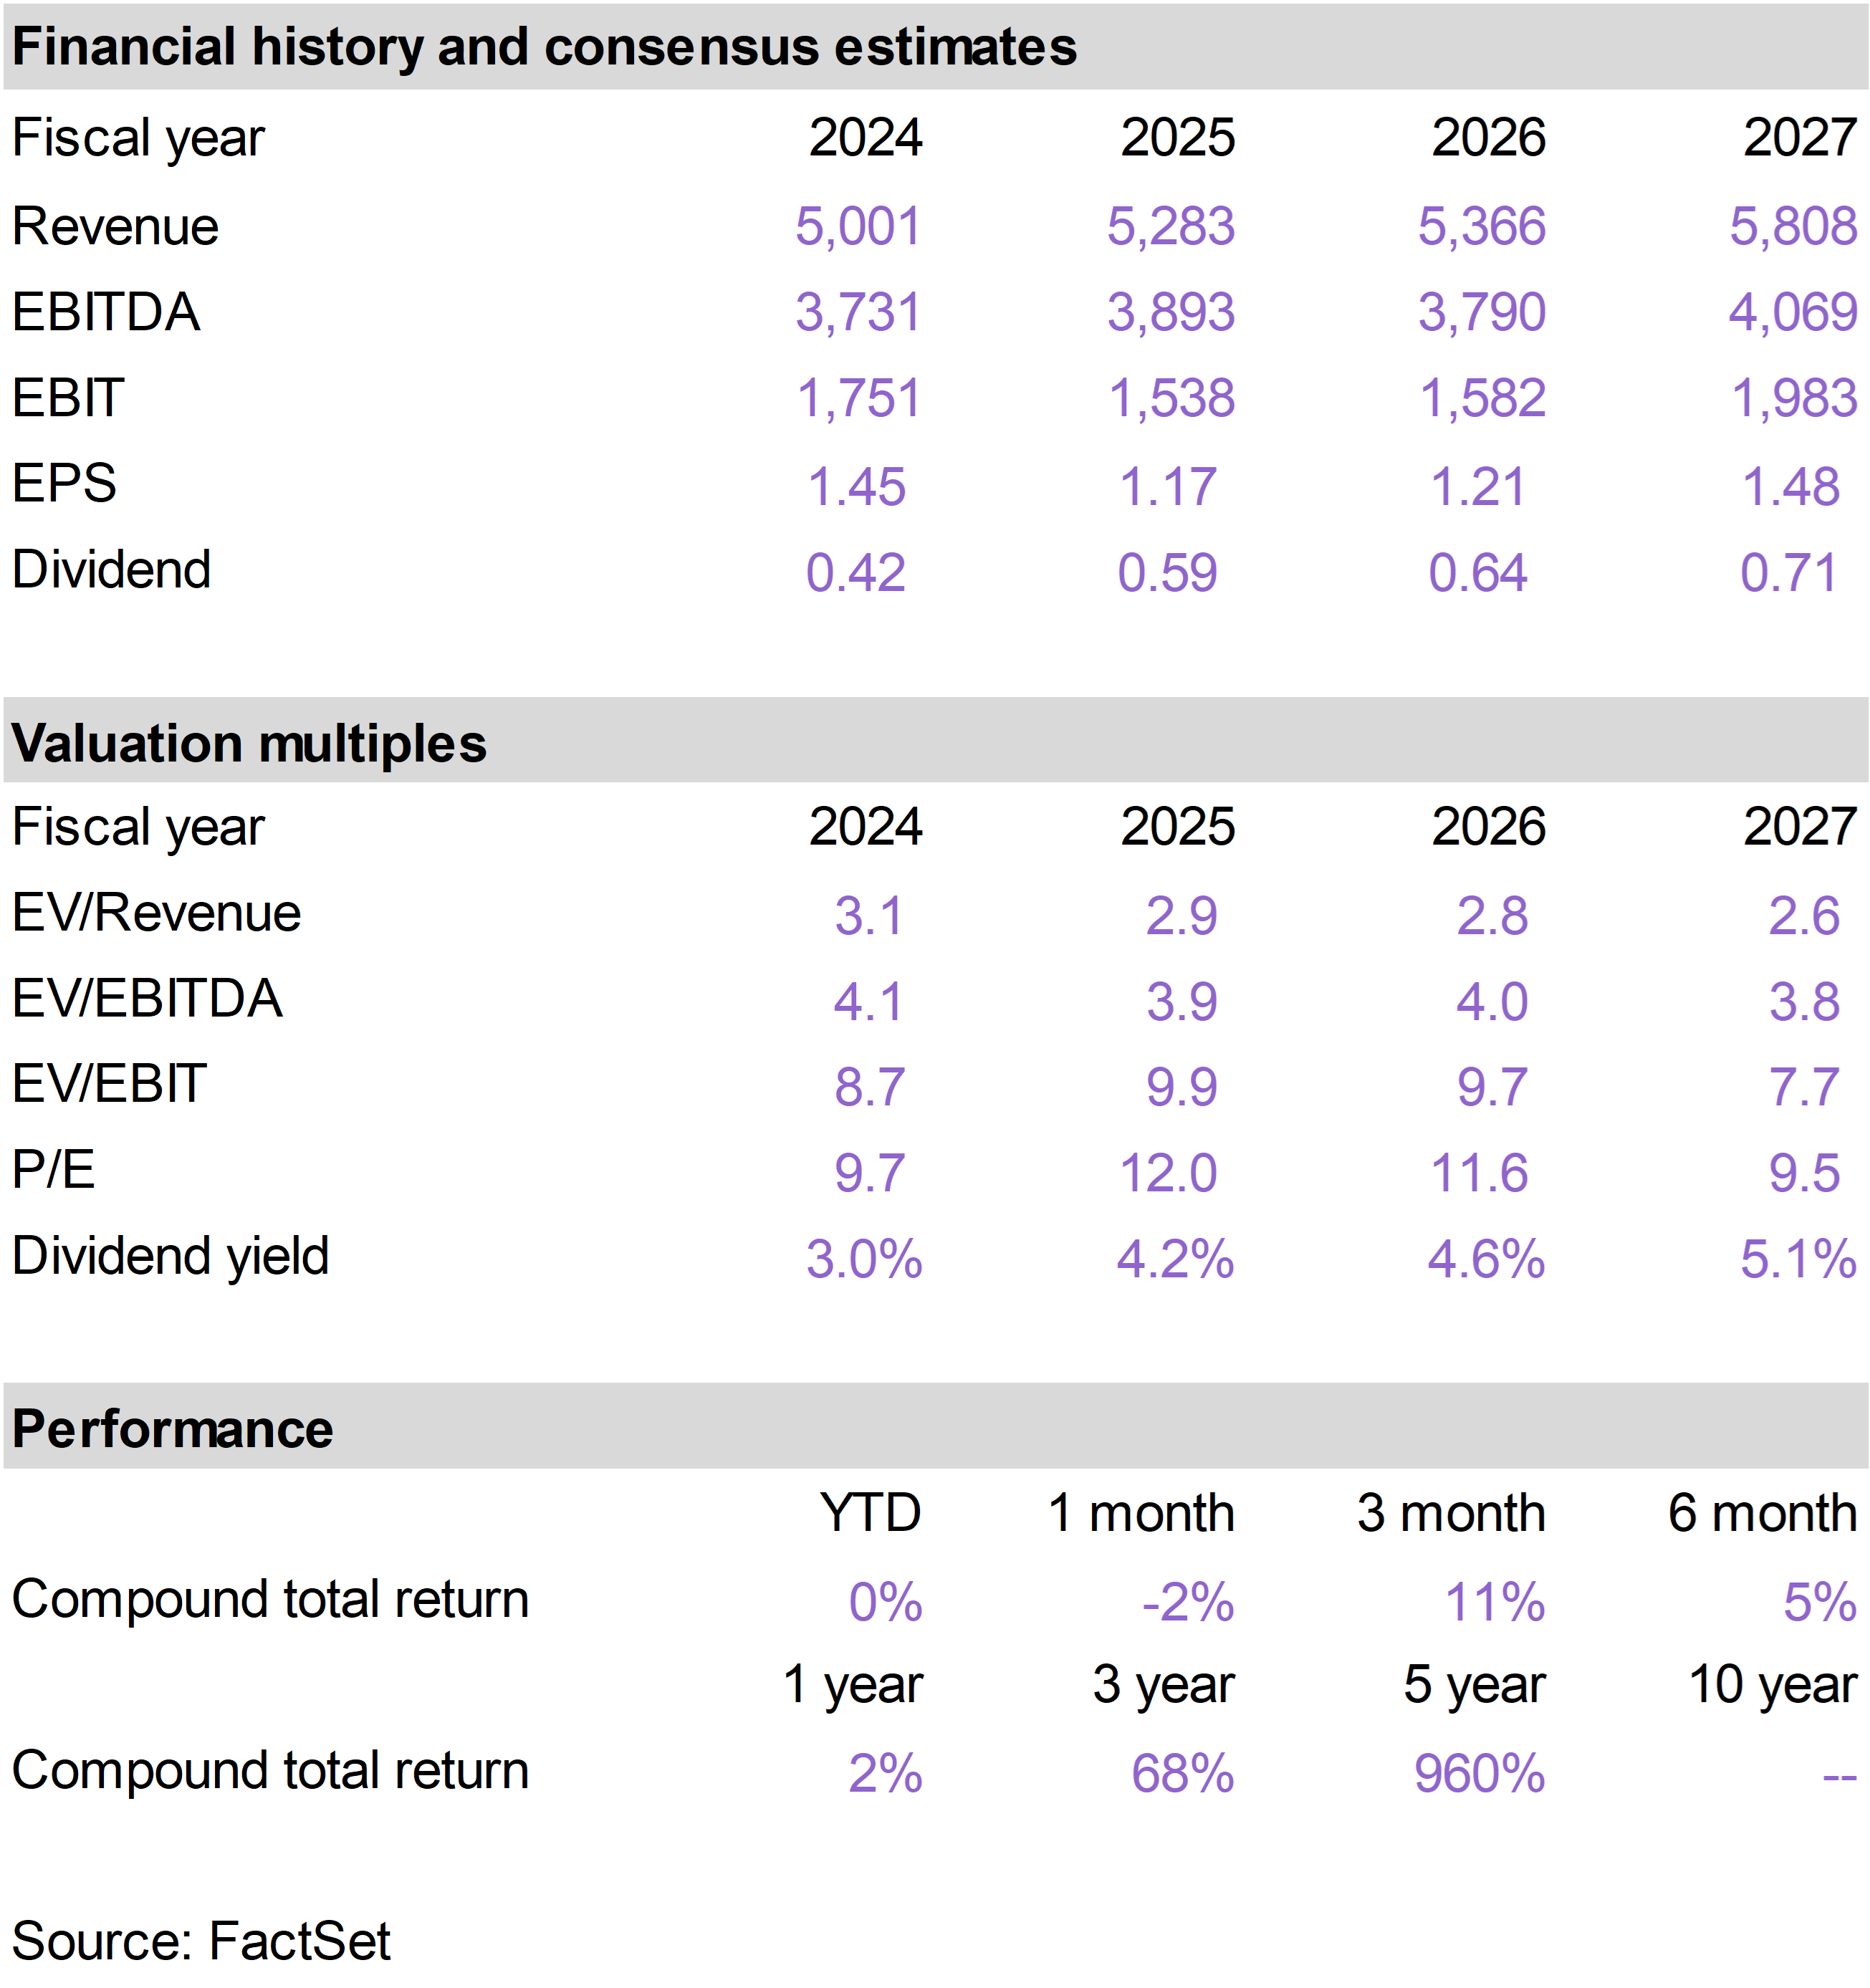
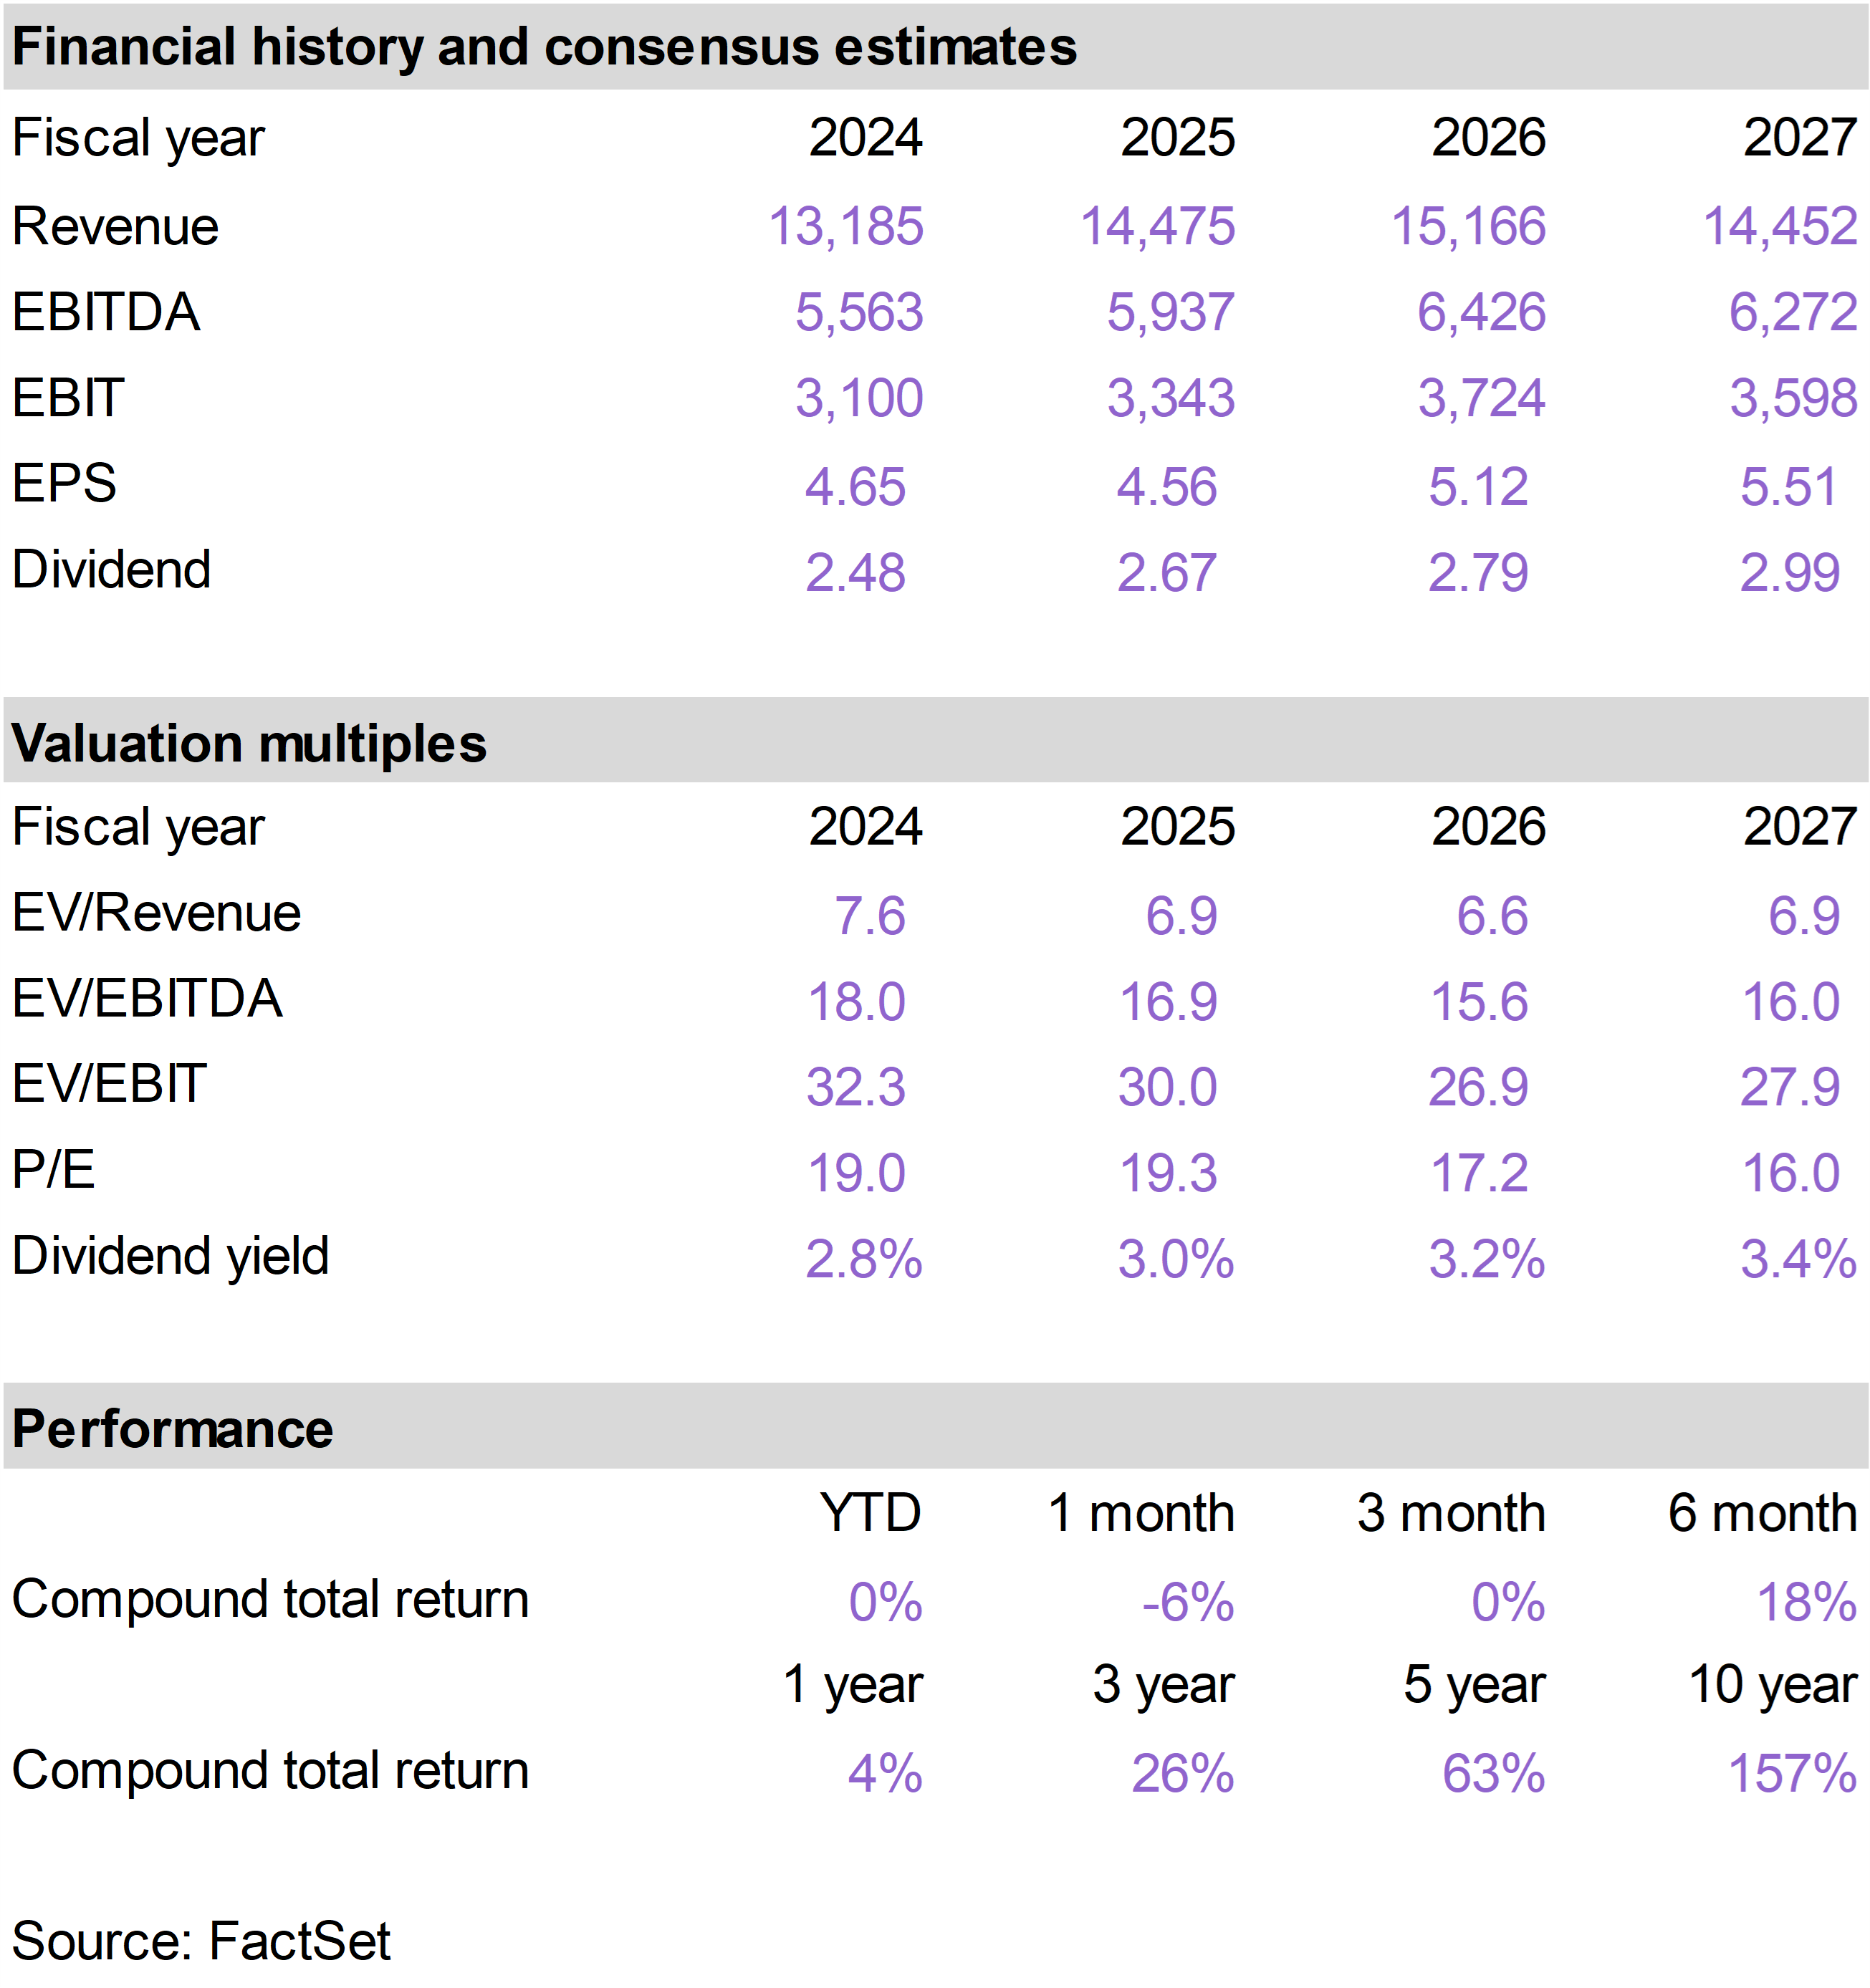
Given the rise in long-term yields in December, it is unsurprising that Utilities were the worst performing sector, followed by other defensive sectors that are also sensitive to movements in long-term rates (Real Estate, Health Care, Consumer Staples).
Utilities are stocks but trade with a high-correlation to long-term bonds because their value is similarly based on stable long-term cash flows. The weakness in Utilities in December reflects the mild increase in long-term rates.
Could inflation undershoot?
After several years of high inflation, an increasingly important question for markets is whether inflation could fall faster and further than expected. Several factors seem to be pointing in that direction.
First, goods inflation has already cooled meaningfully as one-time tariff impacts (which were probably milder than many people expected anyway) have already become embedded in price levels.
Second, housing inflation, which moves with long lags, is beginning to roll over as lower new-lease growth rates slowly feed into official data. The shelter component represents as much as one-third of the Consumer Price Index (CPI).
Third, moderately rising unemployment alleviates wage pressures. Businesses are no longer scrambling to fill open positions as they were just a few years ago, when aggressive post-pandemic hiring led to notable labor shortages in certain areas.
When inflation peaked in 2022, the unemployment rate was as low as 3.5%, versus 4.6% today. To avoid inflation, the economy requires some labor market slack.
All of these positive cyclical trends are playing out just as AI-driven productivity growth, a more structural factor, is only now starting to take hold.
Inflation in recent months has been running just below 3%, meaningfully above the Fed’s 2% target. This is basically the only reason that Fed has not been more aggressively cutting short-term rates, which are still elevated, as unemployment rates creep up.
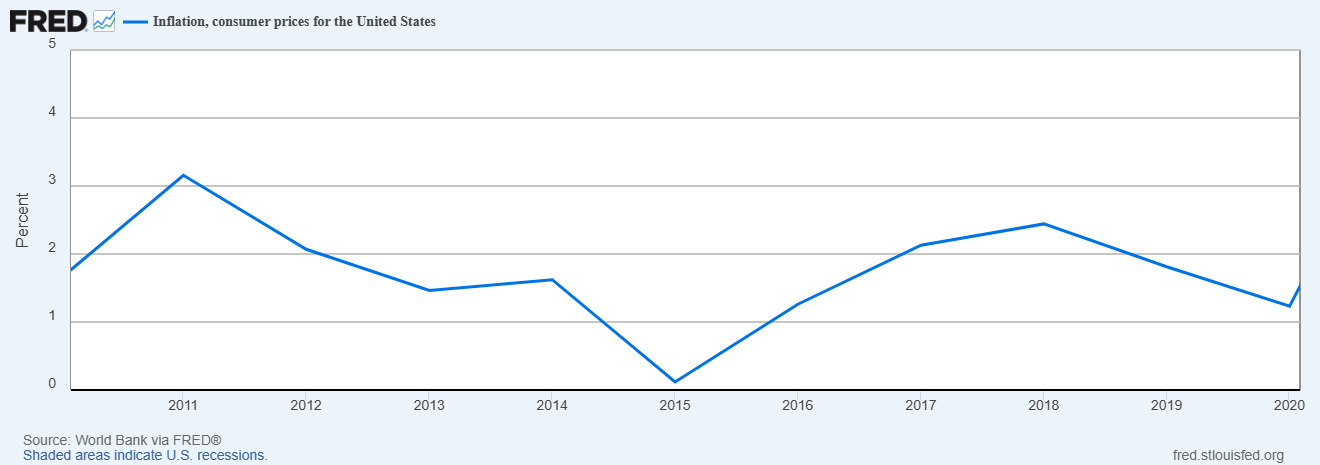
But it is worth remembering that for the ten-year period that preceded the pandemic, inflation rates were consistently below the Fed’s semi-official 2% target. |
|
|
|
Increase in Consumer Price Index (CPI)(2010-2020) |
|
|
The pandemic created an inflationary shock to the system that took many years to work through—a combination of supply chain disruptions and excessive monetary and fiscal stimulus.
Now, we potentially find ourselves returning to conditions that prevailed before the pandemic hit—a nimble, productive, high-tech economy that bypasses inflationary pressures.
As we look forward to 2026, we are mindful of the possibility of positive surprises on the inflation front. This would give the Fed, especially under the leadership of whoever President Trump decides to appoint as the next Chair, significant leeway to cut rates.
A return to the “old normal” of persistently low inflation is not currently priced into markets with long-term inflation expectations still north of 2%. This optimistic scenario represents a potentially significant source of upside for stocks, and risk assets in general, in the year ahead. |
|
| | | The top performing positions within the portfolio in December were Carlyle Group (CG), which returned 8%; Blackstone (BX), which returned 5%; and Texas Instruments (TXN), which returned 3%.
Portfolio detractors this month included Strategy 8% Preferred (STRK), which returned -8%; Sempra (SRE), which returned -6%; and WEC Energy Group (WEC), which returned -6%. |
|
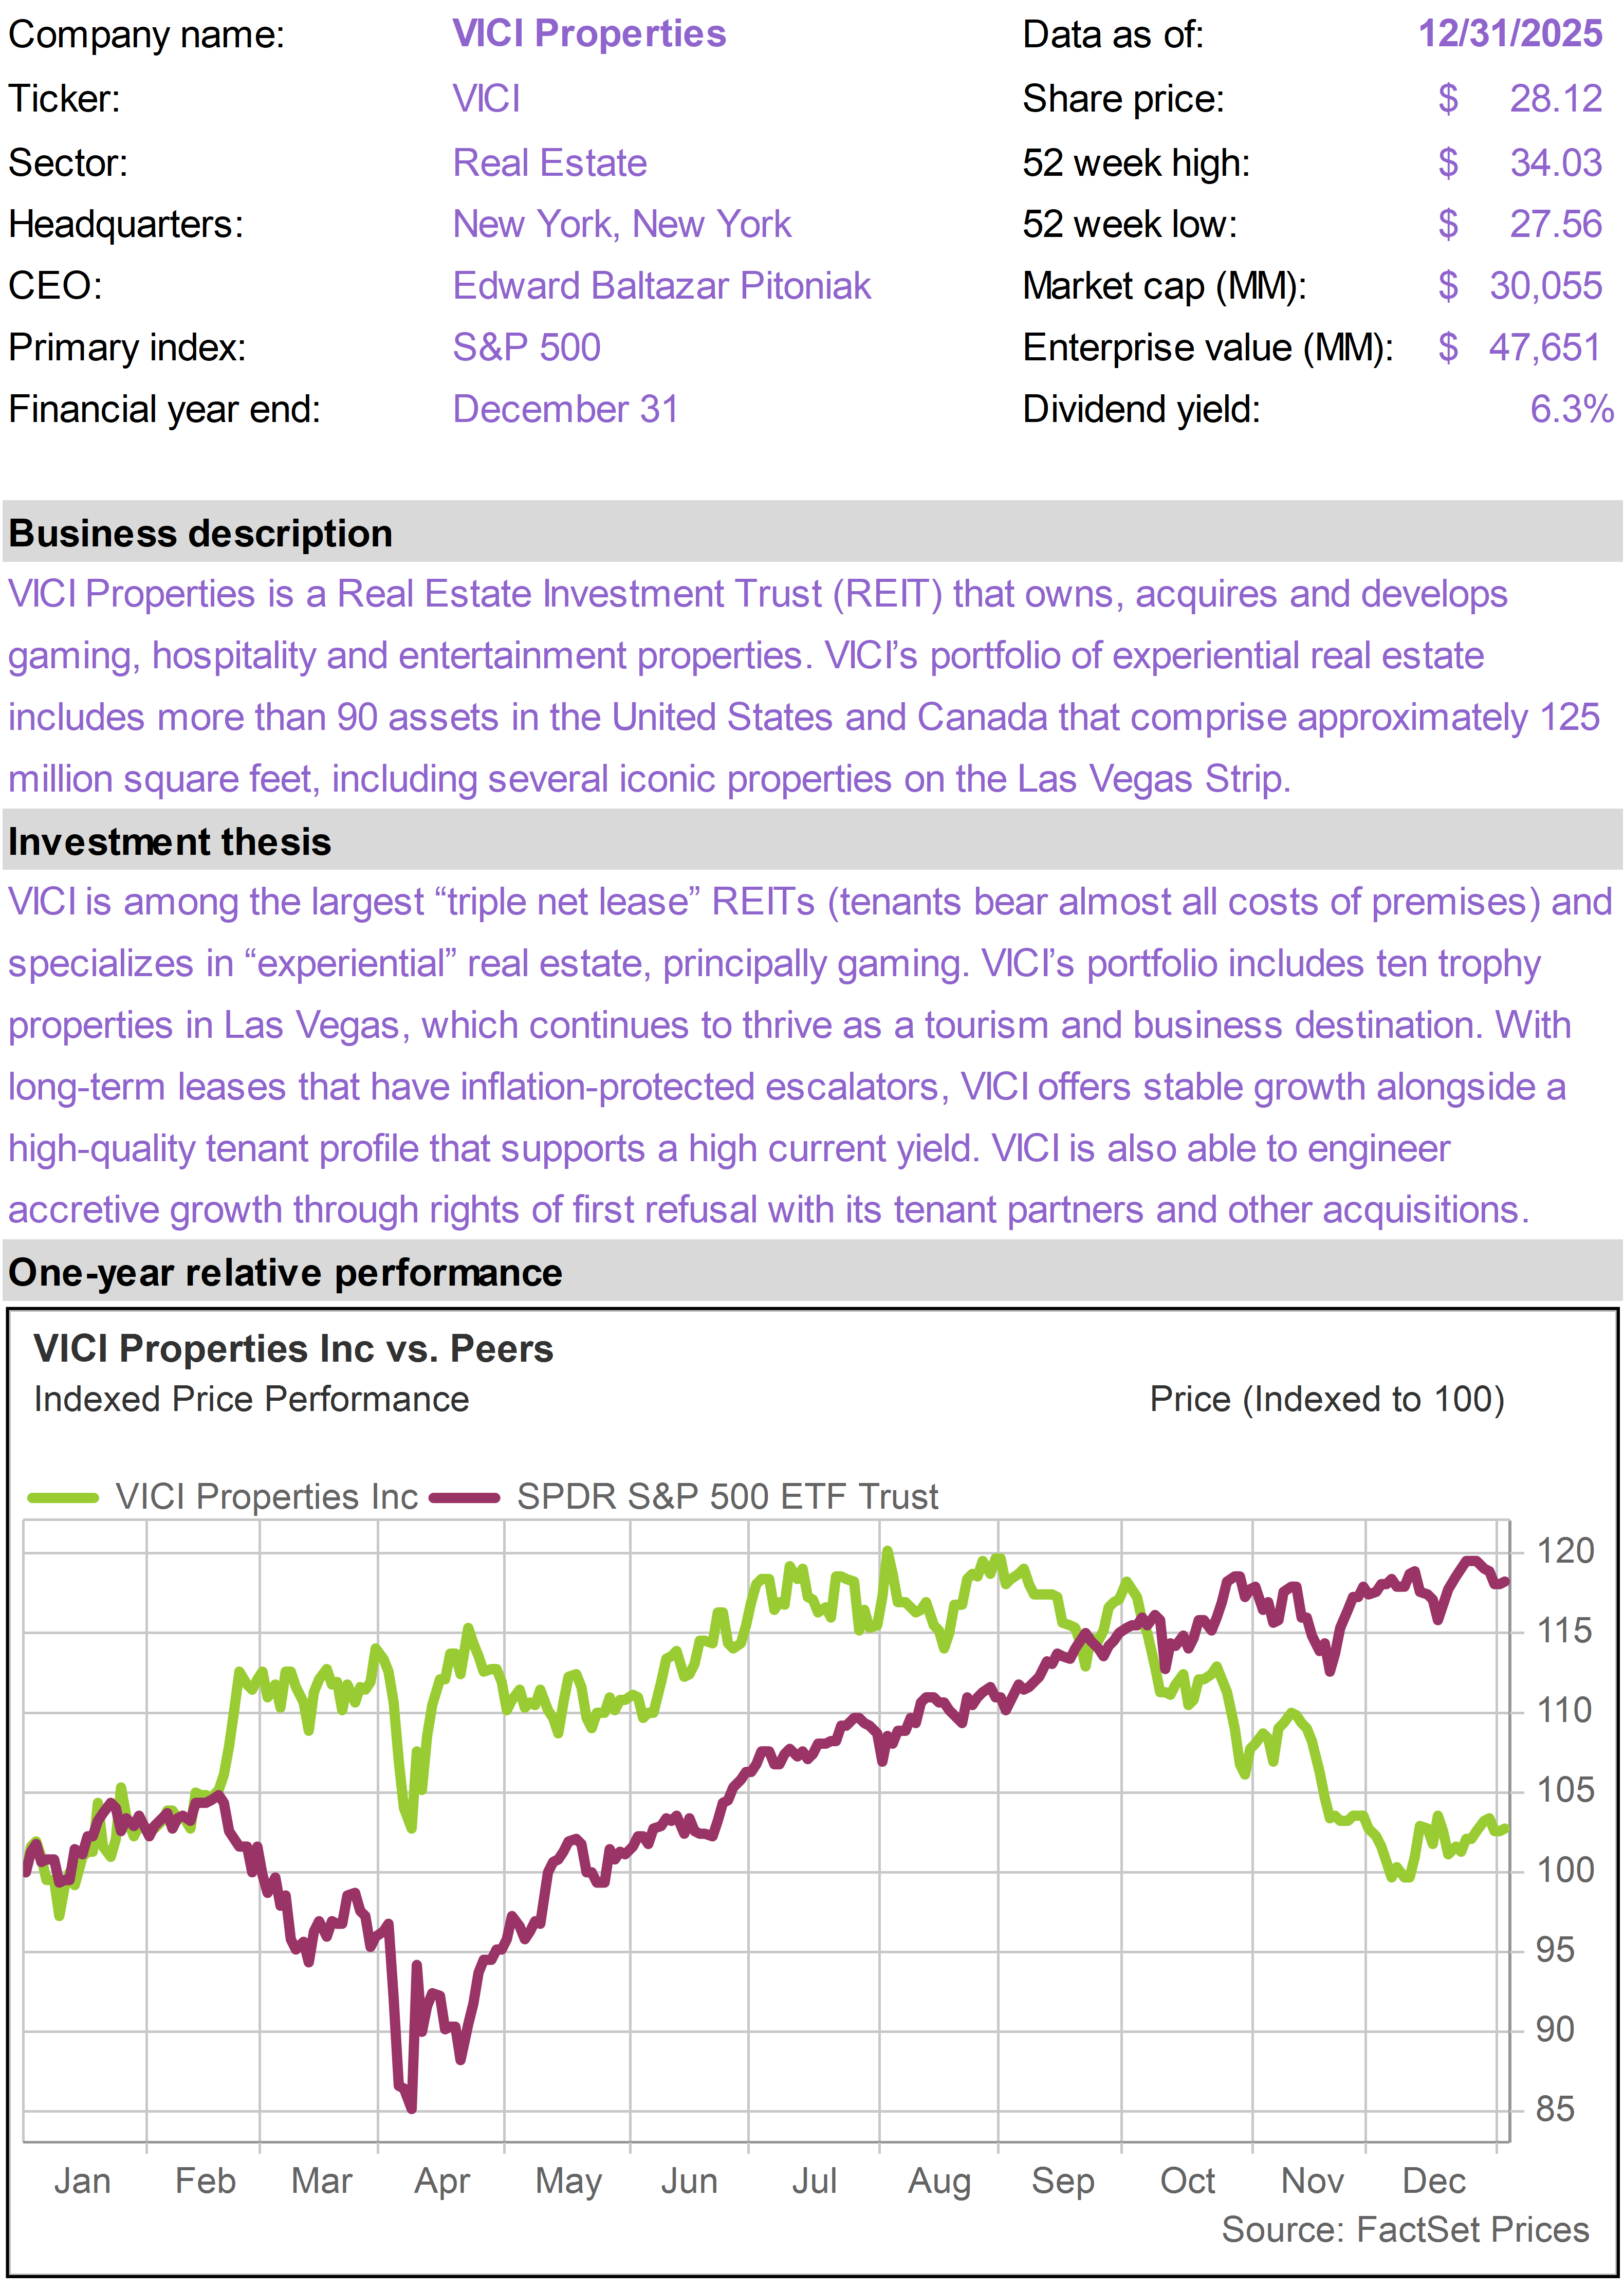
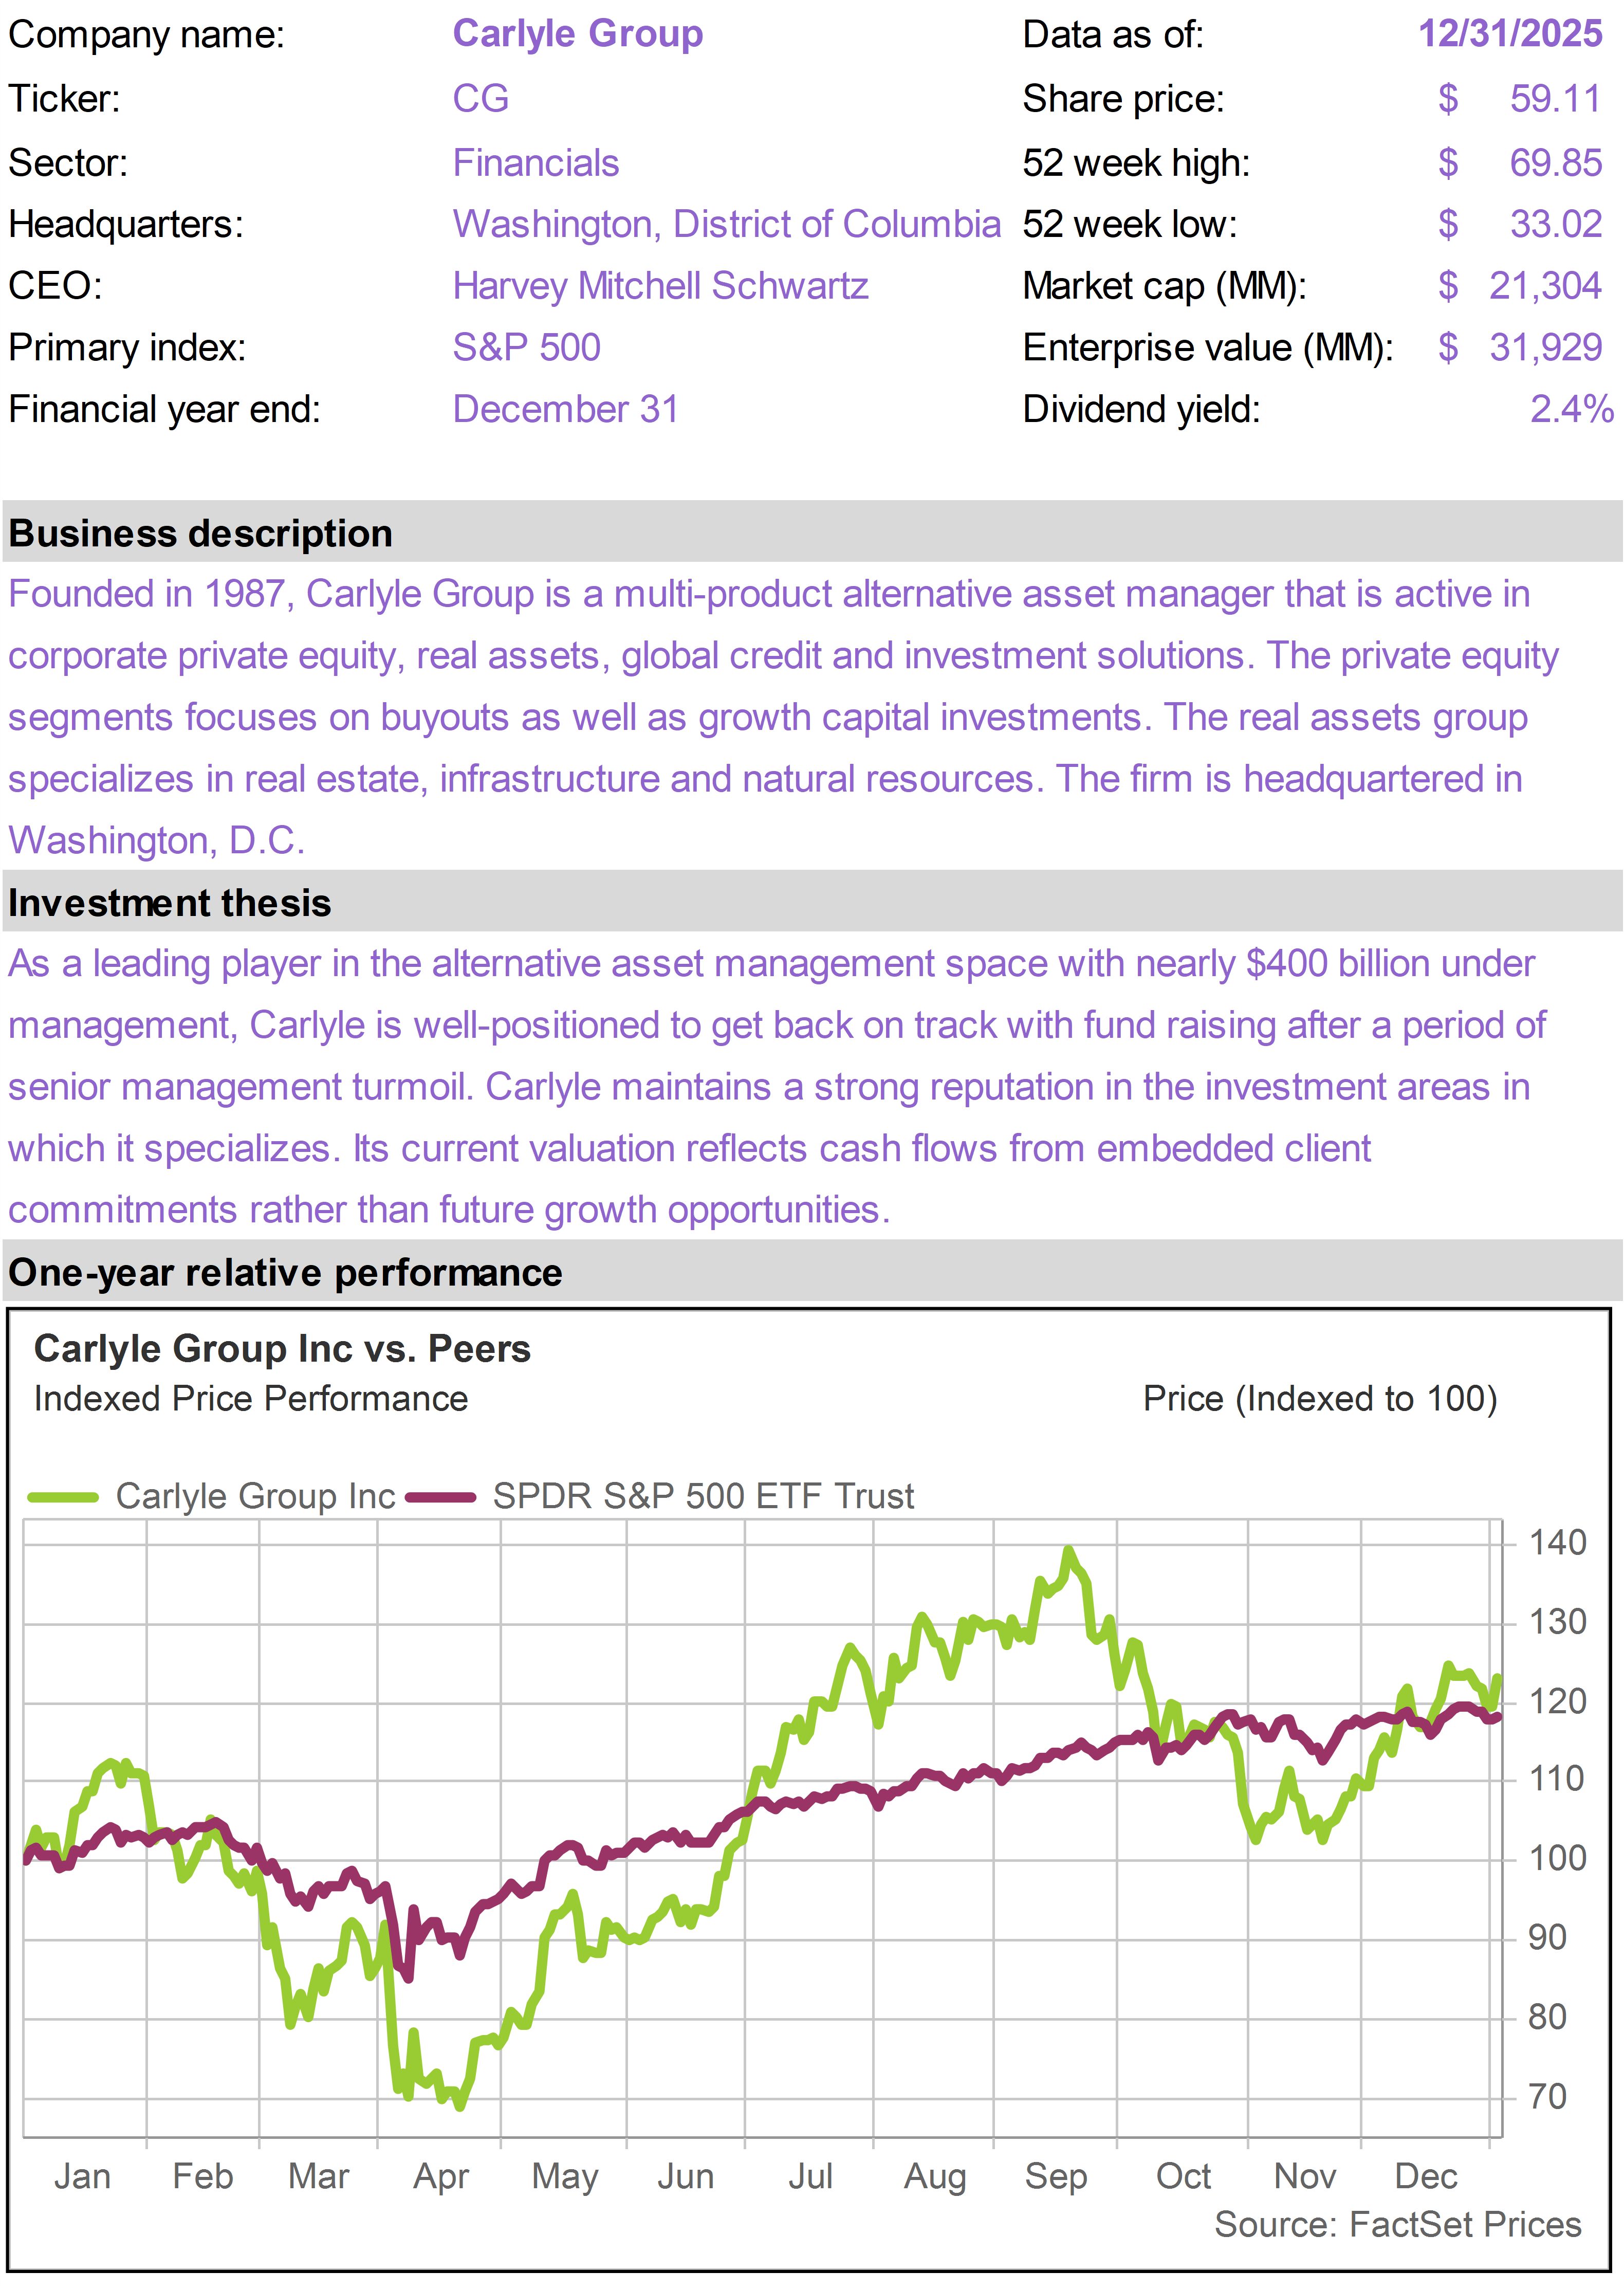
| Shares of alternative asset manager CG ended on a strong note and delivered a respectable 20% total return for the year.
CG is entering a more constructive phase after several years of uneven growth. Fundraising momentum is improving, management fees are set to accelerate, and the business is becoming more efficient as earlier investments begin to pay off.
CG’s growth in wealth and insurance channels is especially encouraging, adding steady, recurring revenue that tends to be more durable across market cycles.
With margins expanding and earnings expected to grow at a double-digit pace over the next few years, CG looks positioned to close the gap with peers that continue to trade at a relative premium. At today’s valuation, continued execution could translate into meaningful upside for long-term investors.
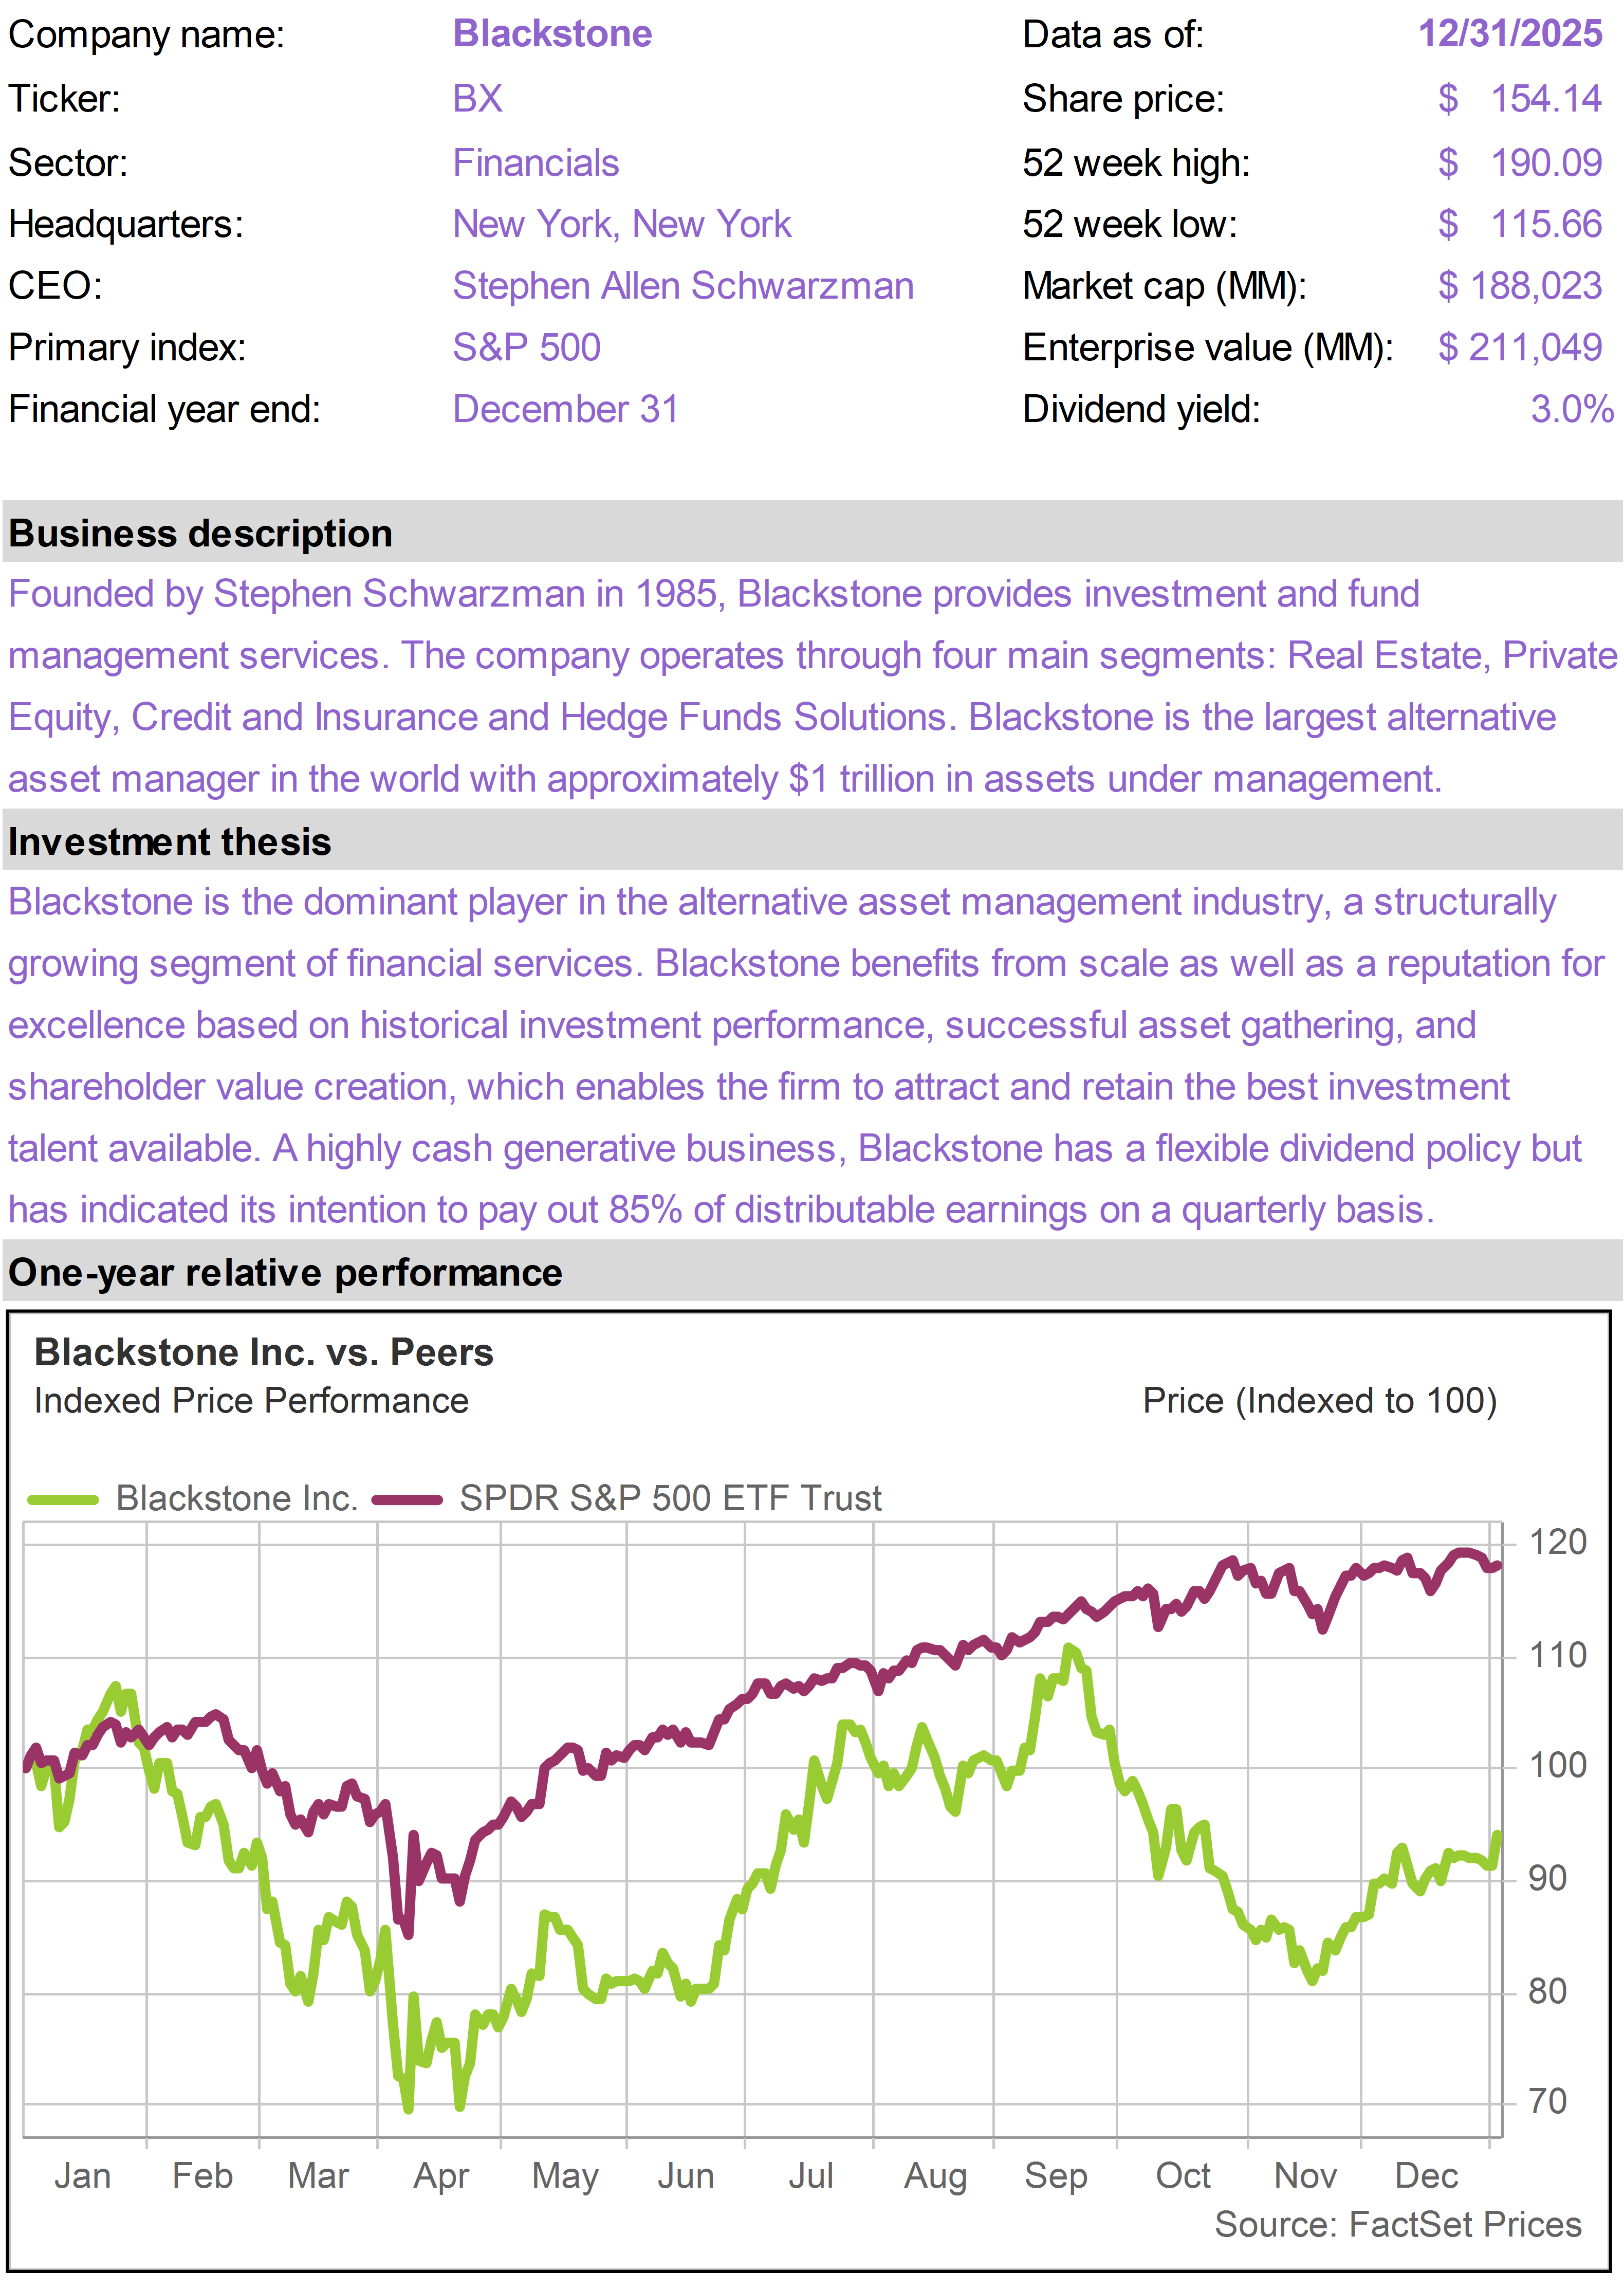
BX, which is the world’s largest alternative asset manager, also advanced in December. In late December, BX disclosed “realizations” (exit sales) on its portfolio investments that supported analyst expectations for profit growth.
Realizations matter because they represent the point where paper gains turn into actual cash and earnings. When BX successfully exits investments, it not only returns capital to investors but also unlocks performance fees and strengthens future fundraising.
Recent exit activity suggests markets are reopening and asset values are becoming easier to monetize. BX could be a significant beneficiary of looser monetary policy going forward, as deal activity accelerates and asset values rise.
TXN shares advanced, despite the modest pullback in technology. We continue to appreciate TXN as a rare tech stock that is both highly cash generative (dividend yield above 3% and growing) and well-positioned across key technology growth trends (AI, automation, robotics).
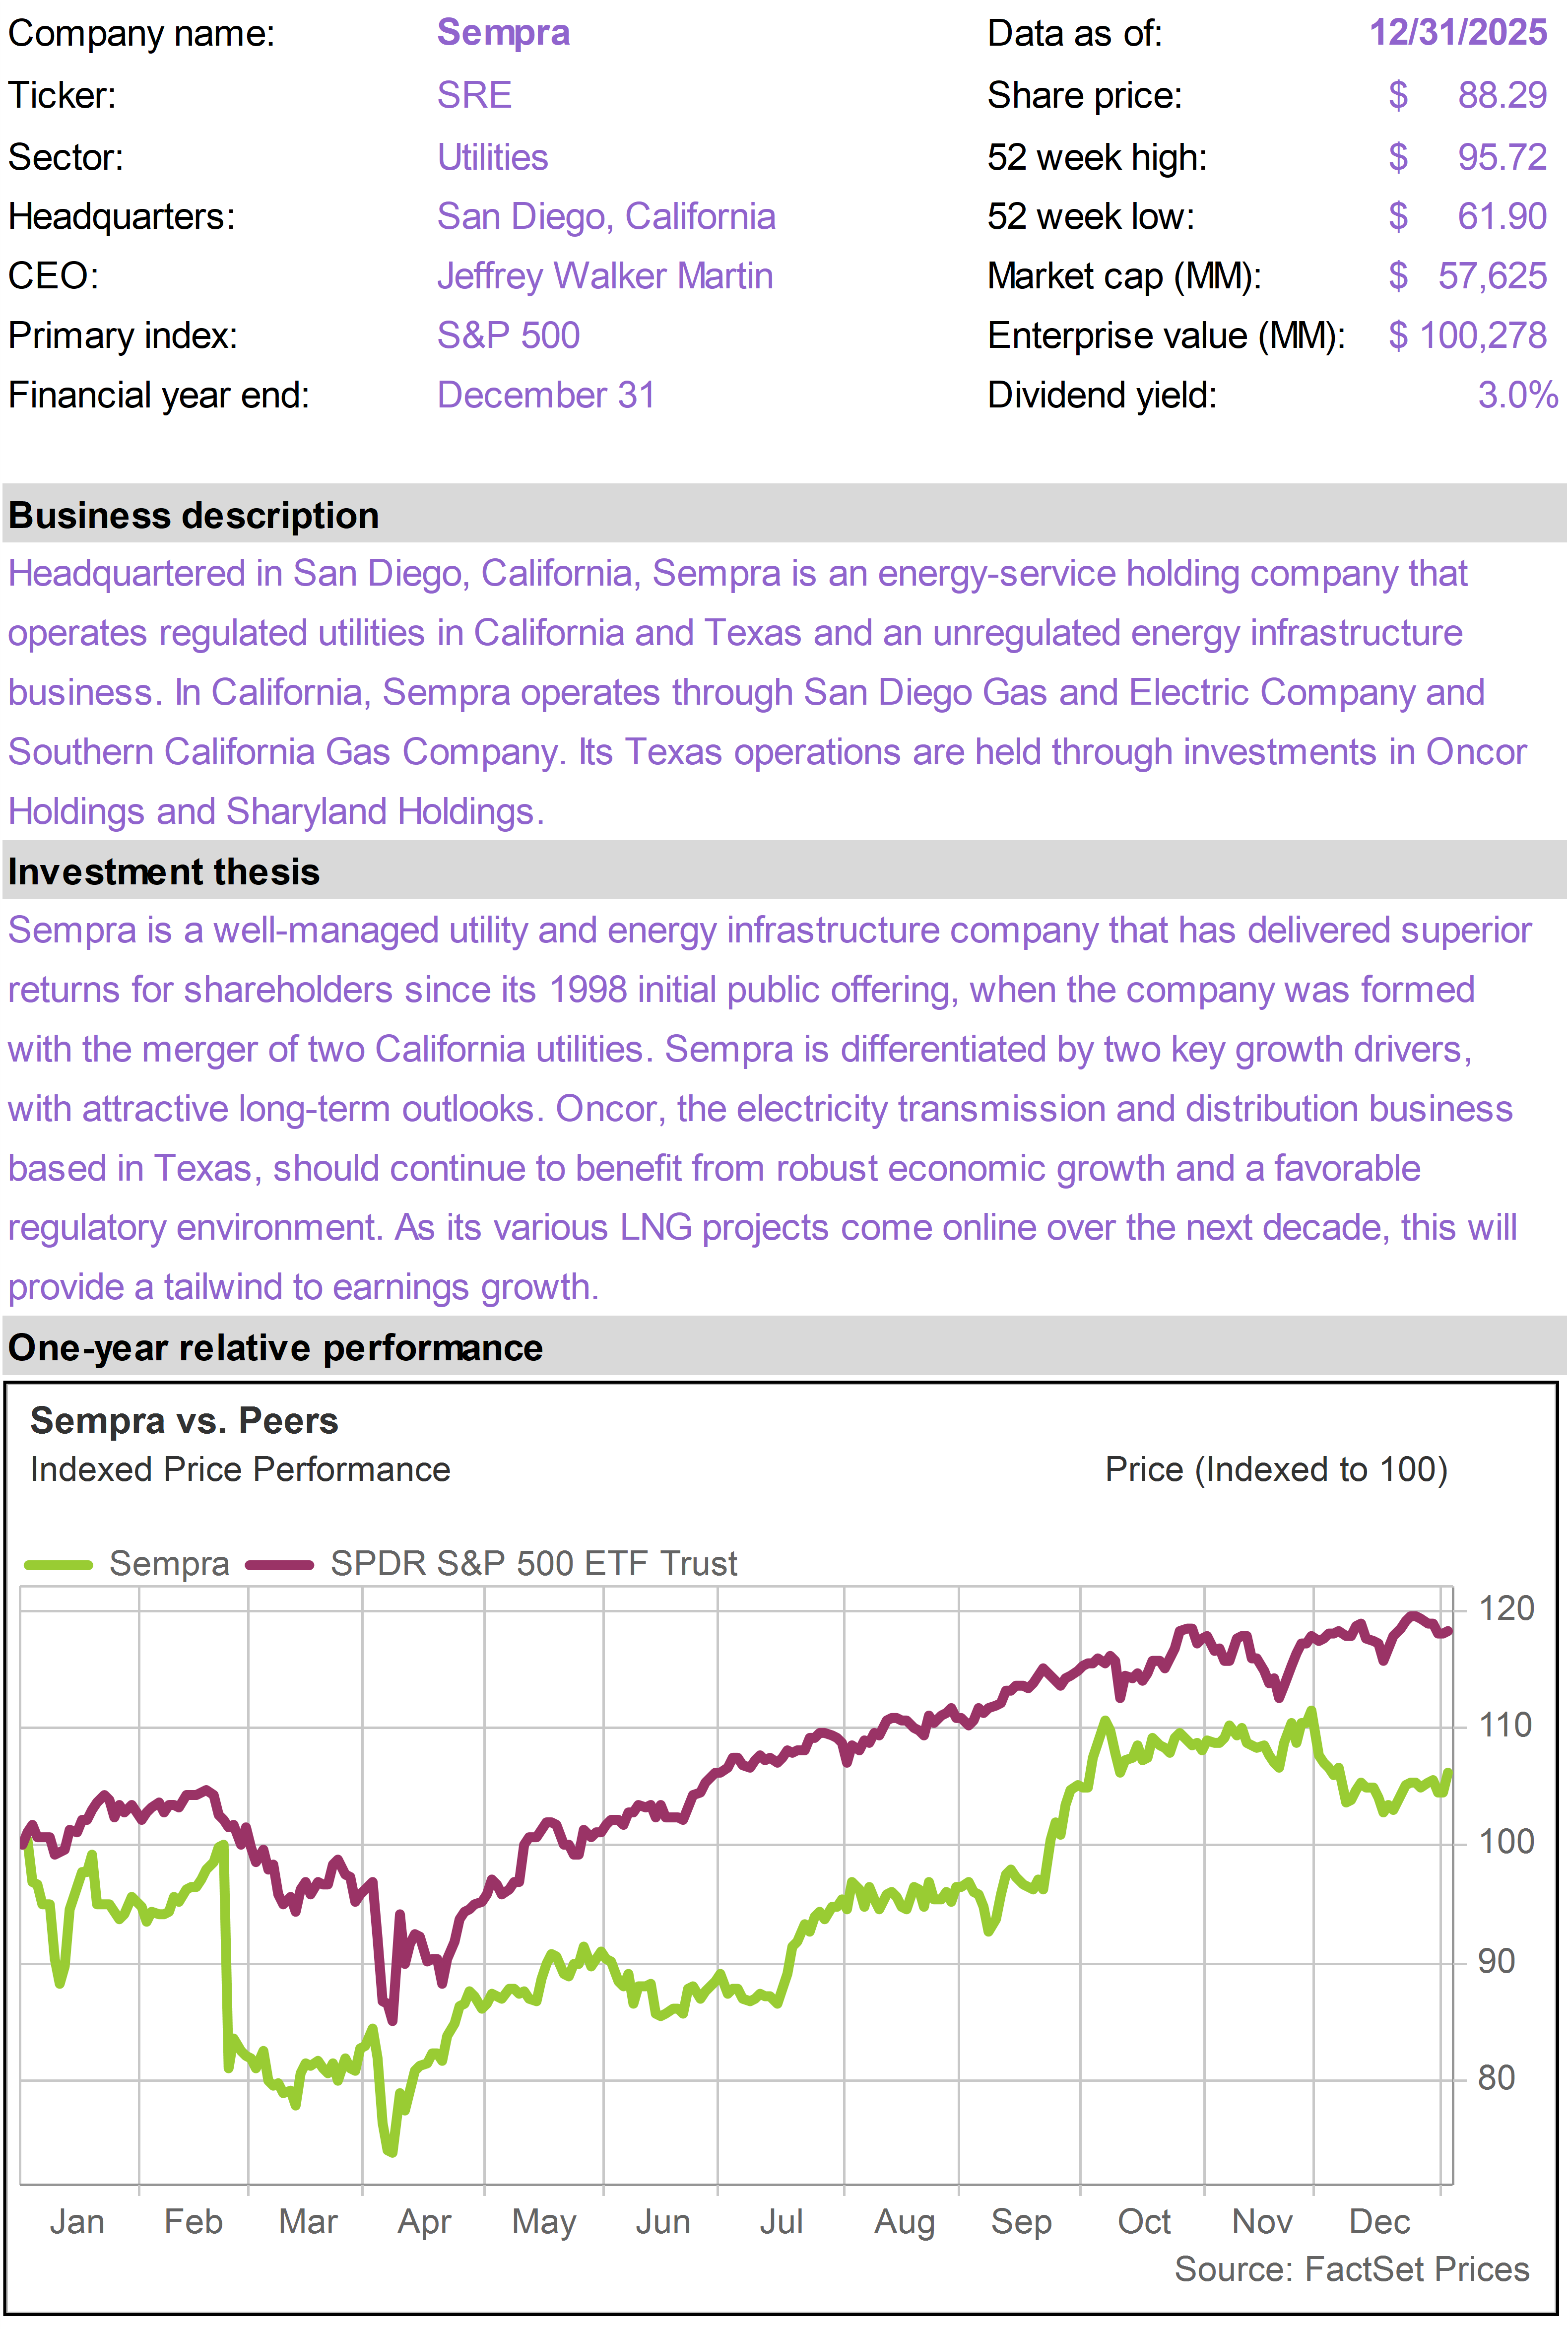
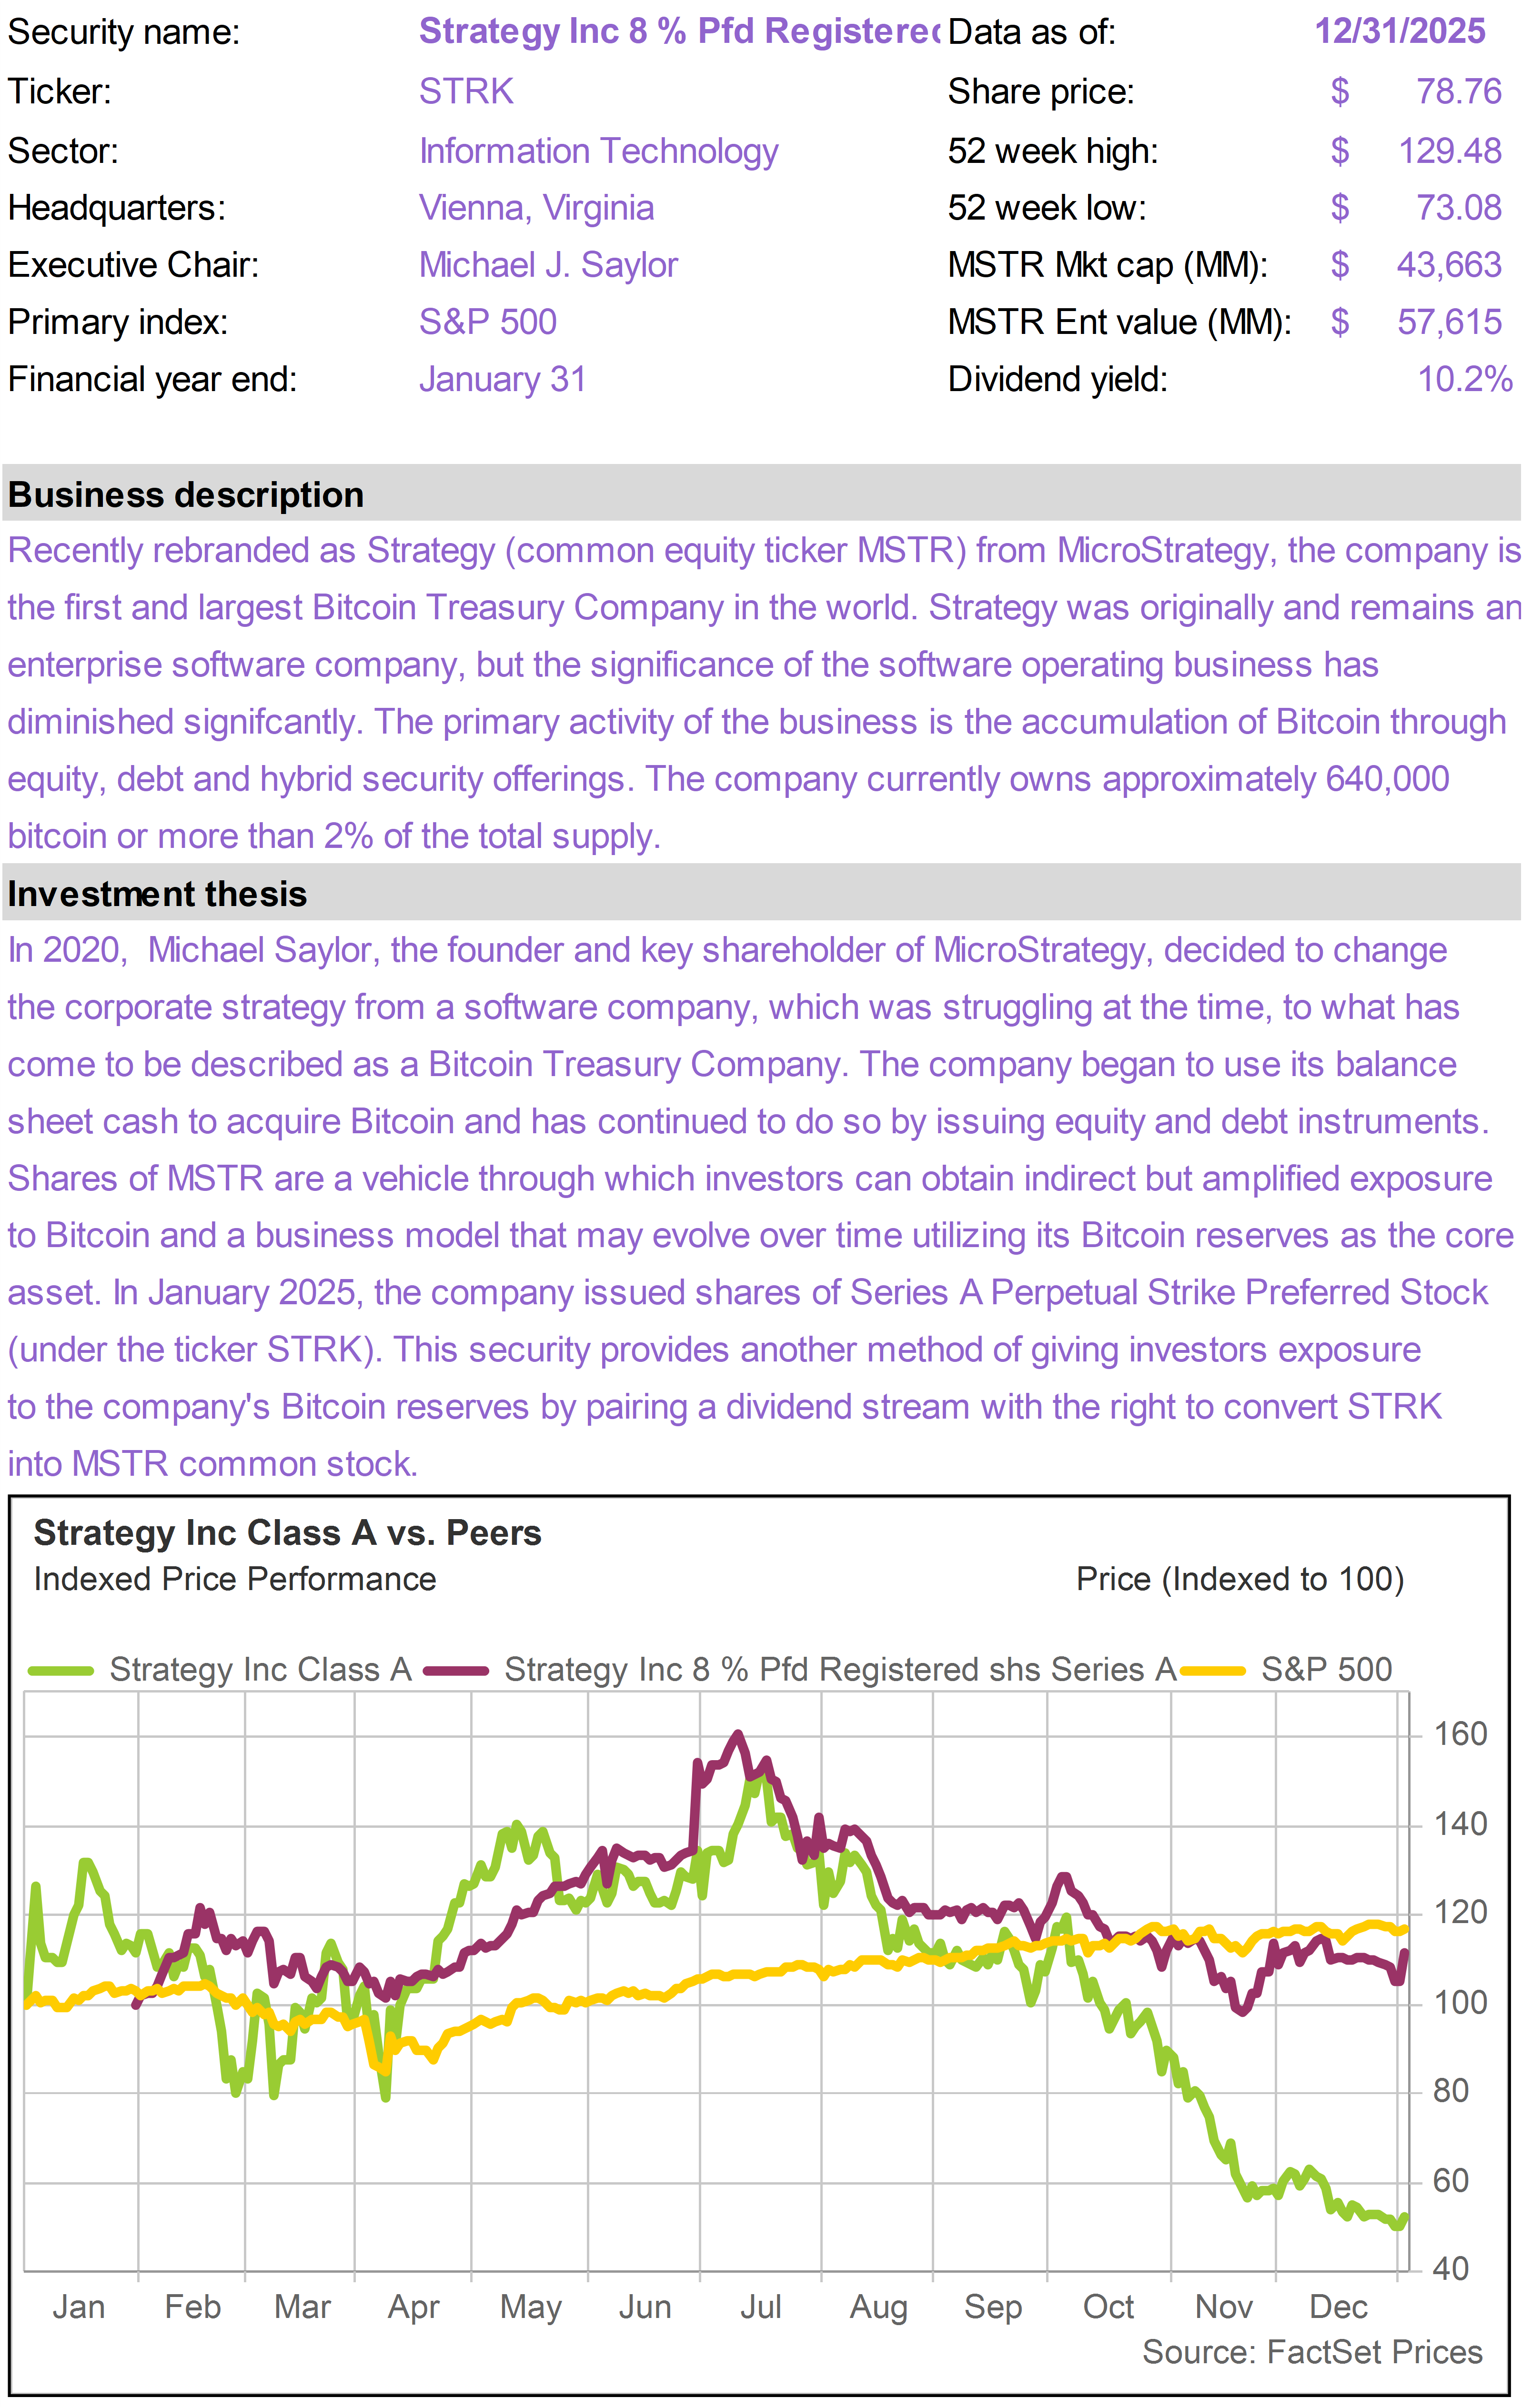
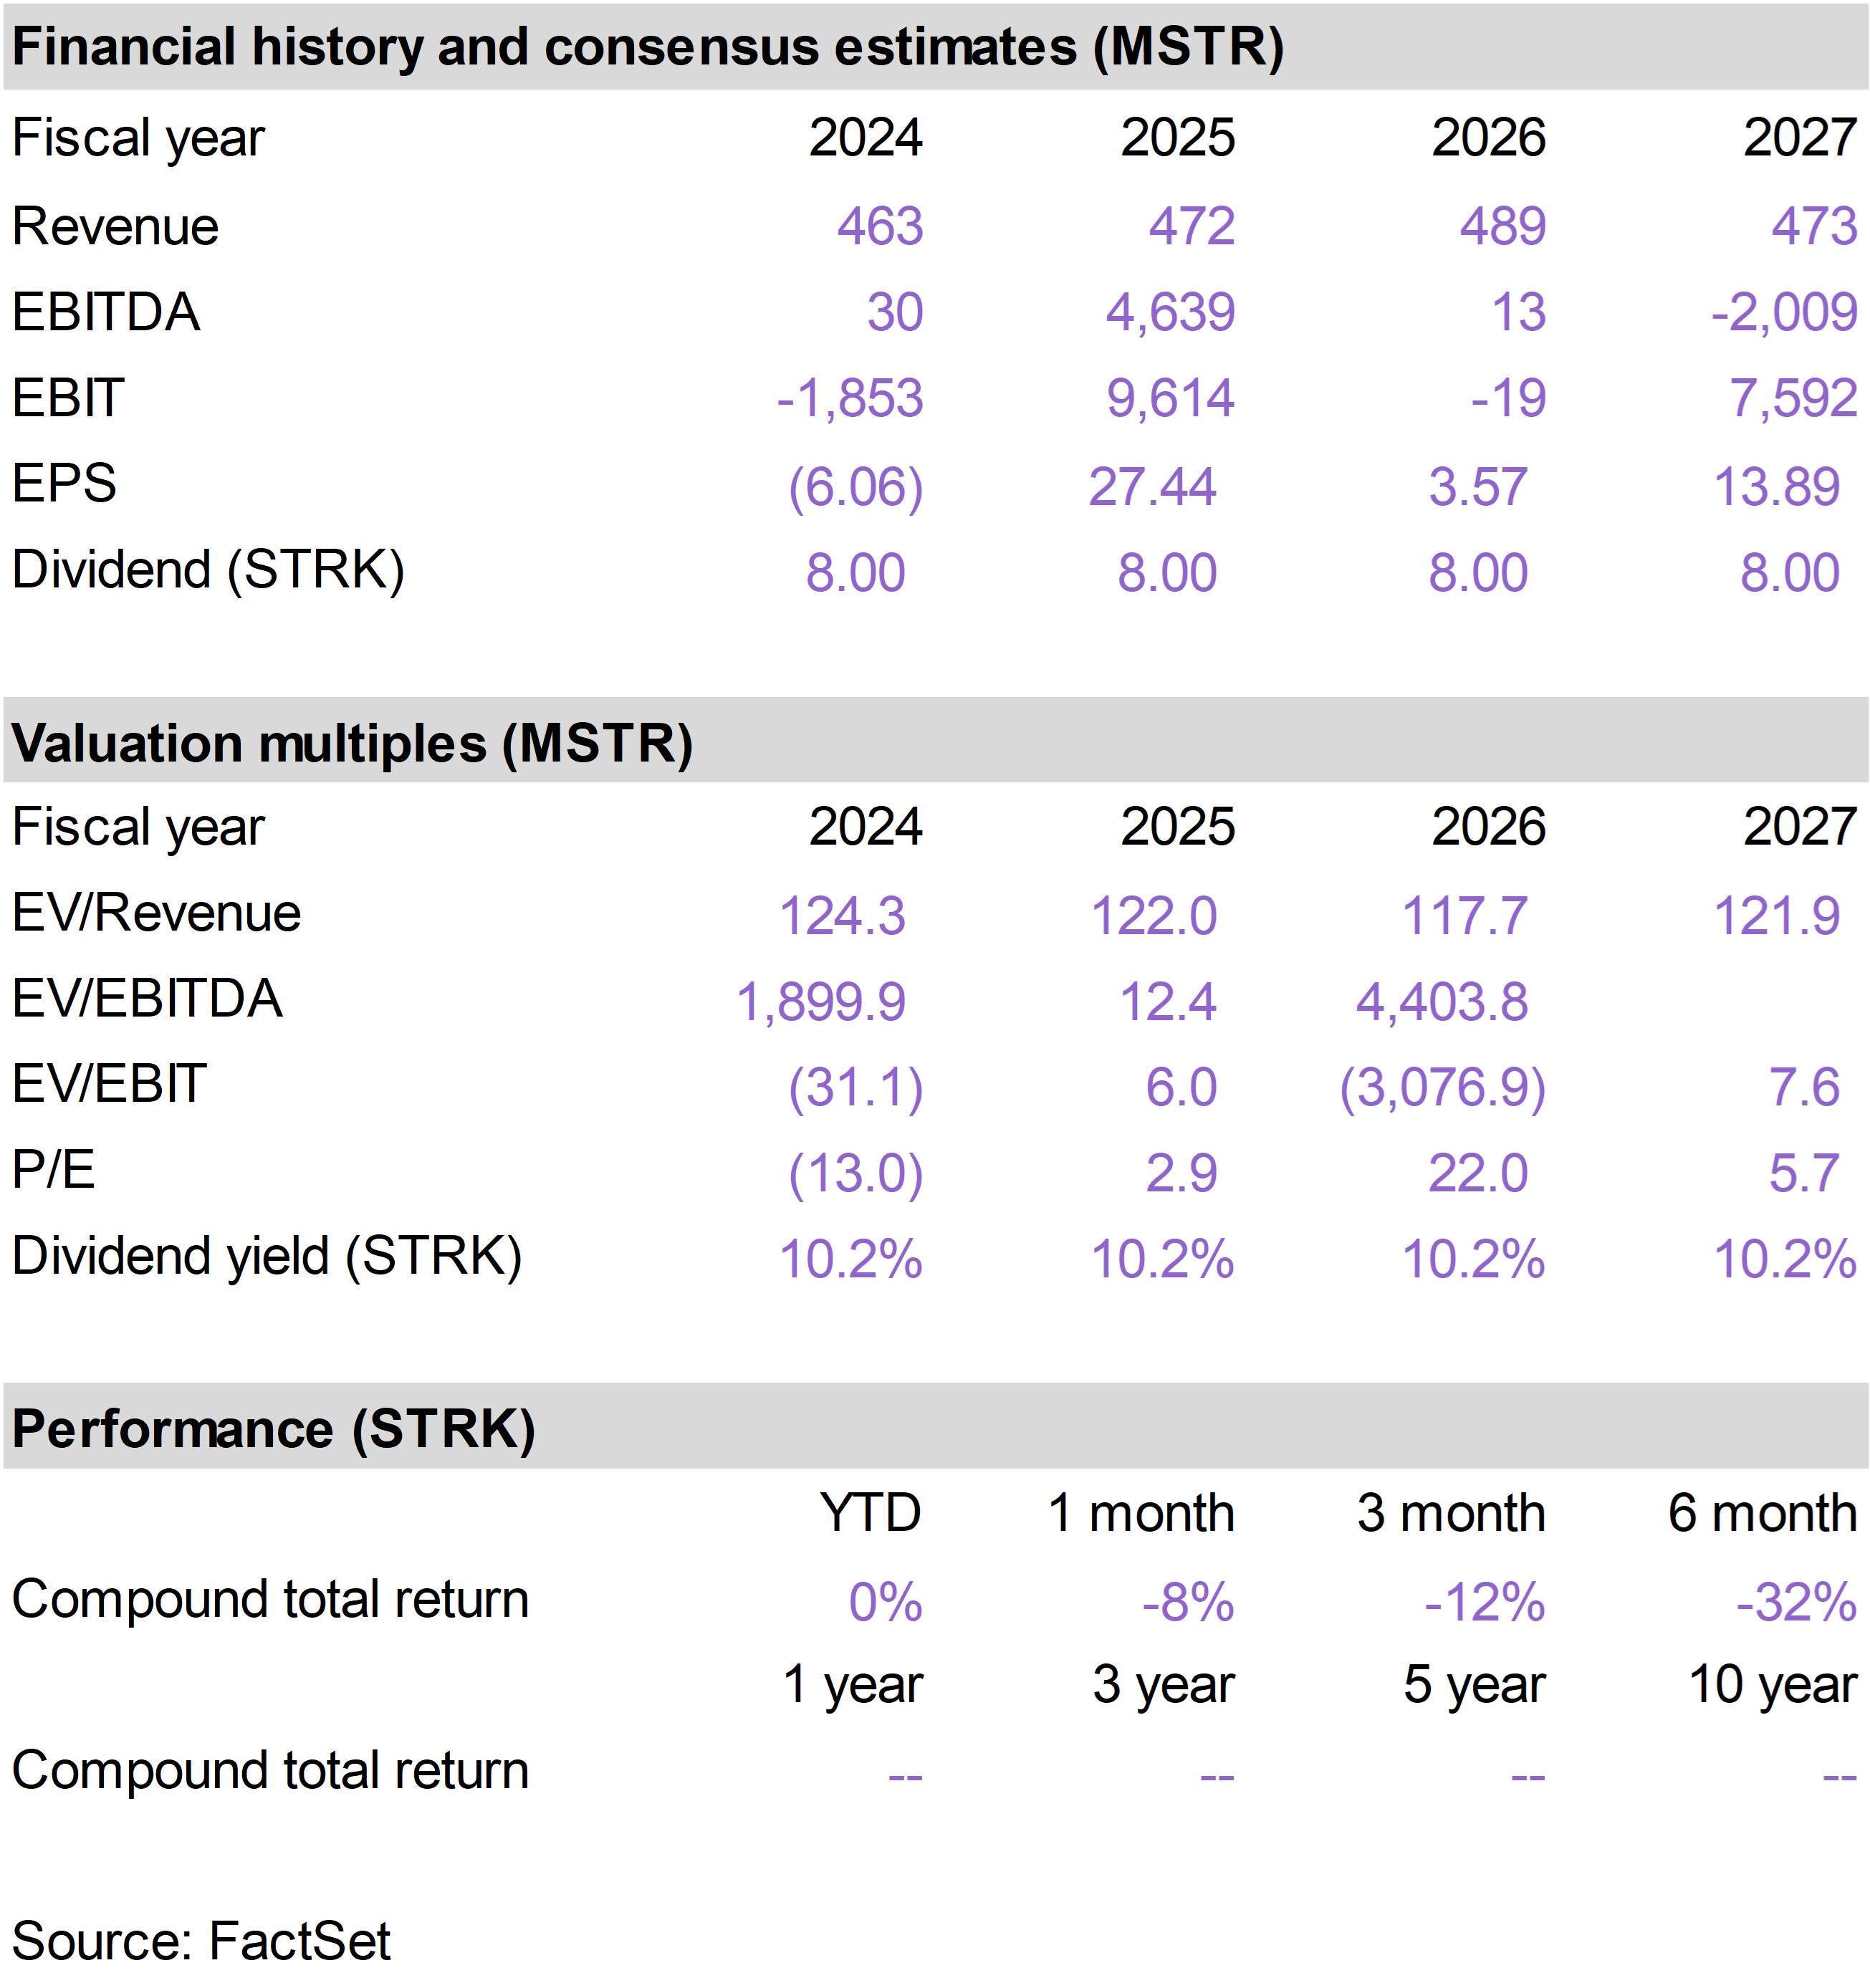
STRK was the worst performer in the portfolio in December. The shares were affected by poor performance of parent company Strategy (MSTR) and negative sentiment toward Bitcoin. Tax-loss selling of Bitcoin, MSTR and STRK likely contributed to the December weakness.
As of the morning of January 5, 2026, however, shares of STRK are already recovering, up 10% year to date, more than offsetting the December decline.
We continue to view STRK as an attractive income play (nearly 10% dividend yield) with long-term participation in Bitcoin upside.
STRK is relatively volatile, but because the company is so highly collateralized, we have high confidence that the dividend will be supported except in the most catastrophic of circumstances (e.g., a near total collapse in the price of Bitcoin).
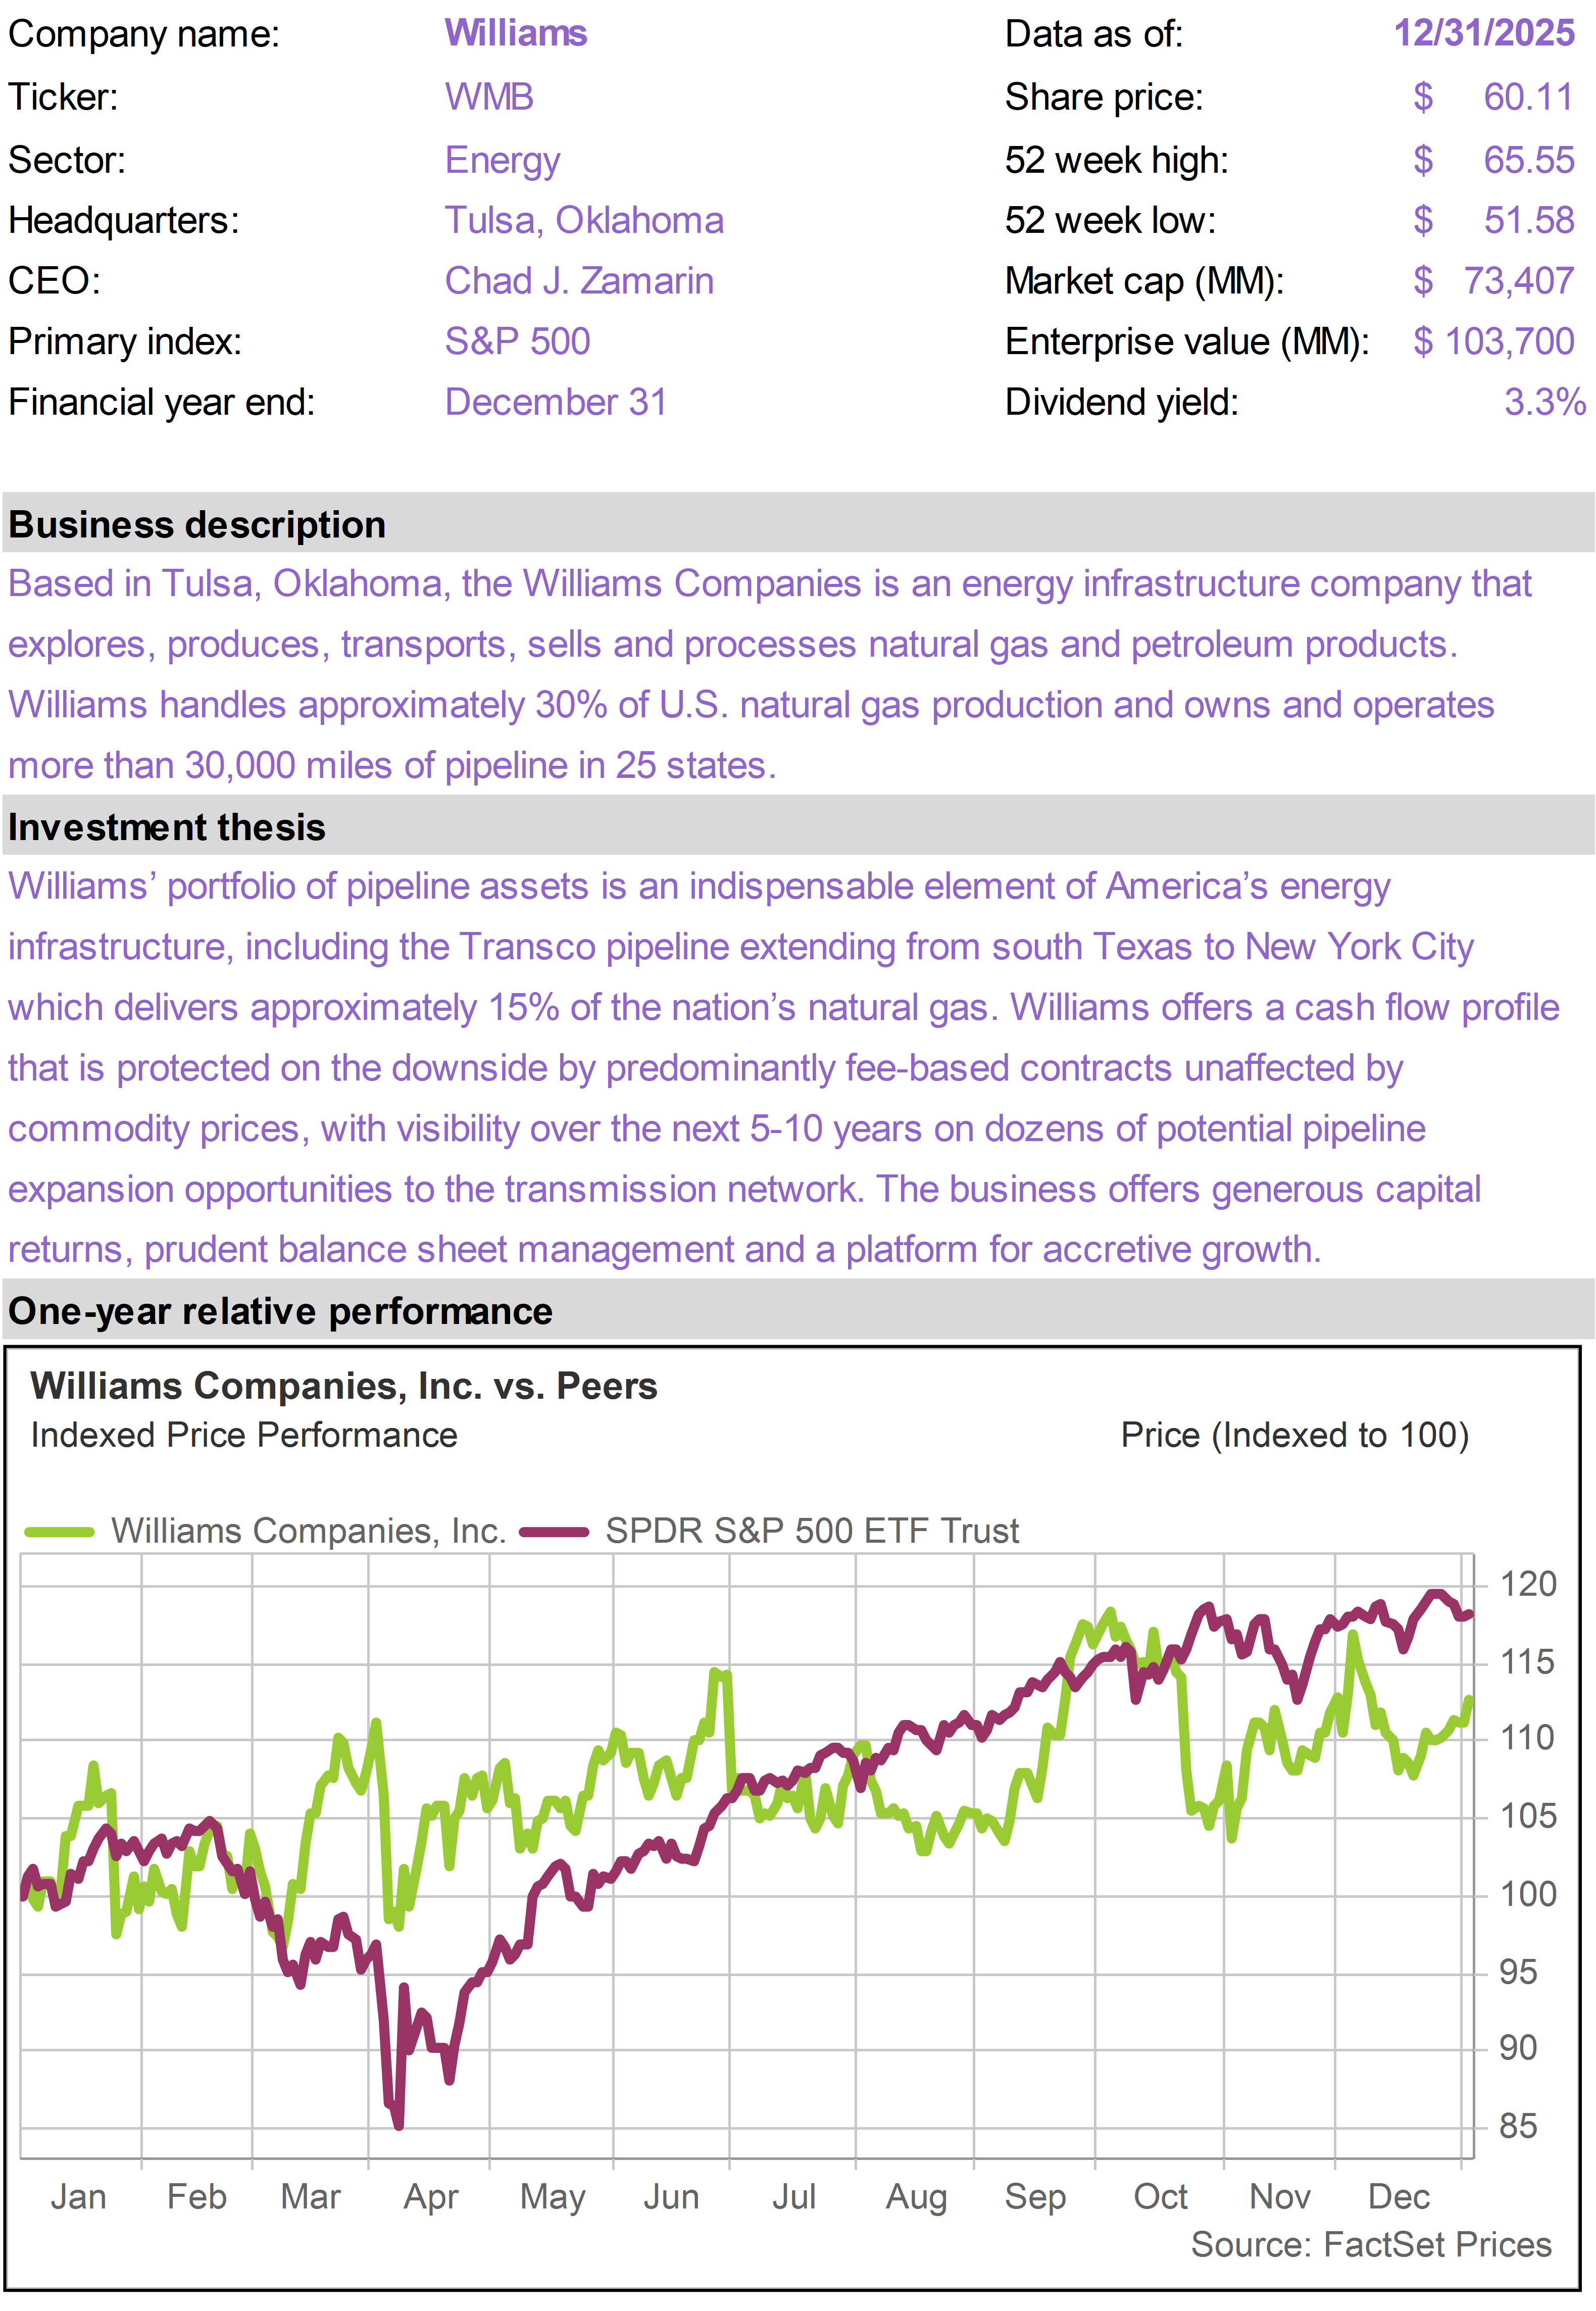
The portfolio’s utility names, SRE and WEC, declined in sympathy with the broader utility sector, which traded off with the mild rise in long-term interest rates in December. |
|
| | |
| | |
| | |
| | | |
|
| | Digital Realty Trust (DLR) |
|
|
|
| | |
|
| | |
|
| | |
|
| | |
|
| | |
|
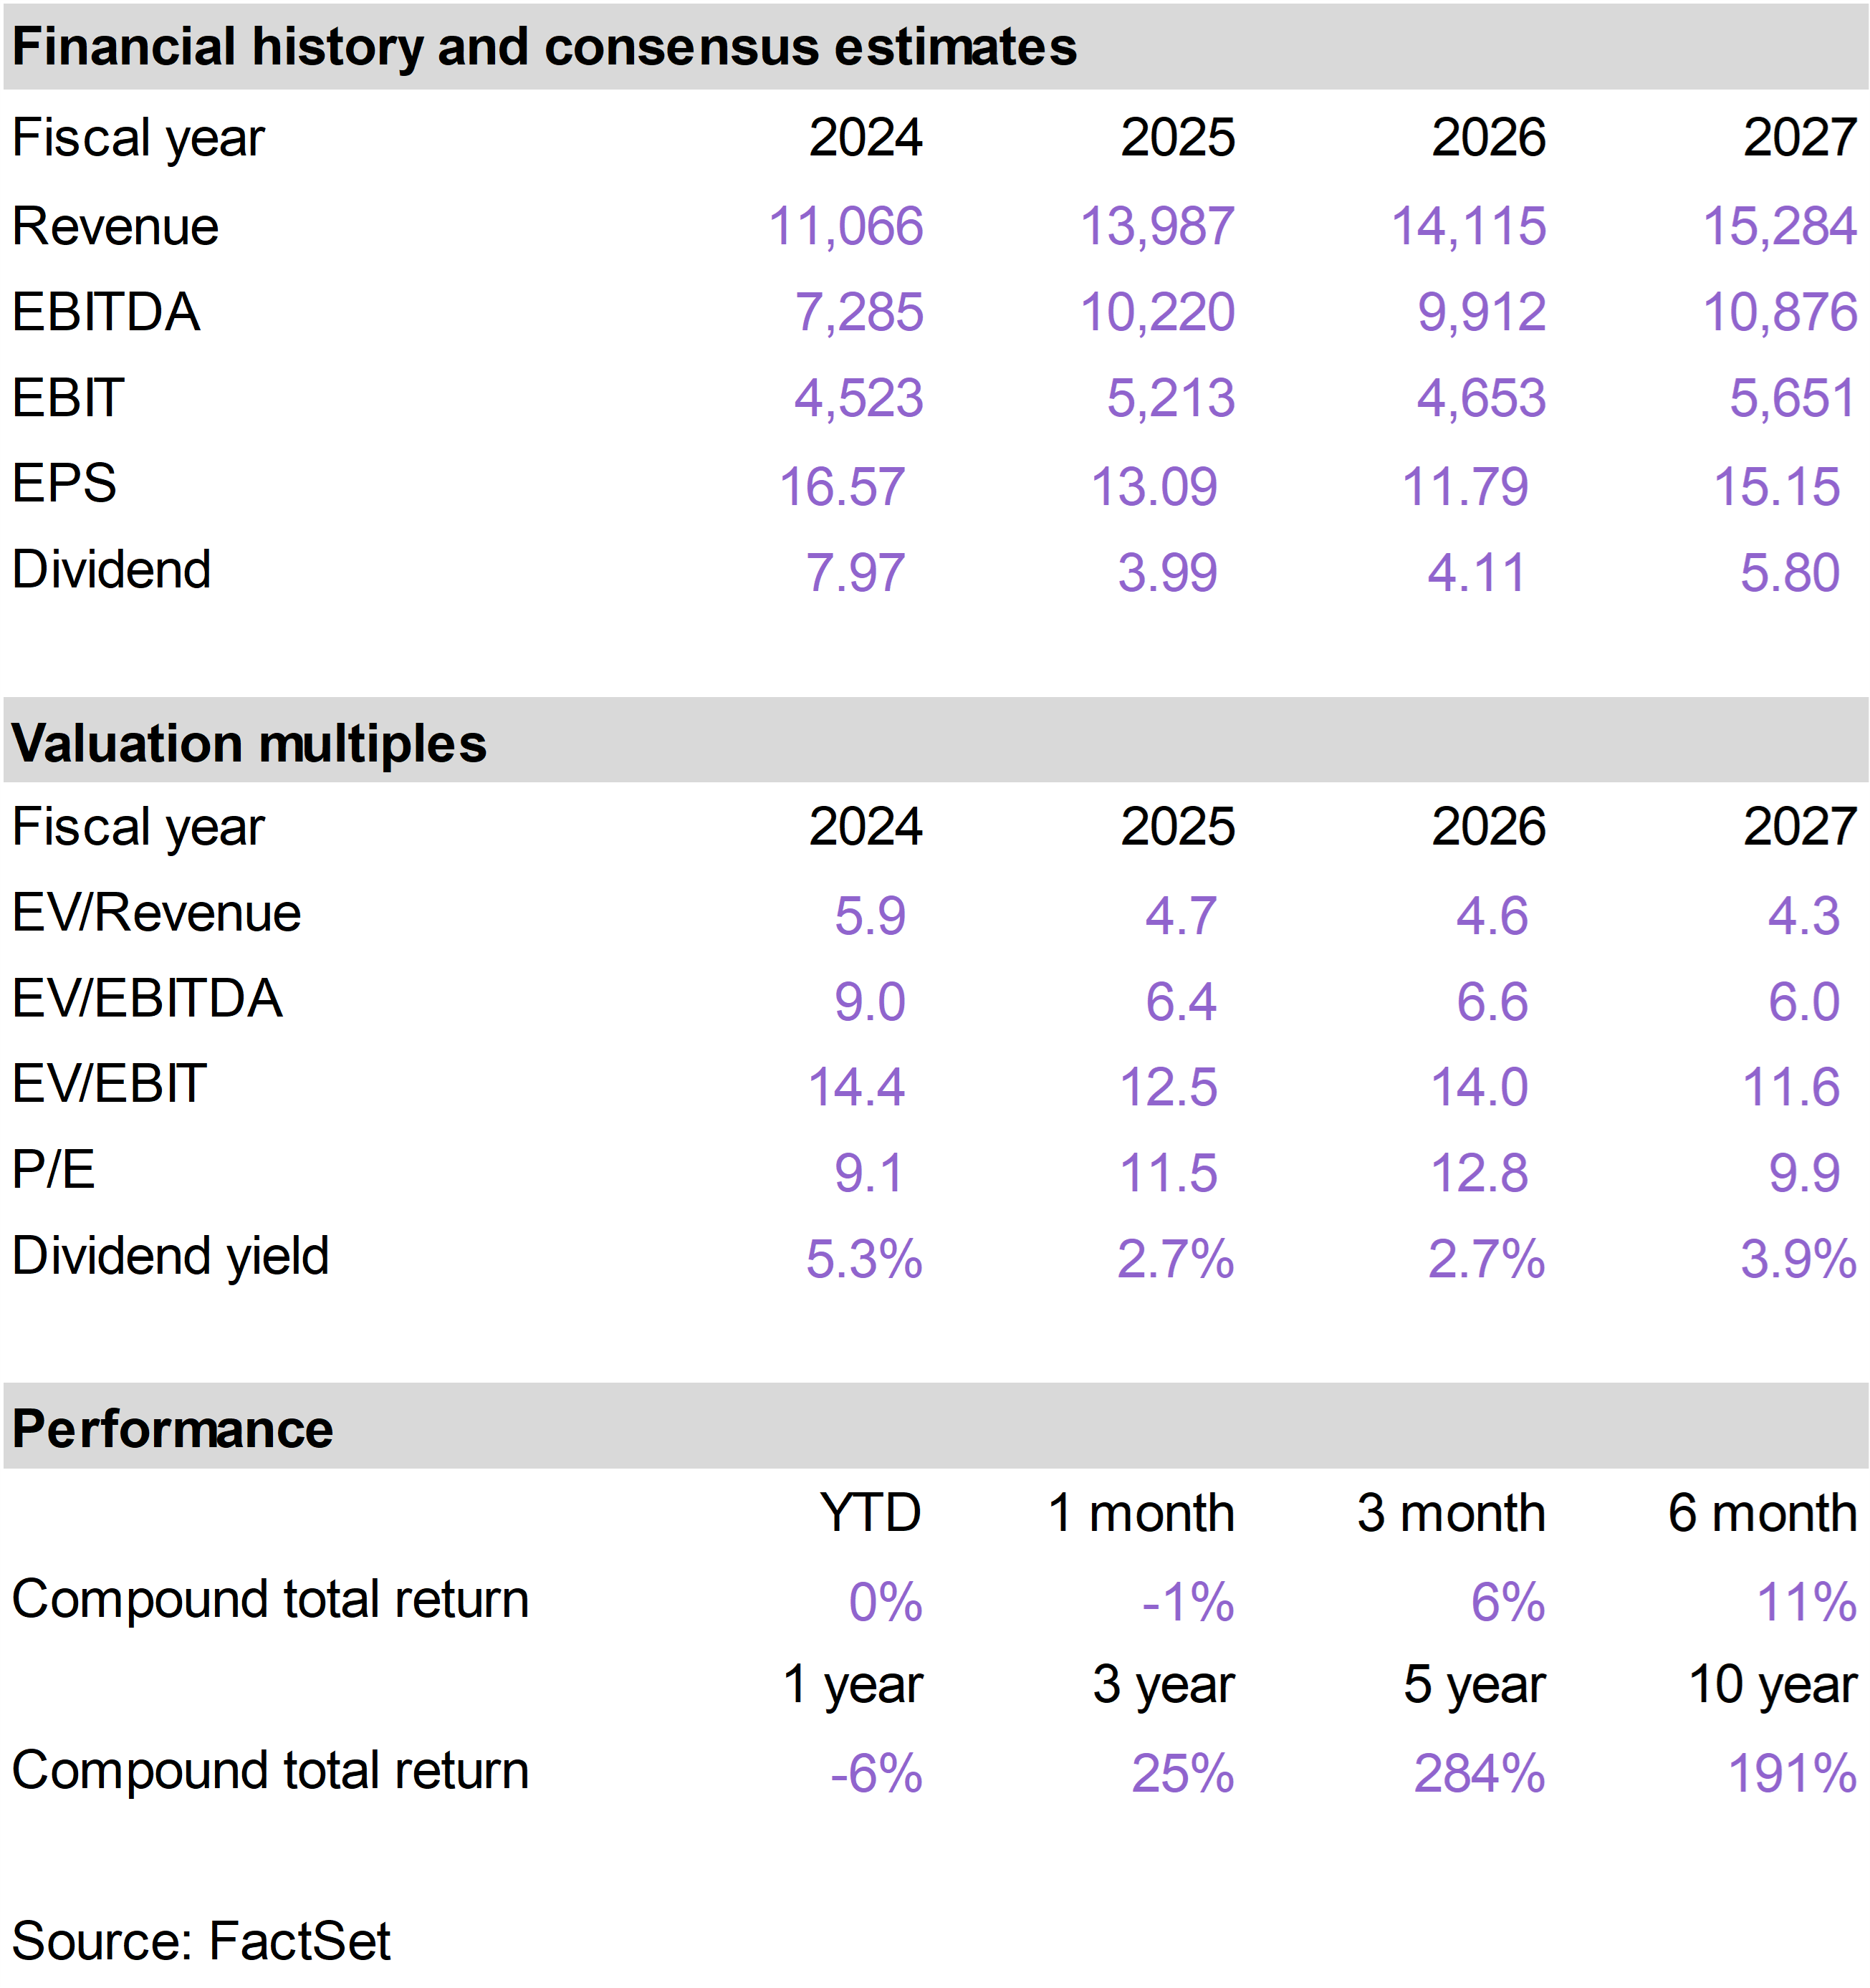
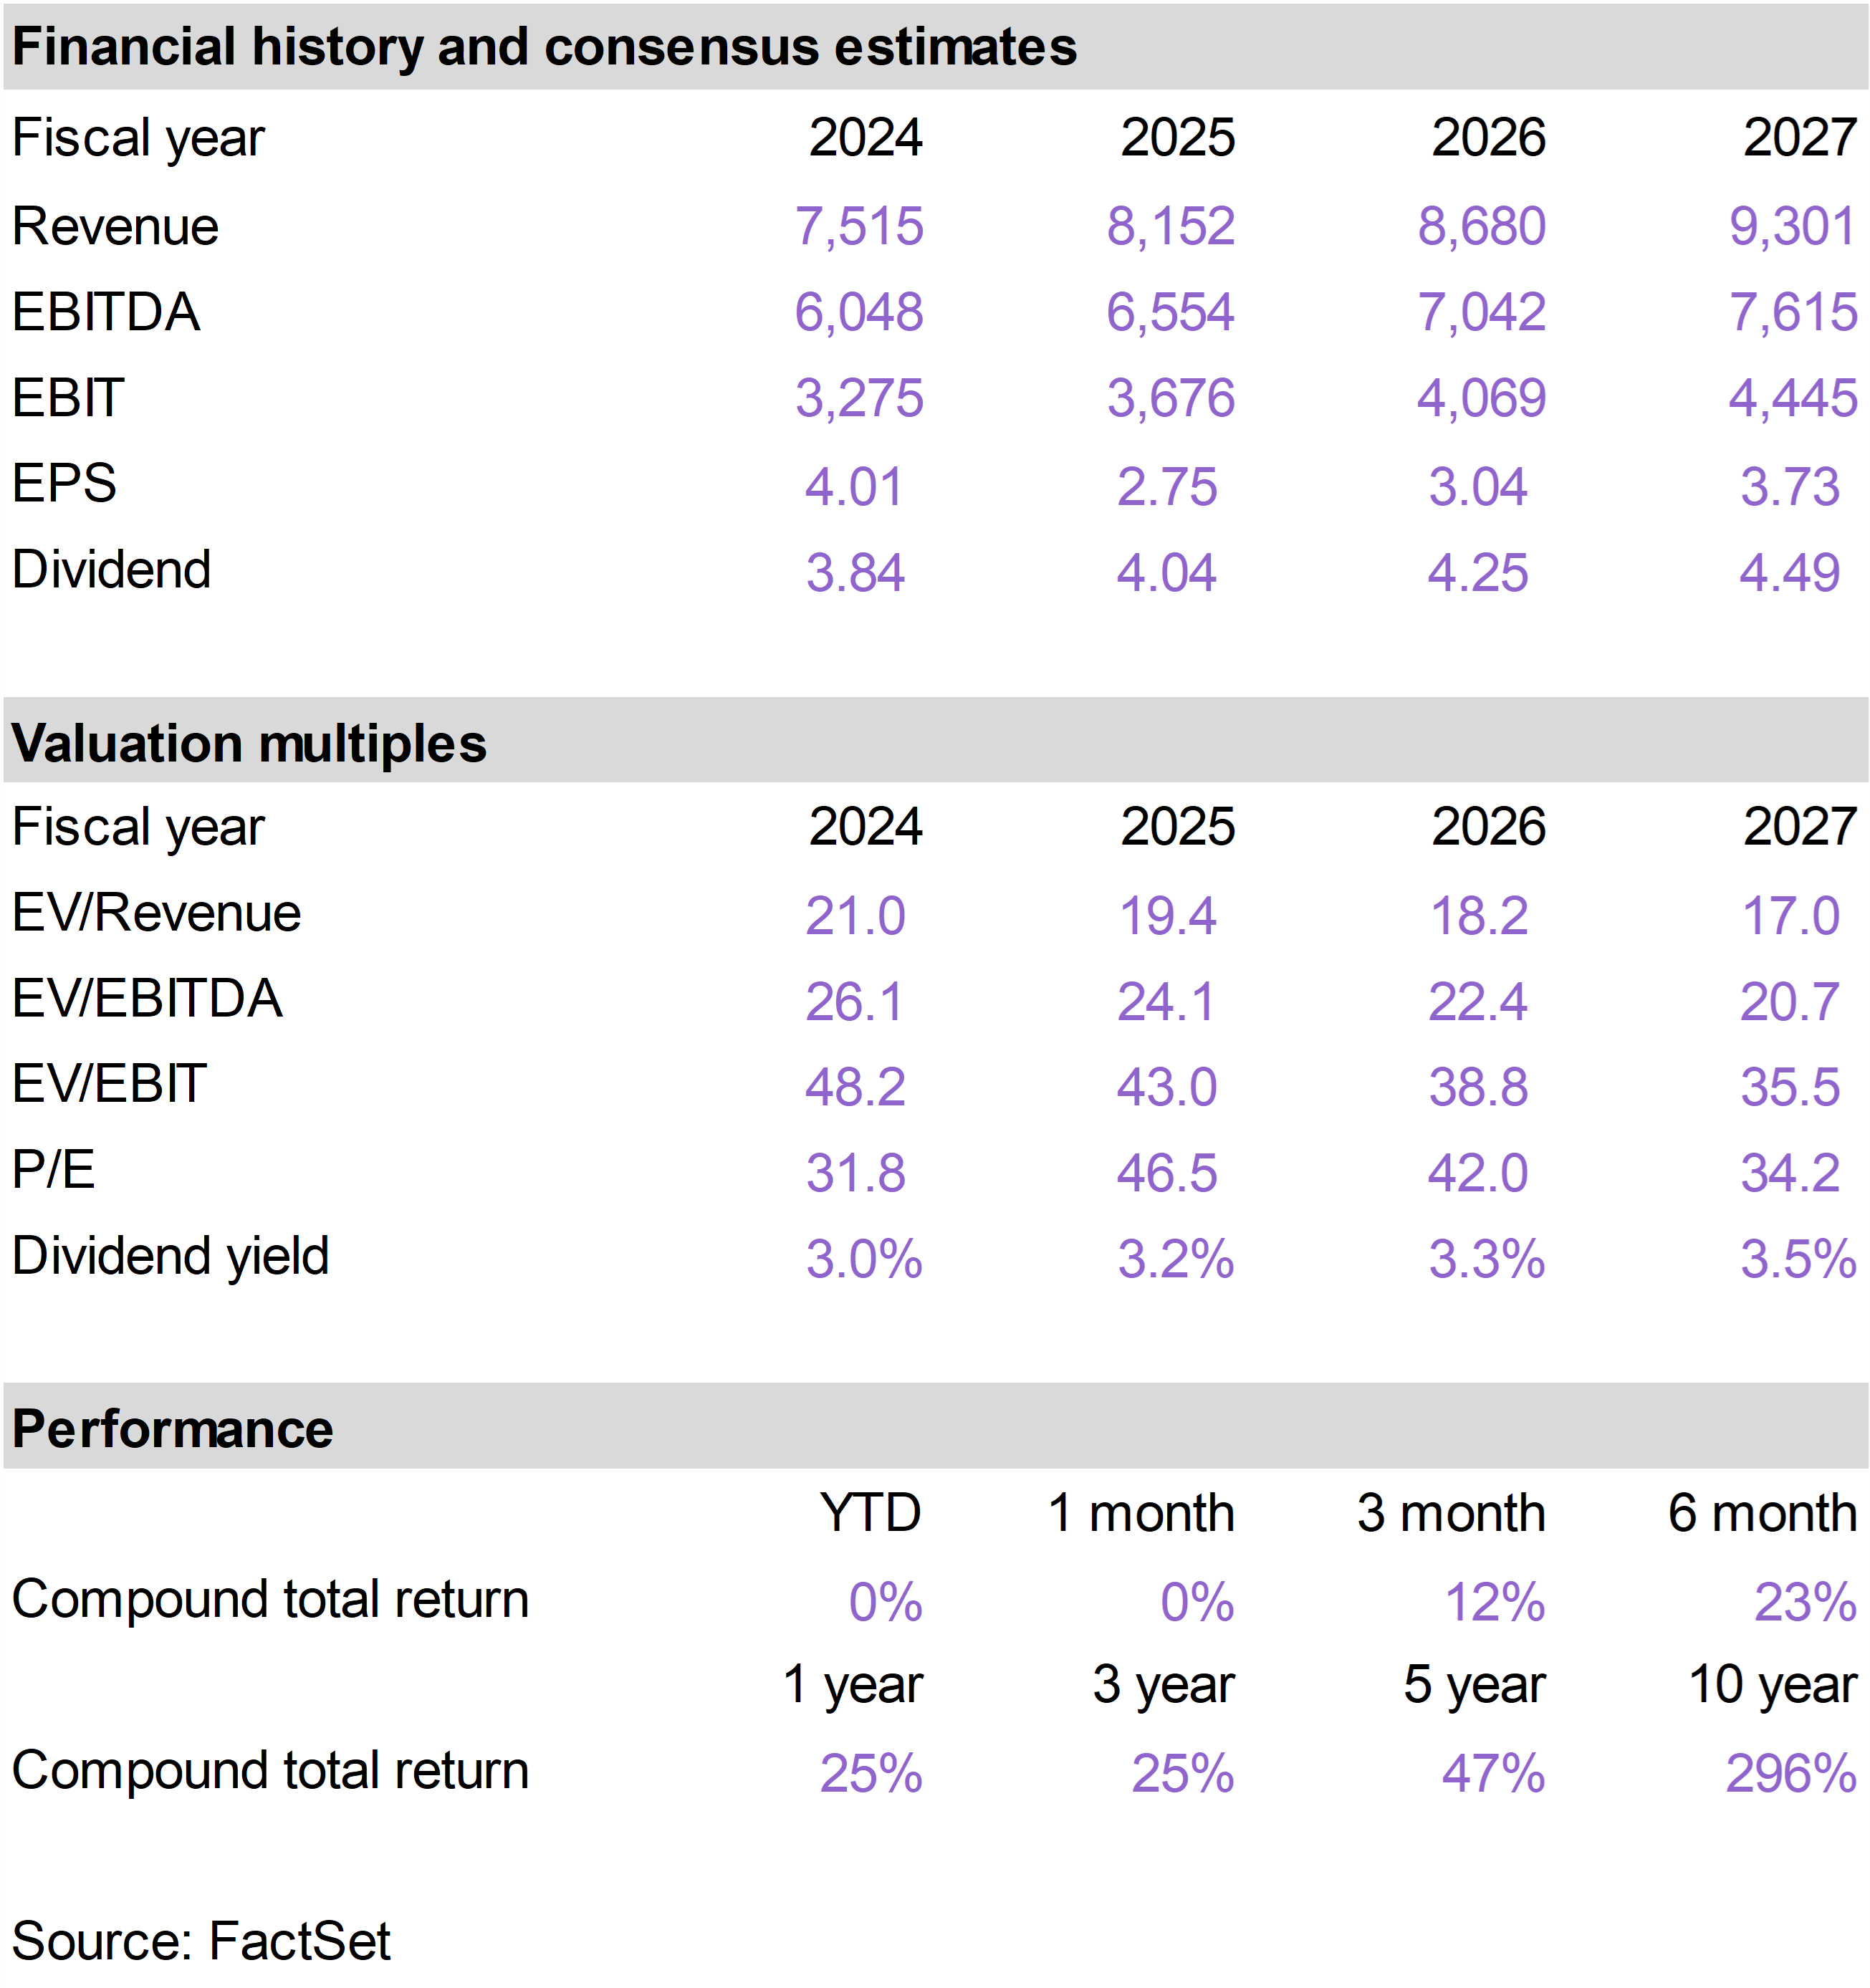
| | Diamondback Energy (FANG) |
|
|
|
| | |
|
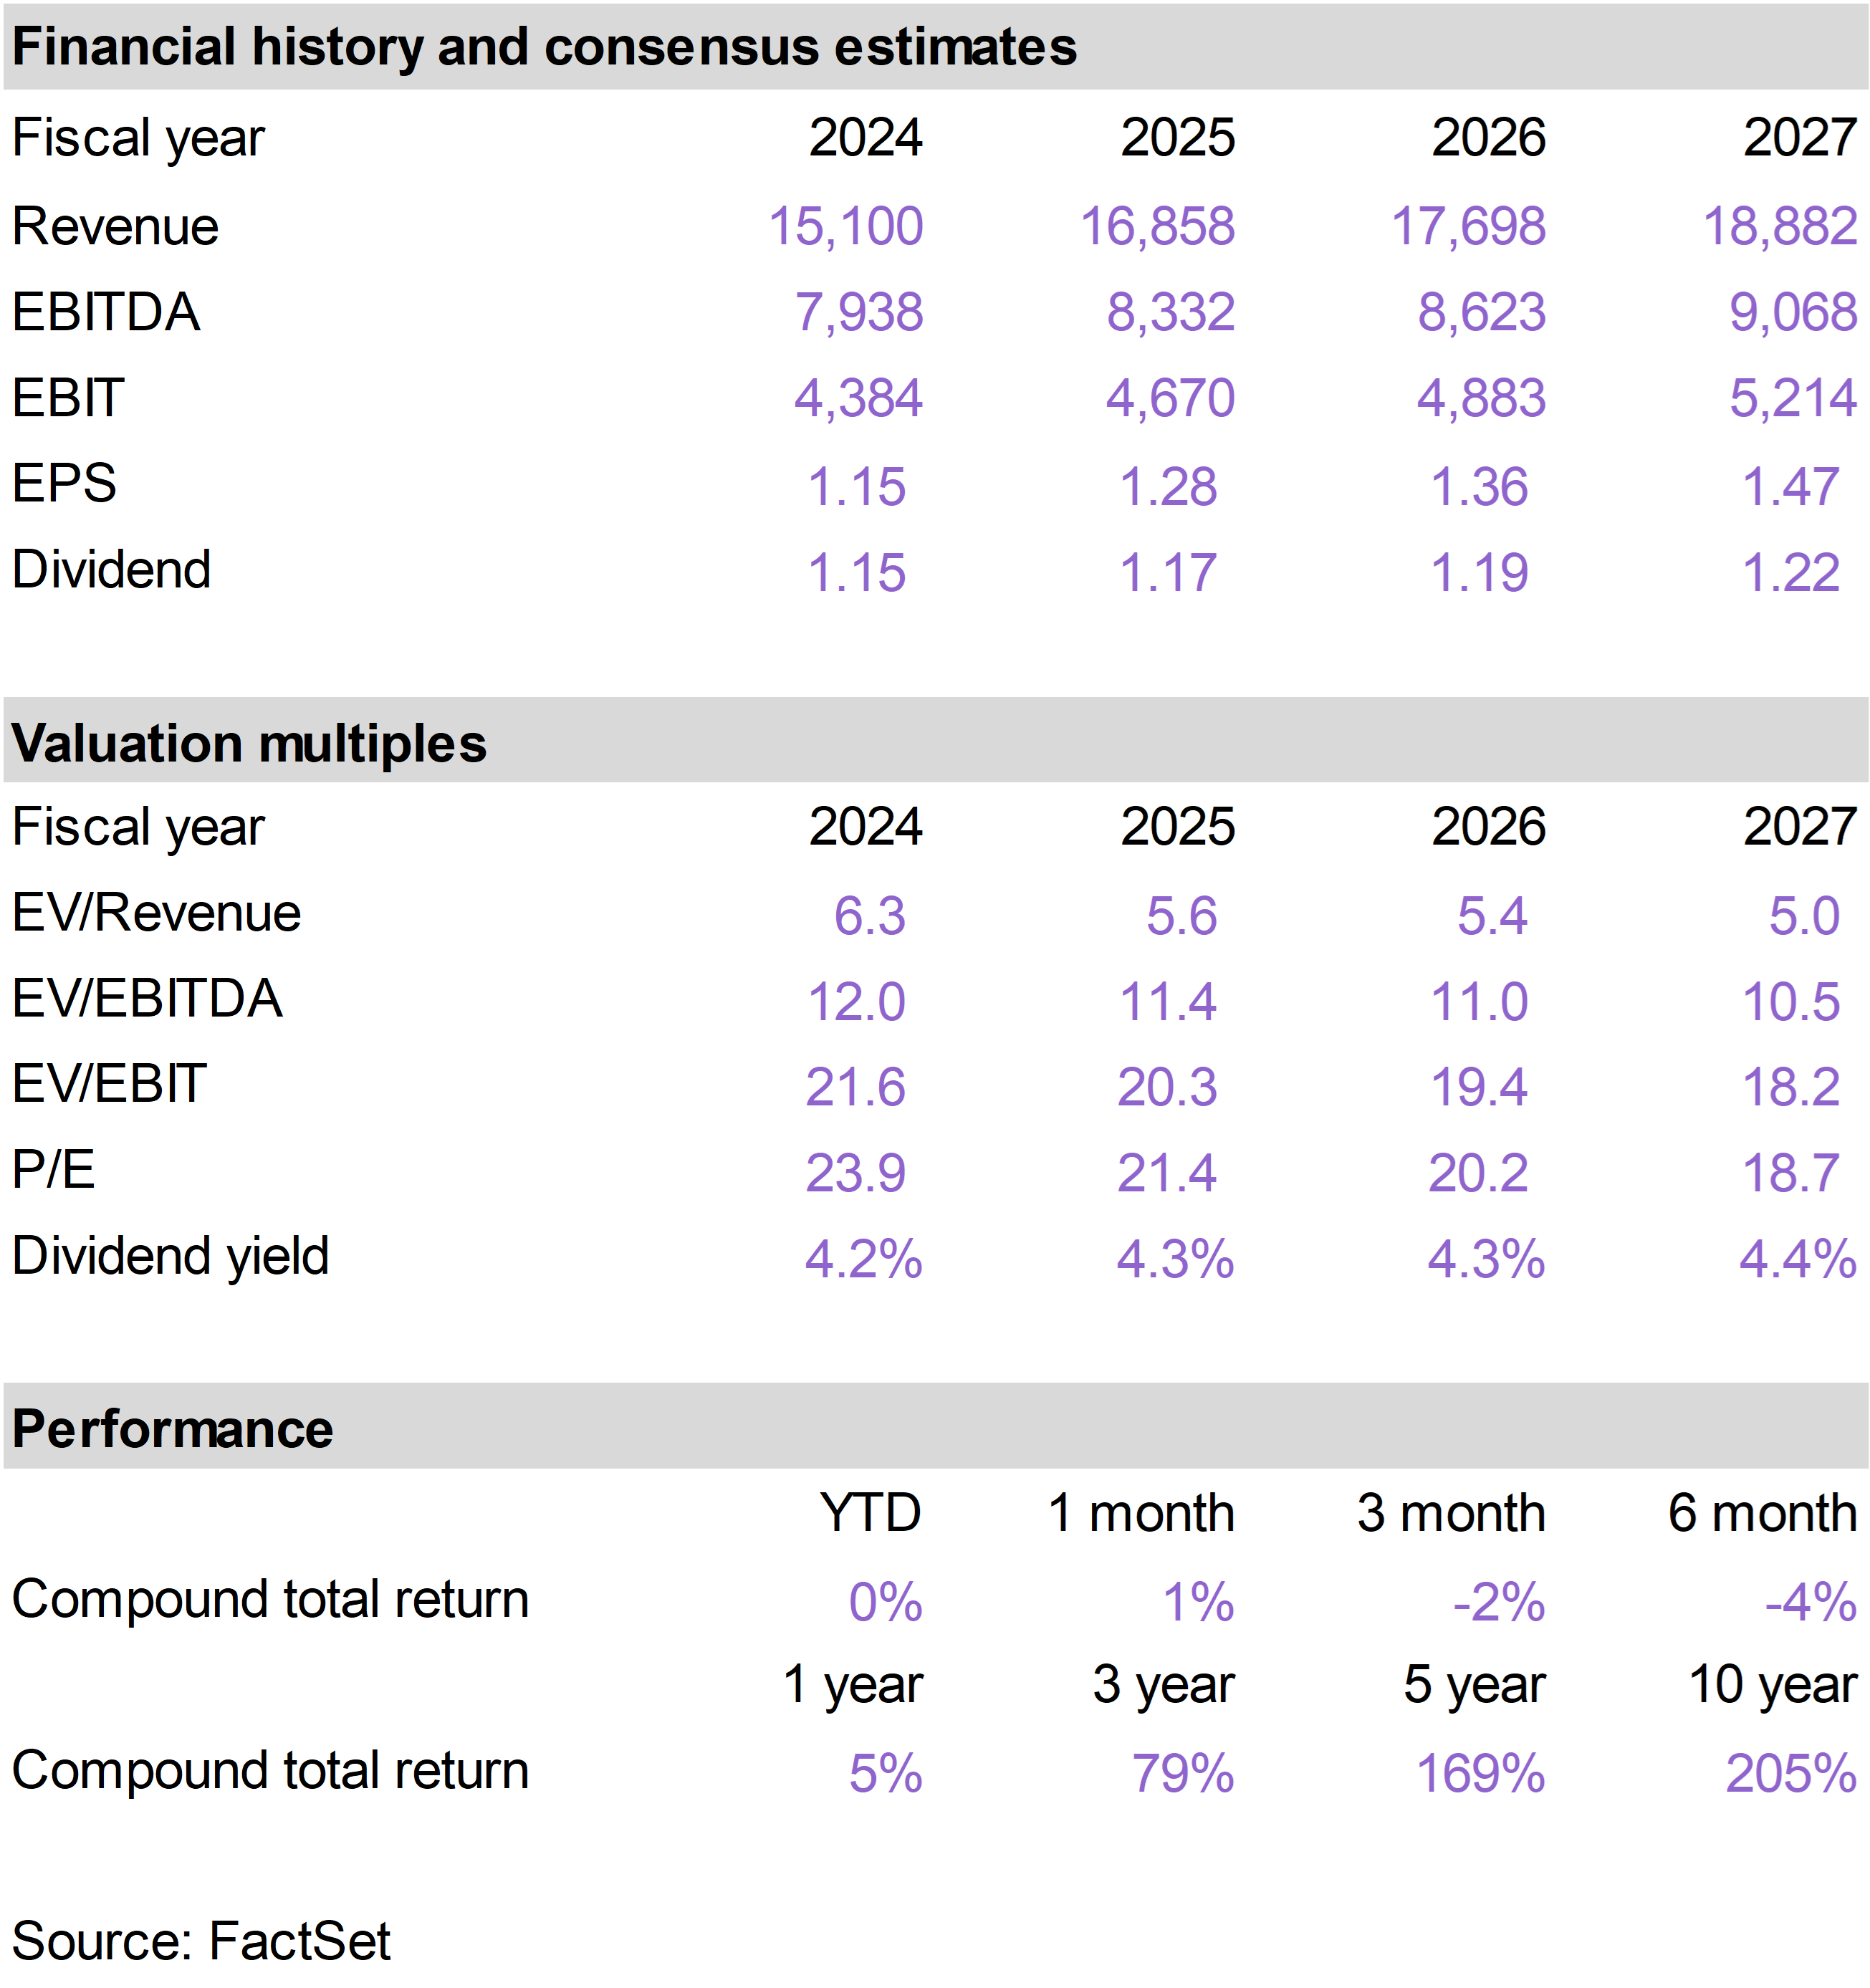
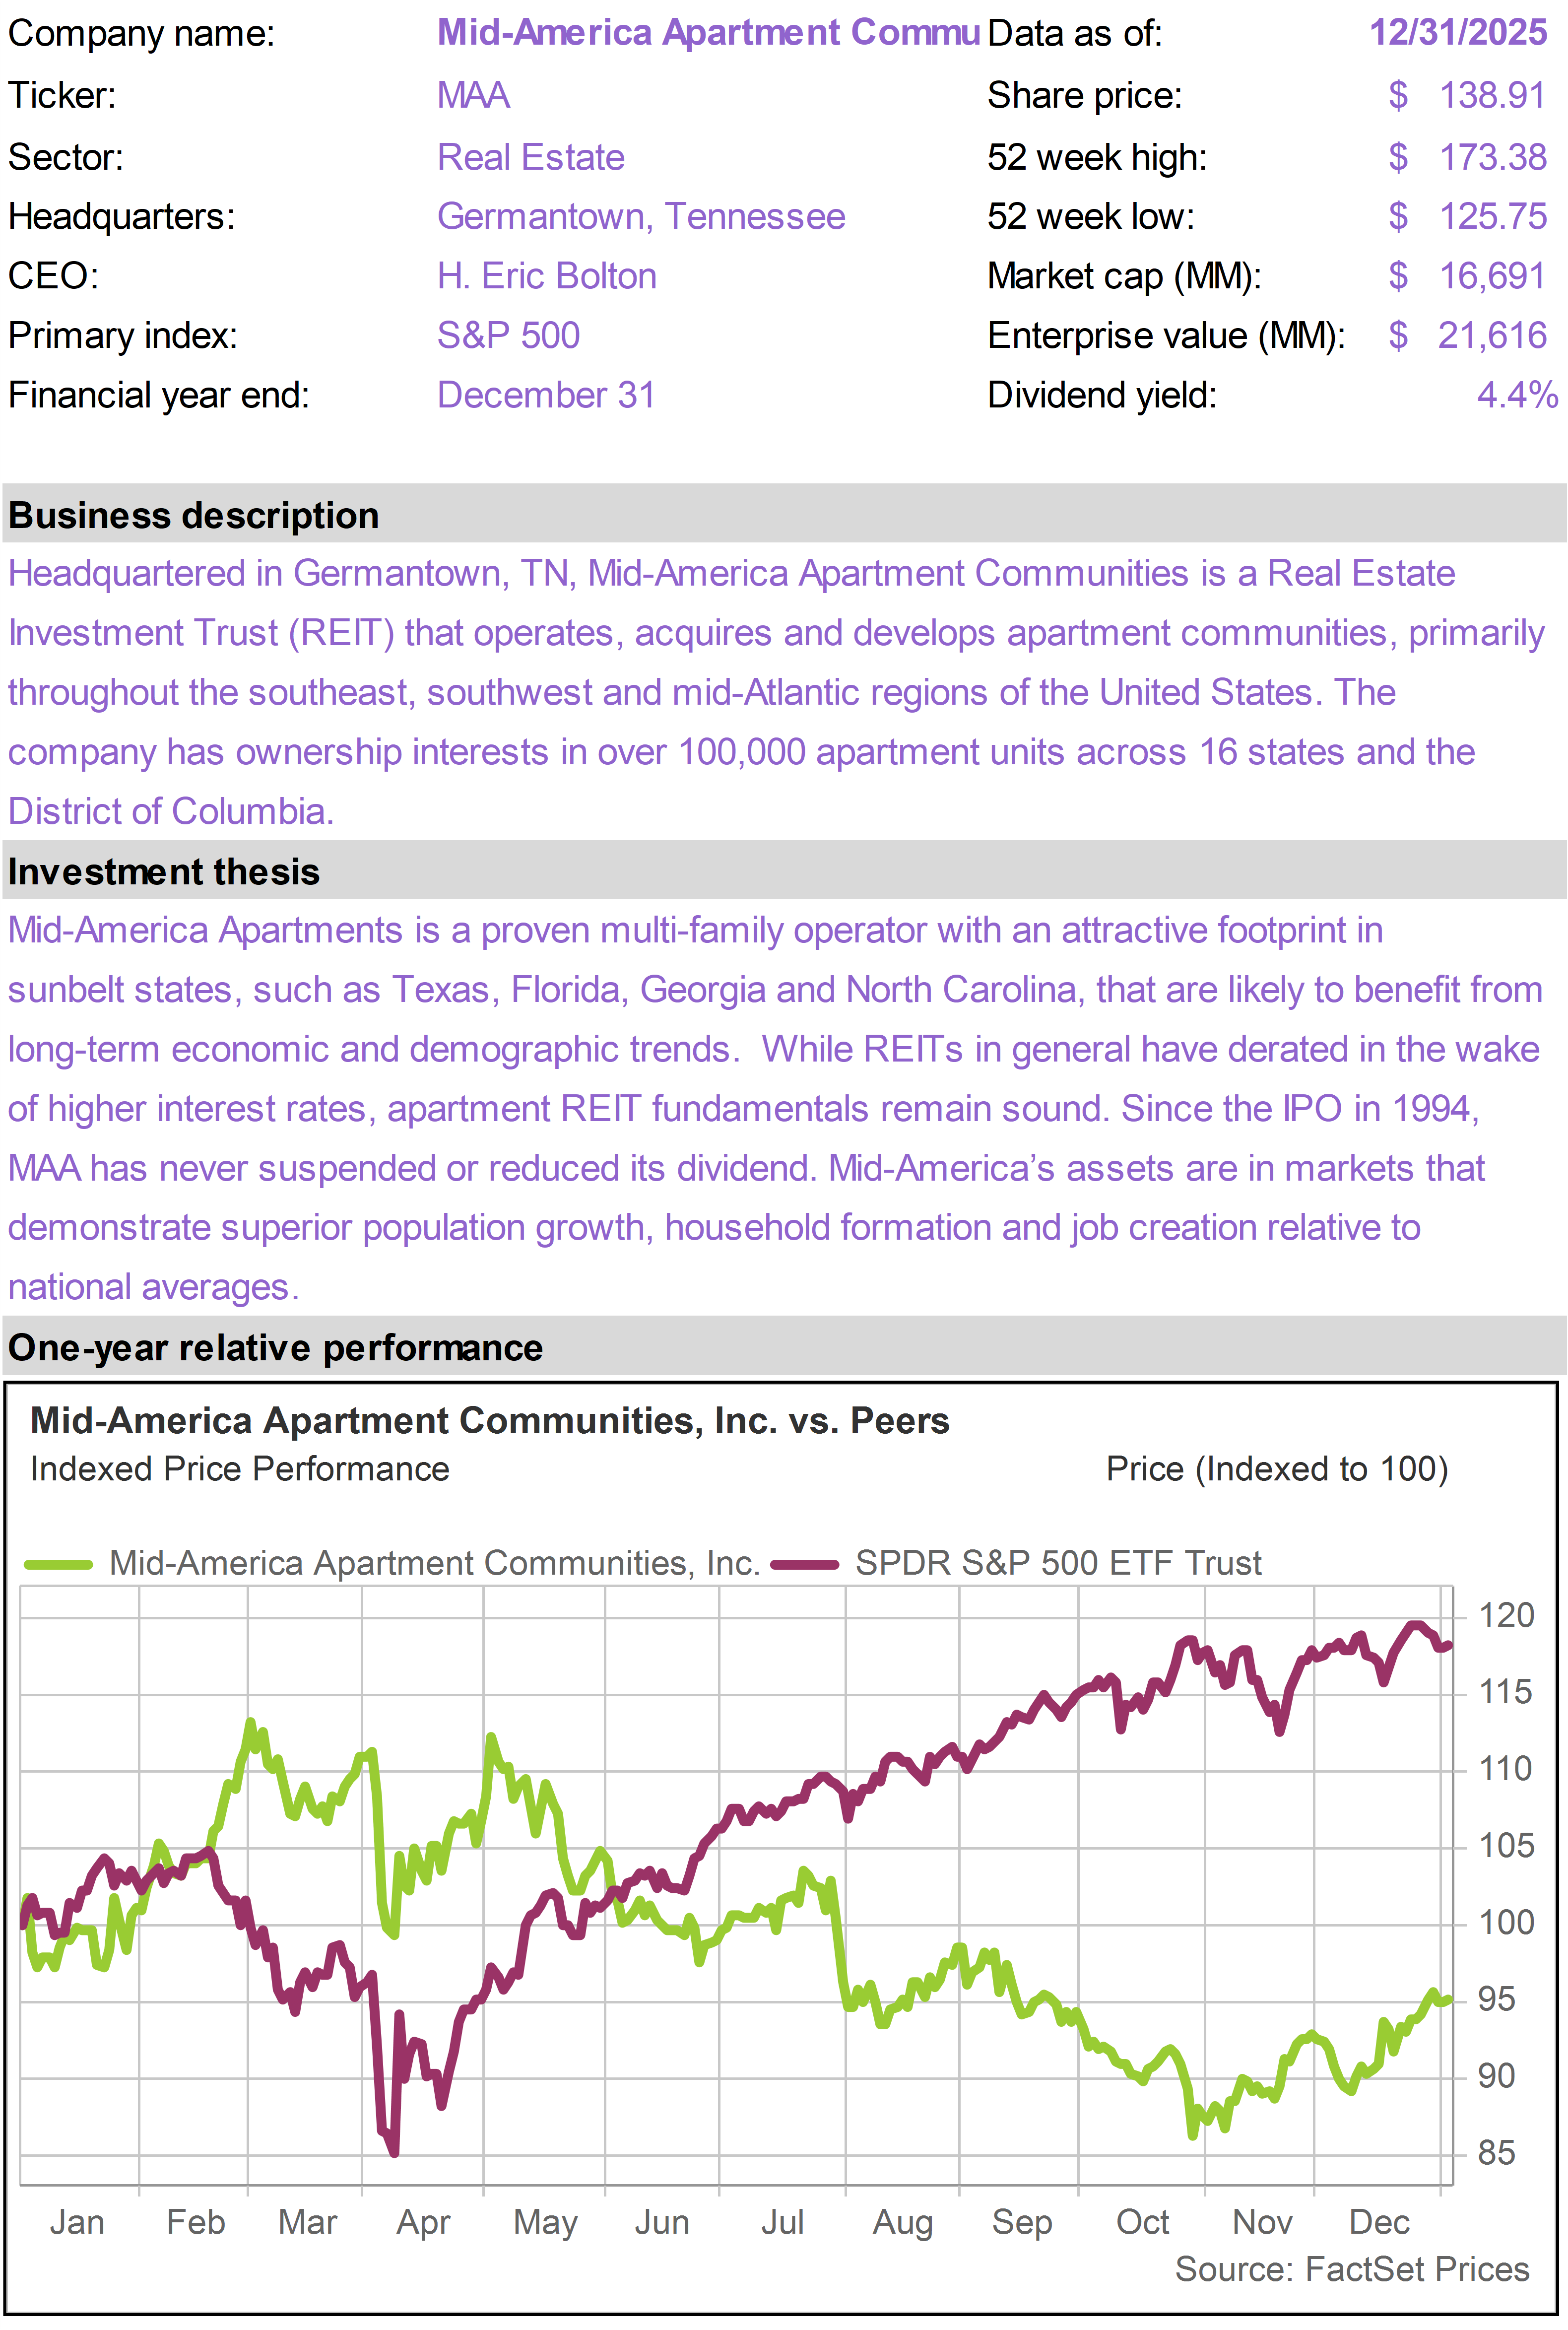
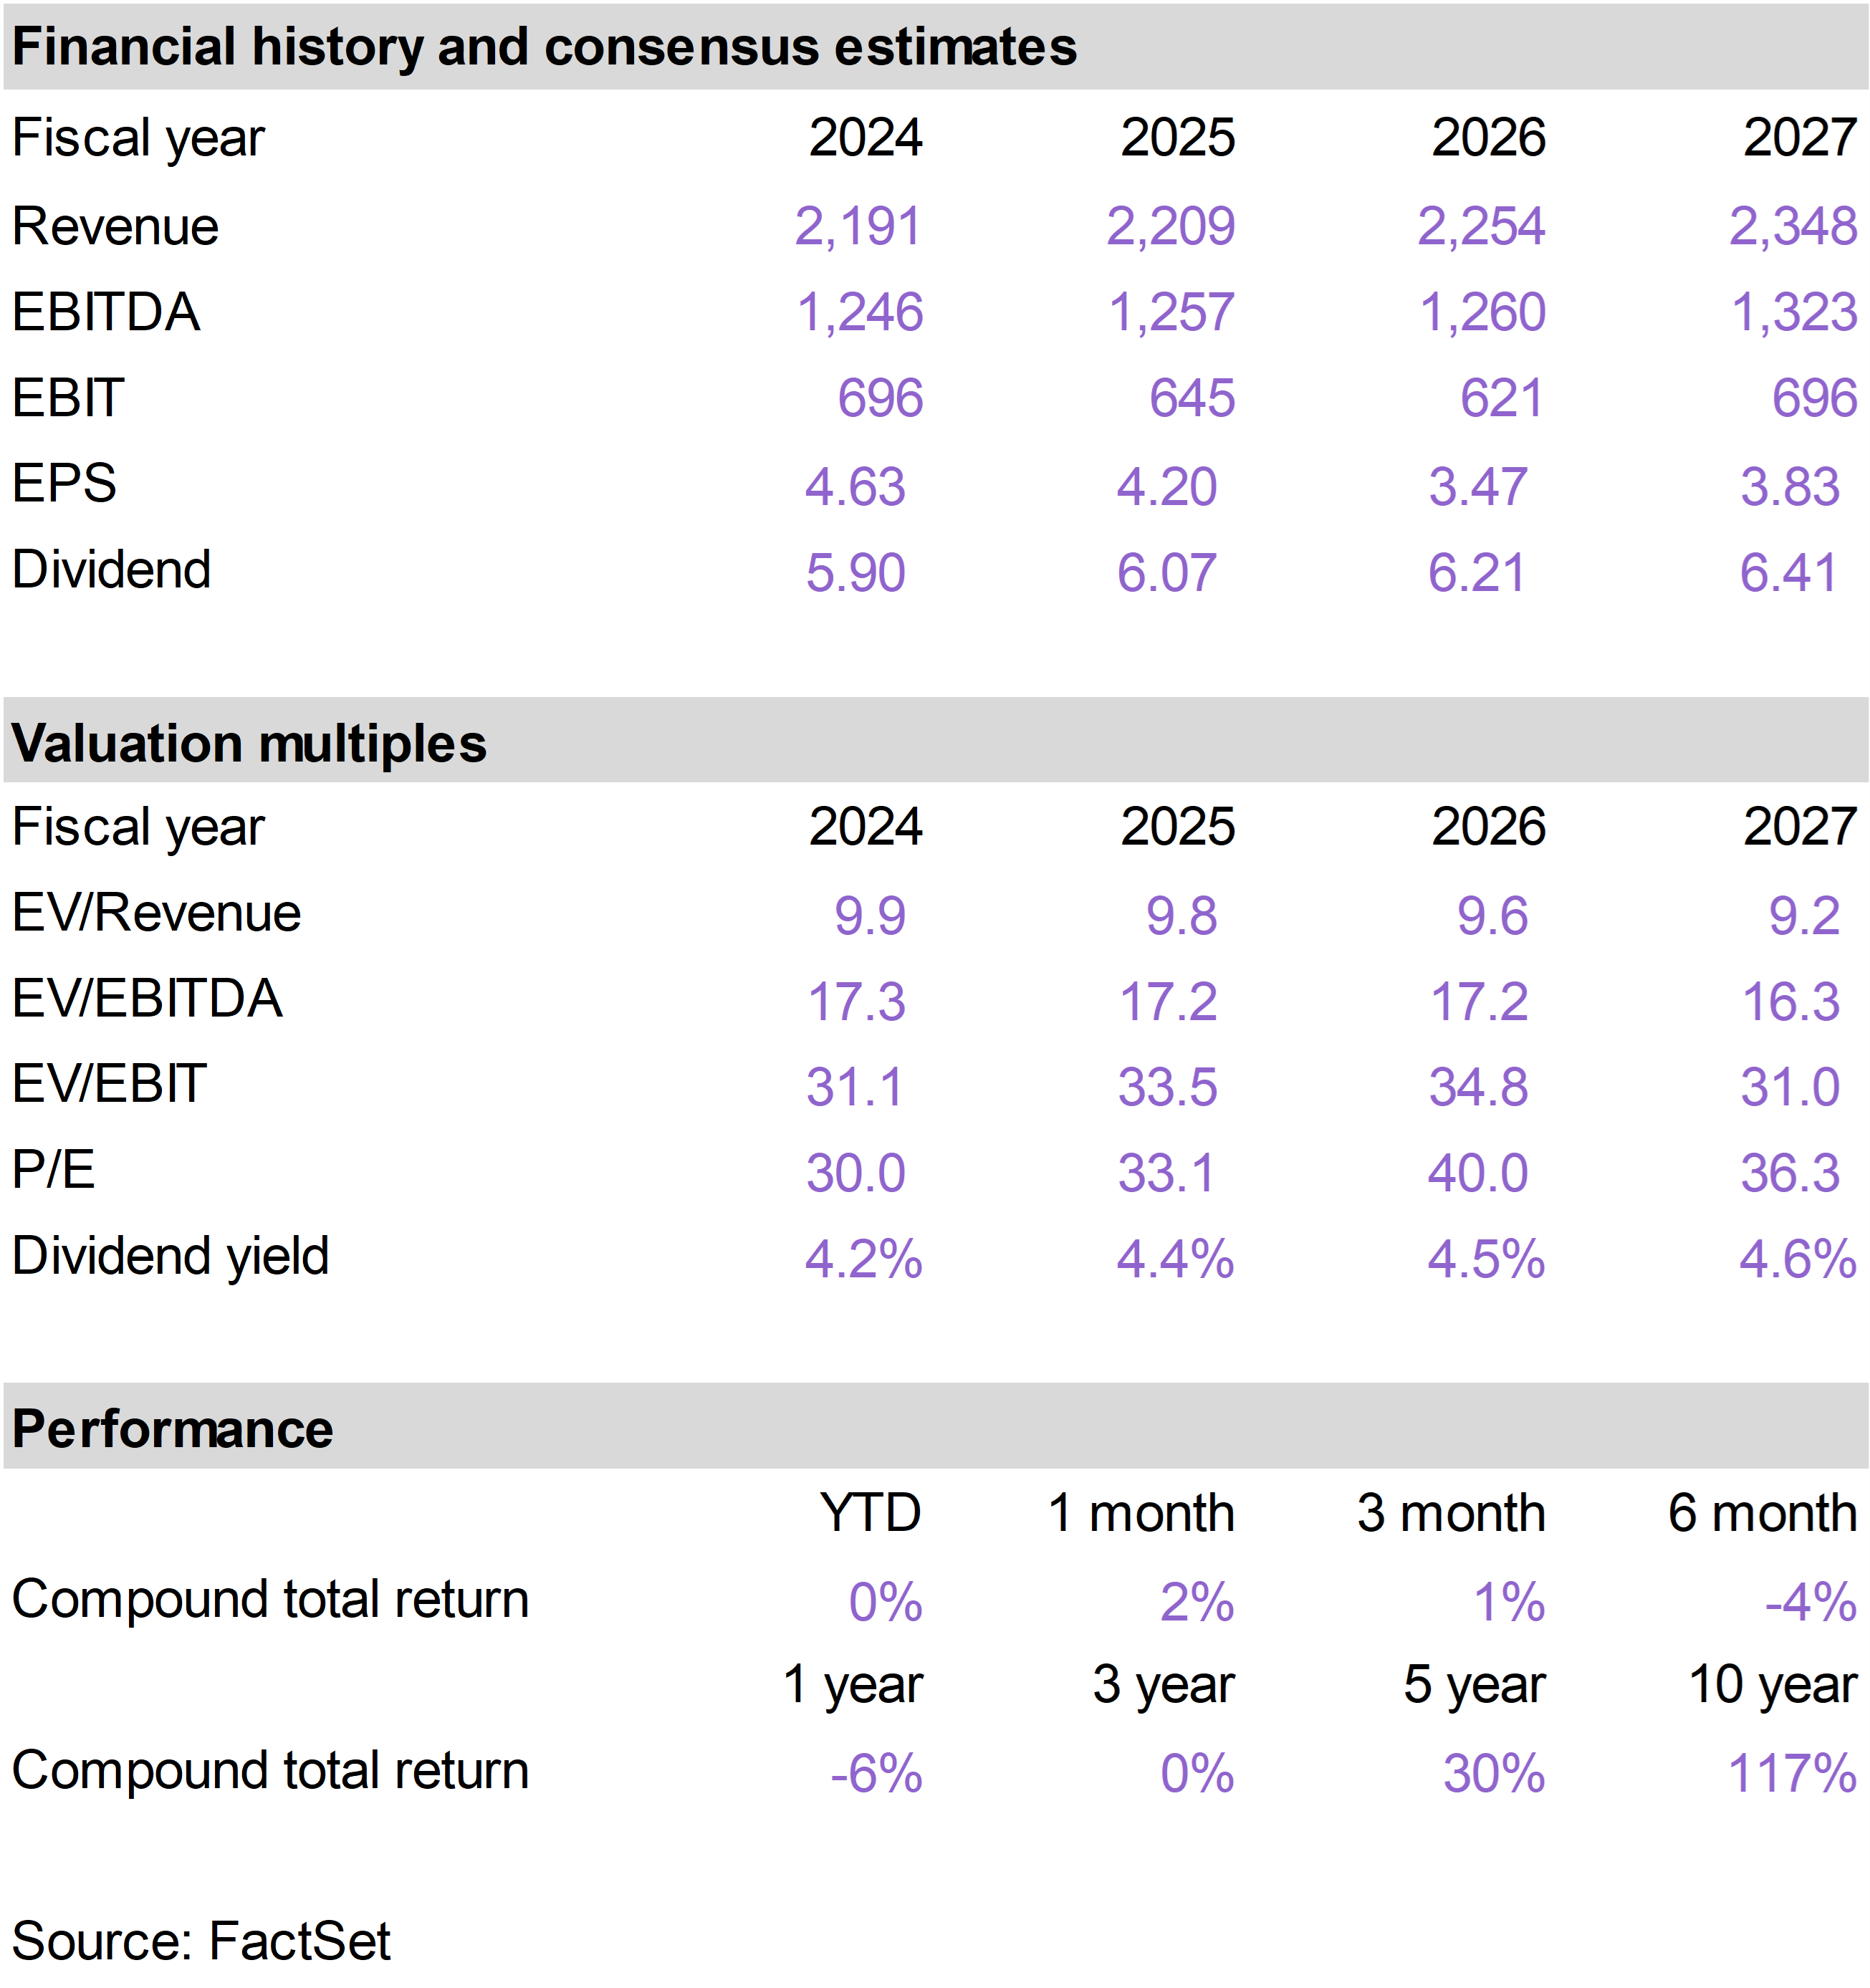
| | Mid-America Apartment (MAA) |
|
|
|
| | |
|
| | |
|
| | |
|
| | Strategy 8% Perpetual Pref (STRK) |
|
|
|
| | |
|
| | The 76research Income Builder Model Portfolio is intended for income-oriented investors and managed to generate an overall yield that is materially higher than broad equity indices. The portfolio includes stocks with above average dividend yields from a cross section of industries. While investments are screened for their income and income growth characteristics, specific holdings are chosen based on valuation and general business quality, growth and risk considerations. |
|
| | FOR SUBSCRIBER USE ONLY. DO NOT FORWARD OR SHARE. |
|
| | | |
|
|
|
|
| |
|