| Inflation Protection Model Portfolio |
|
| Monthly Portfolio Review: February 2026Publication date: March 2, 2026 |
|
| | | Current portfolio holdings |
|
|
| | FOR SUBSCRIBER USE ONLY. DO NOT FORWARD OR SHARE. |
|
| | | February was generally a difficult month for technology stocks but a good one for businesses connected to hard assets, energy, and physical infrastructure. Against this backdrop, the Inflation Protection portfolio delivered a strong result, generating a total return of 8.2% for the month, versus -0.8% for the S&P 500. On a year to date basis, the portfolio has returned 17.4%, versus 0.7% for the S&P 500. Performance was led by the newest position in the portfolio, Circle Internet Group (CRCL), which advanced 40% since its addition to the portfolio on February 10, 2026. CRCL benefited from a very well-received fourth quarter earnings report, which restored confidence in the business case. The portfolio’s gold streaming stocks also generated strong returns as gold advanced in February closer toward its late-January all-time high. TransDigm (TDG) was the only stock in the portfolio that generated a negative return. We are closely monitoring the U.S. military intervention in Iran, which, at least initially, is likely to have a beneficial impact on energy stocks and gold.
|
|
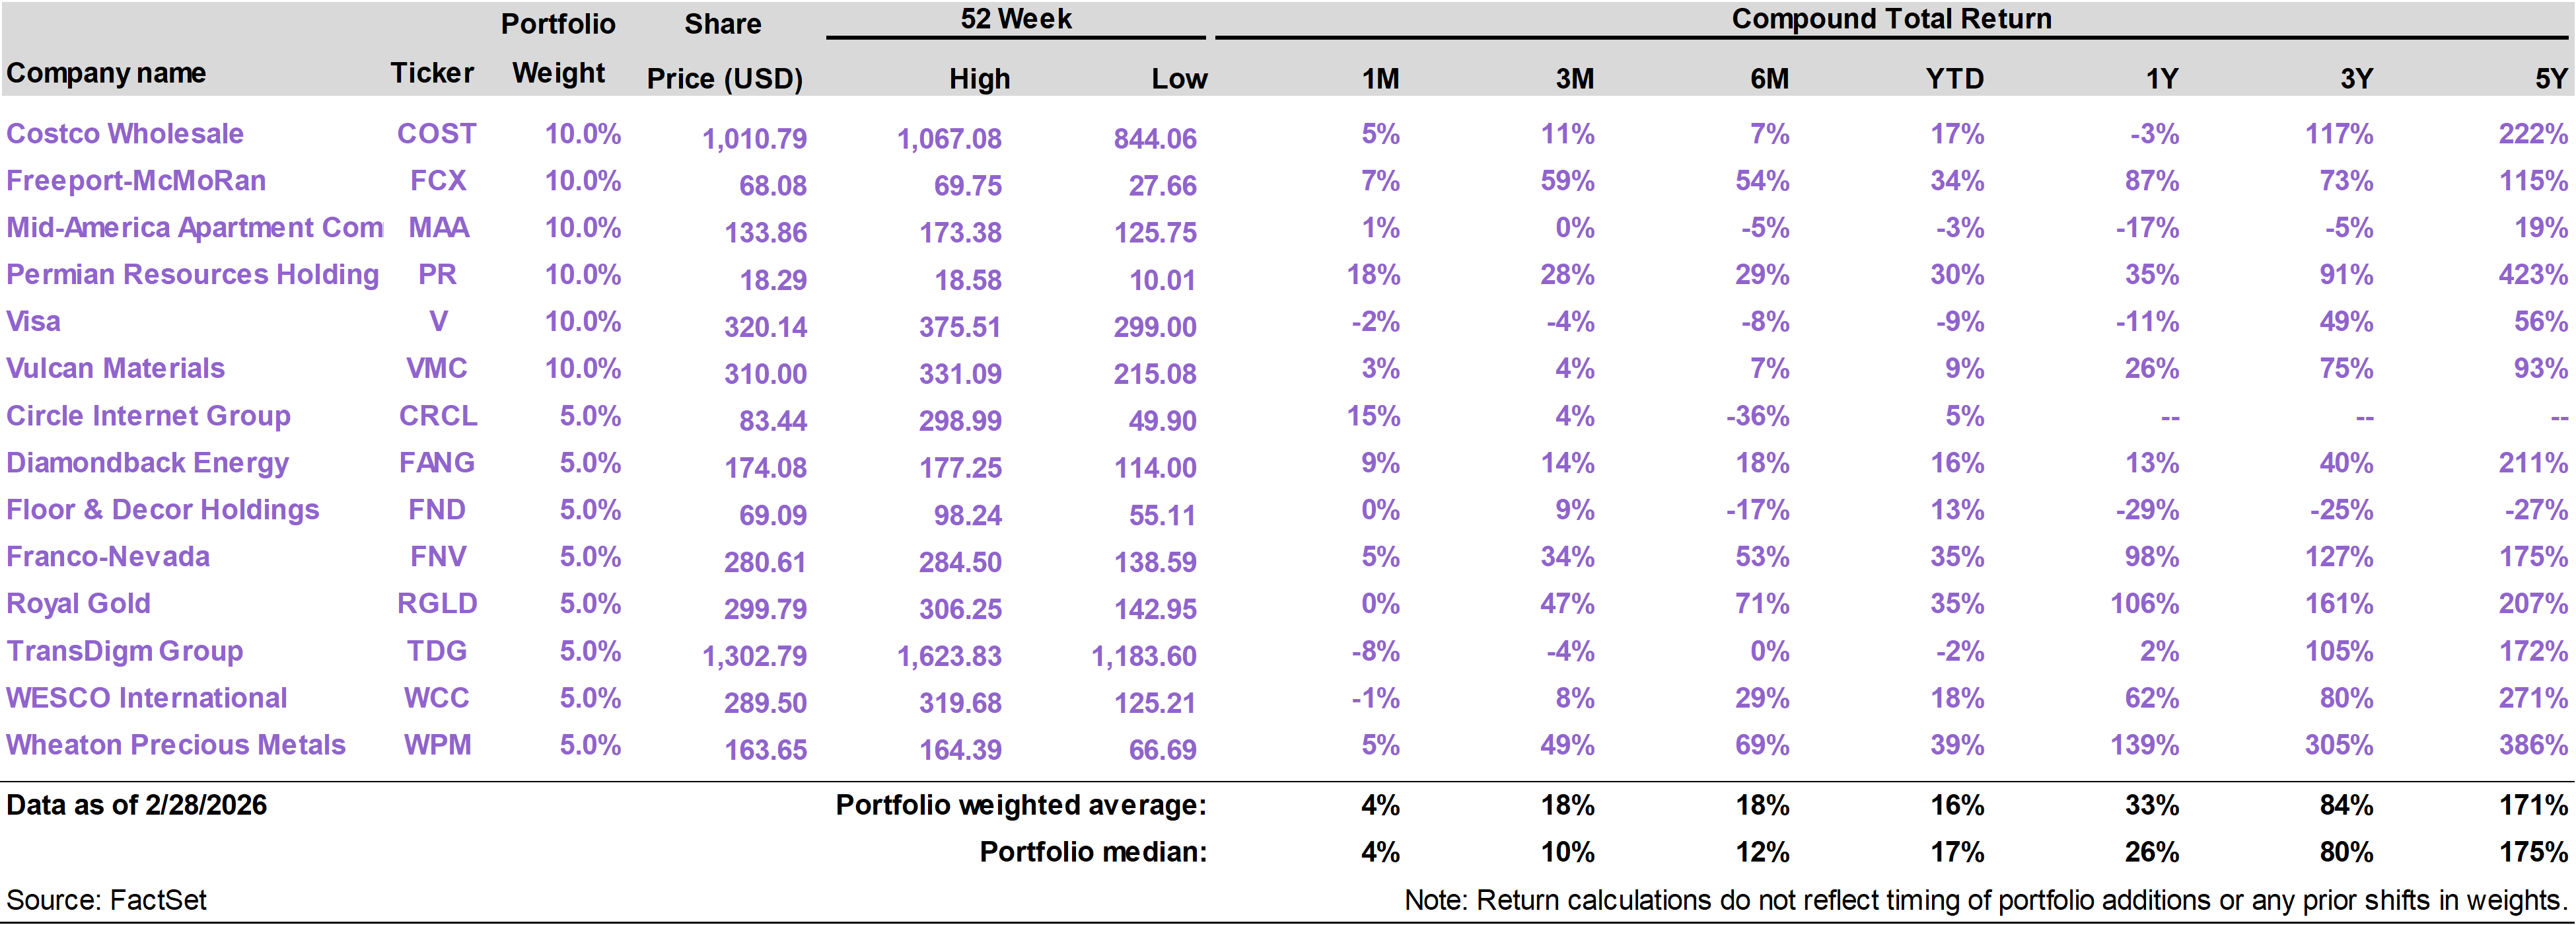
| | | The Inflation Protection portfolio returned 8.2% in February, substantially ahead of the S&P 500 Index return of -0.8%. On a year to date basis through the end of the month, the portfolio has generated a total return of 17.4%, versus a 0.7% return for the S&P 500.
The portfolio’s top performing stocks this month were Circle Internet Group (CRCL), which returned 40% (since its addition to the portfolio on 2/10/2026); Wheaton Precious Metals (WPM), which returned 24%; and Franco-Nevada (FNV), which returned 20%.
One stock in the portfolio generated a negative return. TransDigm (TDG) declined 9%. |
|
|
AI upheaval
The most notable market development in February revolved around uncertainty about how AI will reshape industries as well as the broader economy.
For much of last year, AI-related anxieties focused on whether the technology sector was overbuilding data center capacity. Investors also worried that more efficient, decentralized AI models—exemplified by China’s DeepSeek—could compress margins for AI hardware and equipment suppliers, such as NVIDIA (NVDA).
In February, however, the concern evolved. The question is no longer whether the AI opportunity is overstated. Instead, investors are beginning to grapple with how powerful AI may be—and what that power means for existing business models.
As we noted in the 76report in early February (Software as a Sell-Off), fears that next-generation AI platforms could undermine established software vendors have gained momentum. That narrative accelerated through January and carried into February.
The core concern is straightforward: advanced AI platforms—such as Anthropic’s Claude—may reduce the need for complex, high-cost enterprise software systems. Generative AI can increasingly write customized code at minimal incremental cost and perform functions for which businesses currently pay substantial subscription fees.
Whether this disruption unfolds gradually or rapidly remains an open question. But markets have begun to price the risk aggressively.
The divergence is visible in the iShares Expanded Tech-Software Sector ETF (IGV), which holds many large-cap software and services names now viewed as most exposed to AI disintermediation. IGV declined another 10% in February after falling 15% in January, a sharp underperformance relative to broader technology indices. |
|
|
|
Software ETF (IGV) vs. NASDAQ Composite(Total Return - Last 6 Months) |
|
|
AI deflation risk?
Anxiety around AI broadened beyond the software sector in late February after Citrini Research published a widely circulated memo titled “The 2028 Global Intelligence Crisis.”
Written as a hypothetical dispatch from June 2028, the report outlined a deflationary cascade in which rapid AI adoption triggered mass white-collar layoffs, pushed unemployment above 10%, and drove the S&P 500 38% below its October 2026 peak. The memo went viral almost immediately, reportedly attracting more than 22 million views on X.
The so-called AI “scare trade” erupted on Monday, February 23, weighing heavily on software, payments, and delivery shares. Even long-established enterprise players like IBM (IBM) experienced extreme volatility, with IBM suffering its worst single-day decline in 25 years, falling 13% in one session.
The Citrini framework was provocative because it flipped a widely held assumption.
For the past two years, investors have viewed AI-driven productivity gains as unambiguously positive—disinflationary, margin-expanding, and supportive of higher equity multiples. The memo instead framed productivity as destabilizing: too much efficiency, too quickly, leading to demand destruction and systemic stress.
We intend to explore these themes in greater depth in an upcoming 76report. While we acknowledge that AI will be disruptive—and in some cases painful—our base case remains that broad-based efficiency gains ultimately support real growth and create room for easier monetary policy, as opposed to sustained deflationary collapse.
Sector rotation
With AI platforms like Claude and ChatGPT dropping impressive new capabilities seemingly every week, investors are desperately trying to sort out winners from losers. In February, fears around AI helped drive a rotation from technology shares altogether.
We noted last month that the S&P 500 Equal Weight Index substantially outperformed the market-cap weighted index in January, returning 3.3% versus 1.5%. Similarly, S&P Value outperformed S&P Growth, returning 2.4% versus 0.5%.
This pattern of sector rotation away from large-cap tech only intensified in February. The S&P 500 Equal Weight Index again outperformed the market-cap weighted index, returning 3.6% versus -0.8%. S&P Value again outperformed S&P Growth, returning 2.3% versus -3.4%. |
|
|
|
S&P 500 vs. Equal Weight, Value, Growth(Total Return - February 2026) |
|
|
For much of the past two years, enthusiasm around AI has led investors into technology shares. Now the opposite is happening.
Investors are worried that AI will hurt profitability within the sector, and they are looking elsewhere, especially at business models anchored by physical assets that cannot be cheaply replicated by the likes of Claude.
Technology was among the worst performing sectors in February, declining 4%. The Financials sector also declined 4%, for related reasons.
Payment processors traded poorly because of perceived AI disruption risk (they were named specifically in the Citrini report). Alternative asset managers and banks were hit by concerns around their exposure to private credit markets, which in turn have high exposure to software companies. |
|
|
|
Utilities and Energy led returns in February, significantly outperforming the broader index. Both sectors advanced 10%.
Utilities, along with other defensive, rate-sensitive sectors like Consumer Staples and Real Estate, were aided by a decline in long-term interest rates. Yields on 10-Year Treasuries dipped below 4% for the first time since October 2025.
The decline in long-term interest rates is notable as they had been creeping up over the course of the prior three months. One reason for the prior rise is that Trump’s nominee for Fed Chair, Kevin Warsh, is an outspoken critic of Quantitative Easing.
Warsh has expressed interest in gradually unwinding the Fed’s balance sheet holdings of long-term bonds, which in principle could lead to upward pressure on long-term yields.
However, with the AI-driven deflation narrative becoming more prominent, yields on 10-Year Treasuries dropped sharply in February, approximately 30 basis points. |
|
|
|
10-Year Treasury Yields—Last 12 Months(Source: FactSet) |
|
|
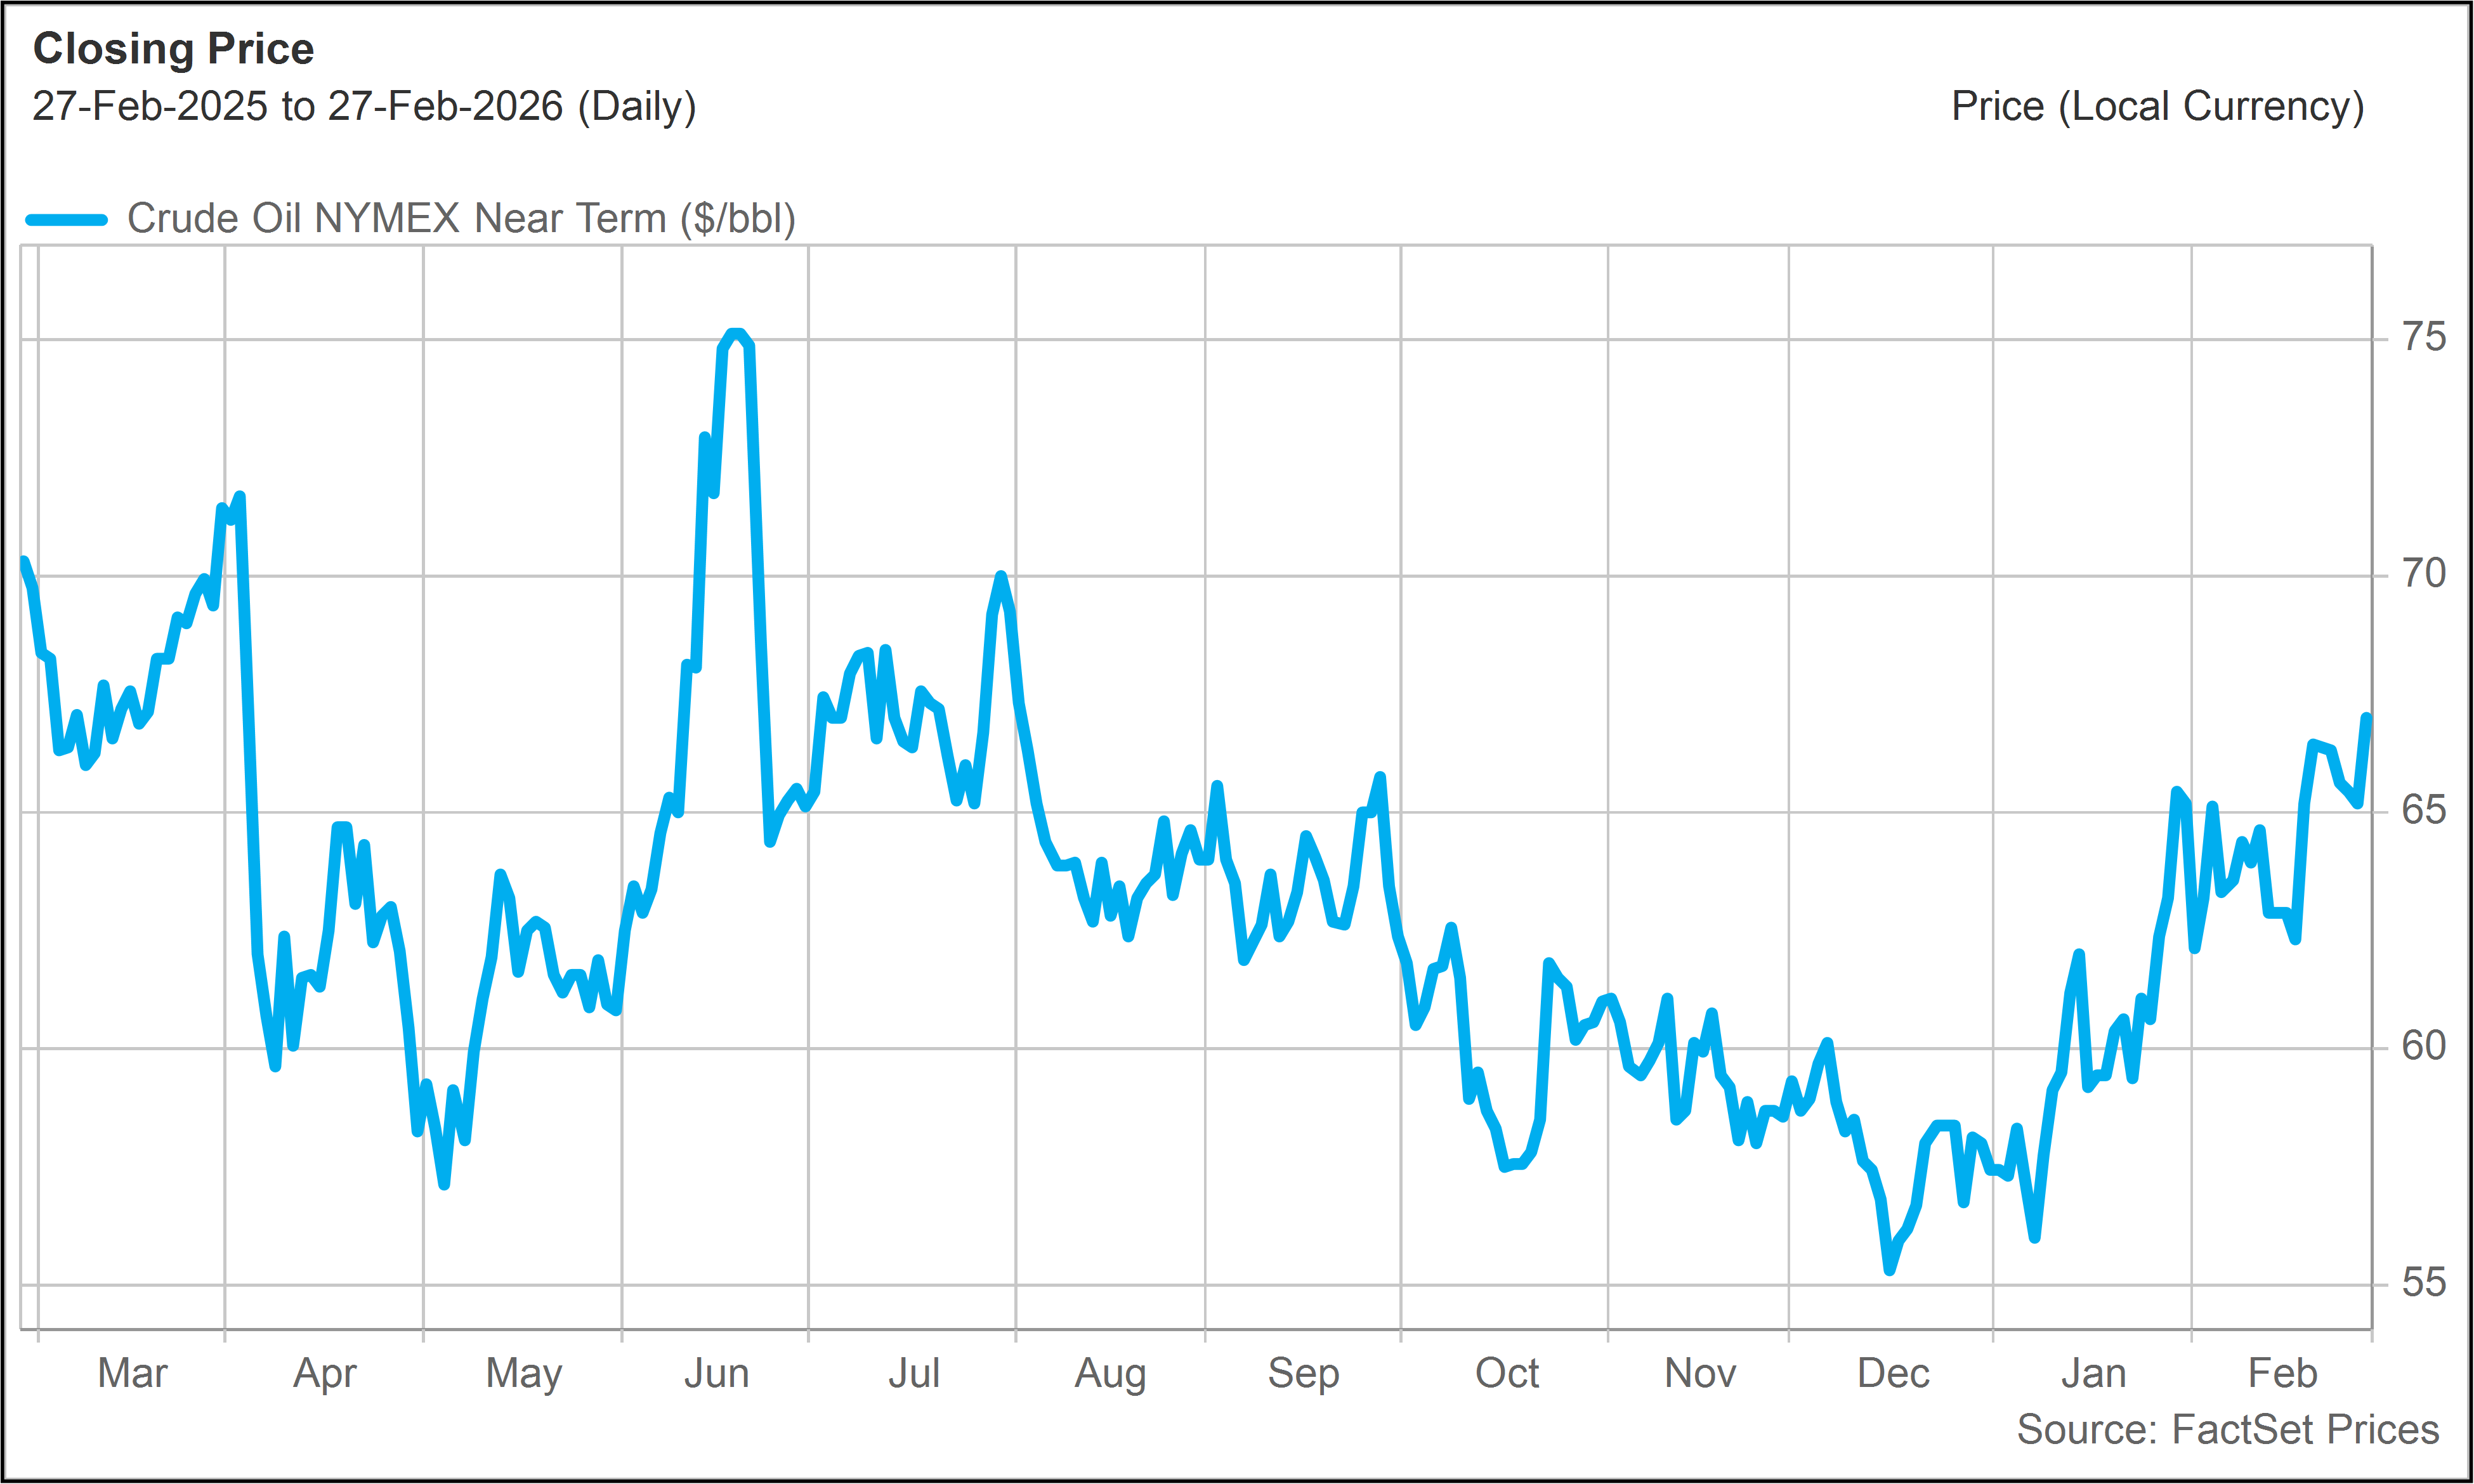
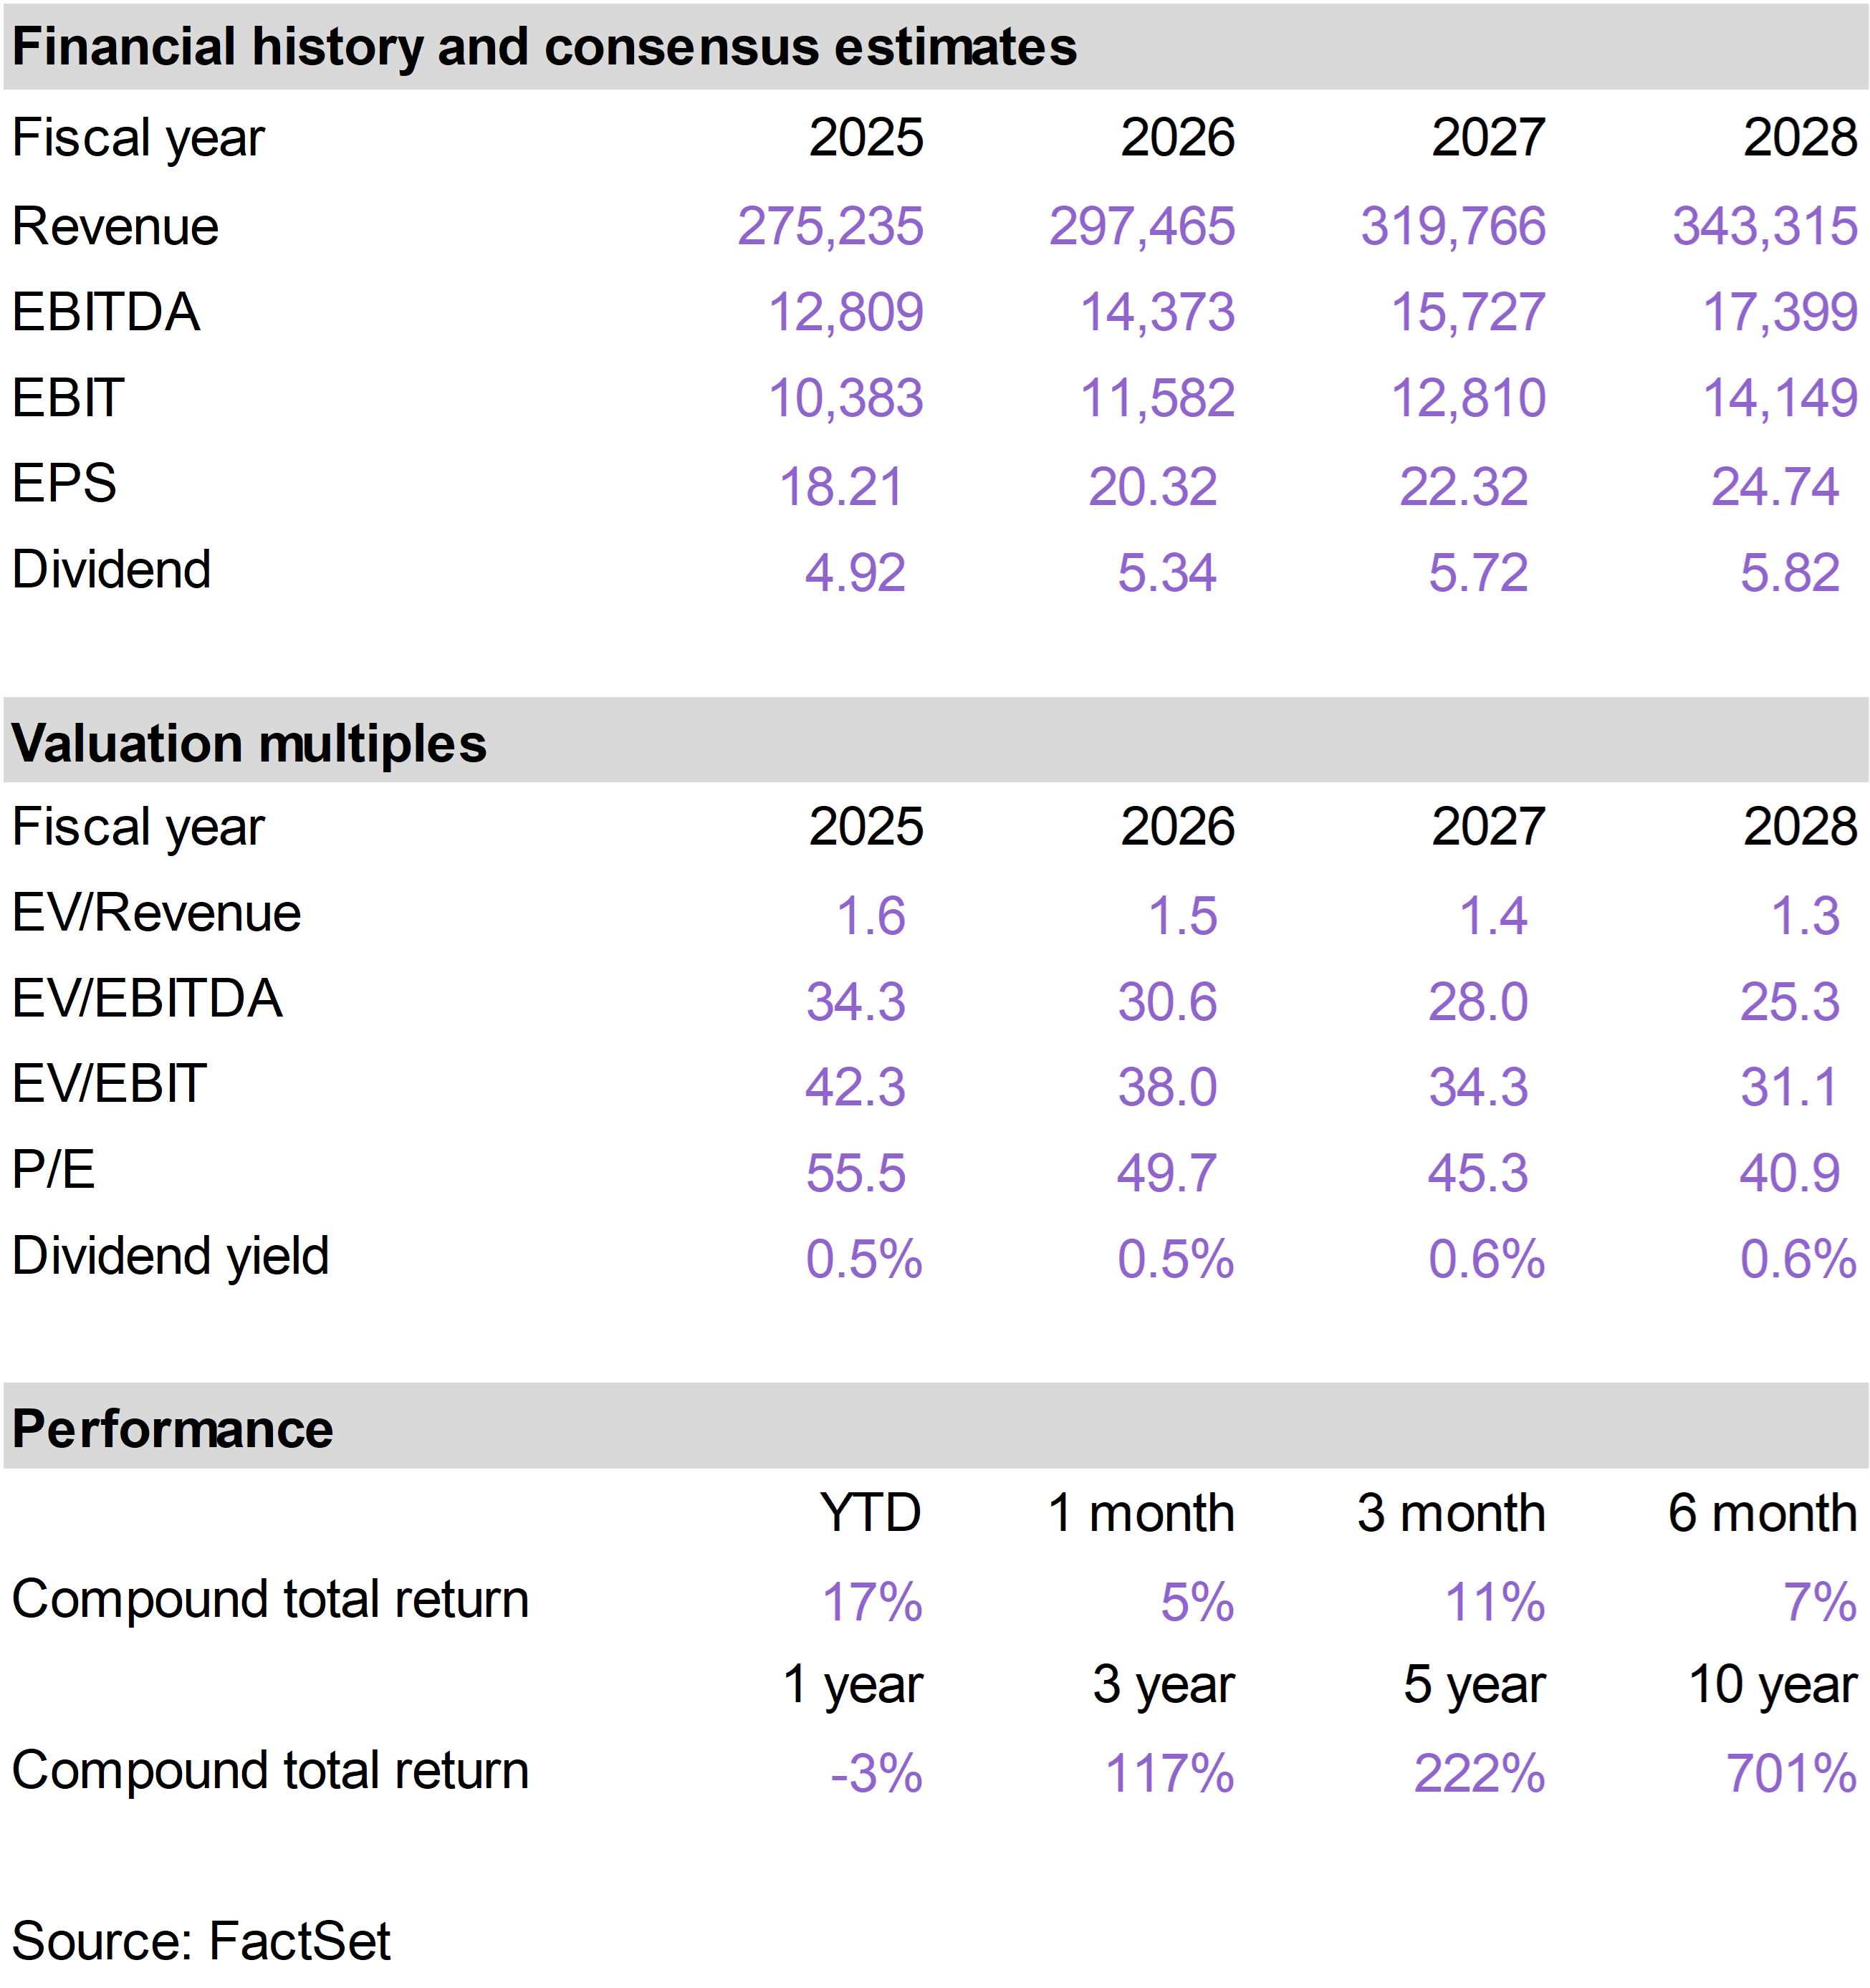
Energy stocks were assisted by a sharp recovery in crude oil prices, which had drifted below $60 per barrel toward the end of 2025.
Crude oil prices continued to move up in February. They advanced in January, following the events in Venezuela, which were seen as potentially disruptive to supplies in the short-term. In February, crude again moved higher in anticipation of a potential military intervention in Iran. |
|
|
|
Crude Oil - Last 12 Months |
|
|
Operation Epic Fury
As we write, we are in the early stages of Trump’s decision to launch a full-scale attack on Iran. Ayatollah Khamenei has been confirmed killed, along with other senior leaders of the regime. Much of Iran’s military capability appears to have been decimated.
While Iran has responded with various missile attacks across the region, leading to some damage and casualties, its ability to mount a substantial retaliation is questionable.
The situation remains fluid. Early indications suggest modest pressure on stocks heading into the new week. Oil prices appear significantly higher given the potential closure of the Strait of Hormuz. Gold is stronger with the rise in geopolitical uncertainty.
We will of course monitor events closely and respond in due course as the situation develops. |
|
| | | The top performing stocks in the Inflation Protection portfolio this month were Circle Internet Group (CRCL), which returned 40% (since its addition to the portfolio on 2/10/2026); Wheaton Precious Metals (WPM), which returned 24%; and Franco-Nevada (FNV), which returned 20%.
One stock in the portfolio generated a negative result in February. TransDigm (TDG) declined 9%. |
|
|
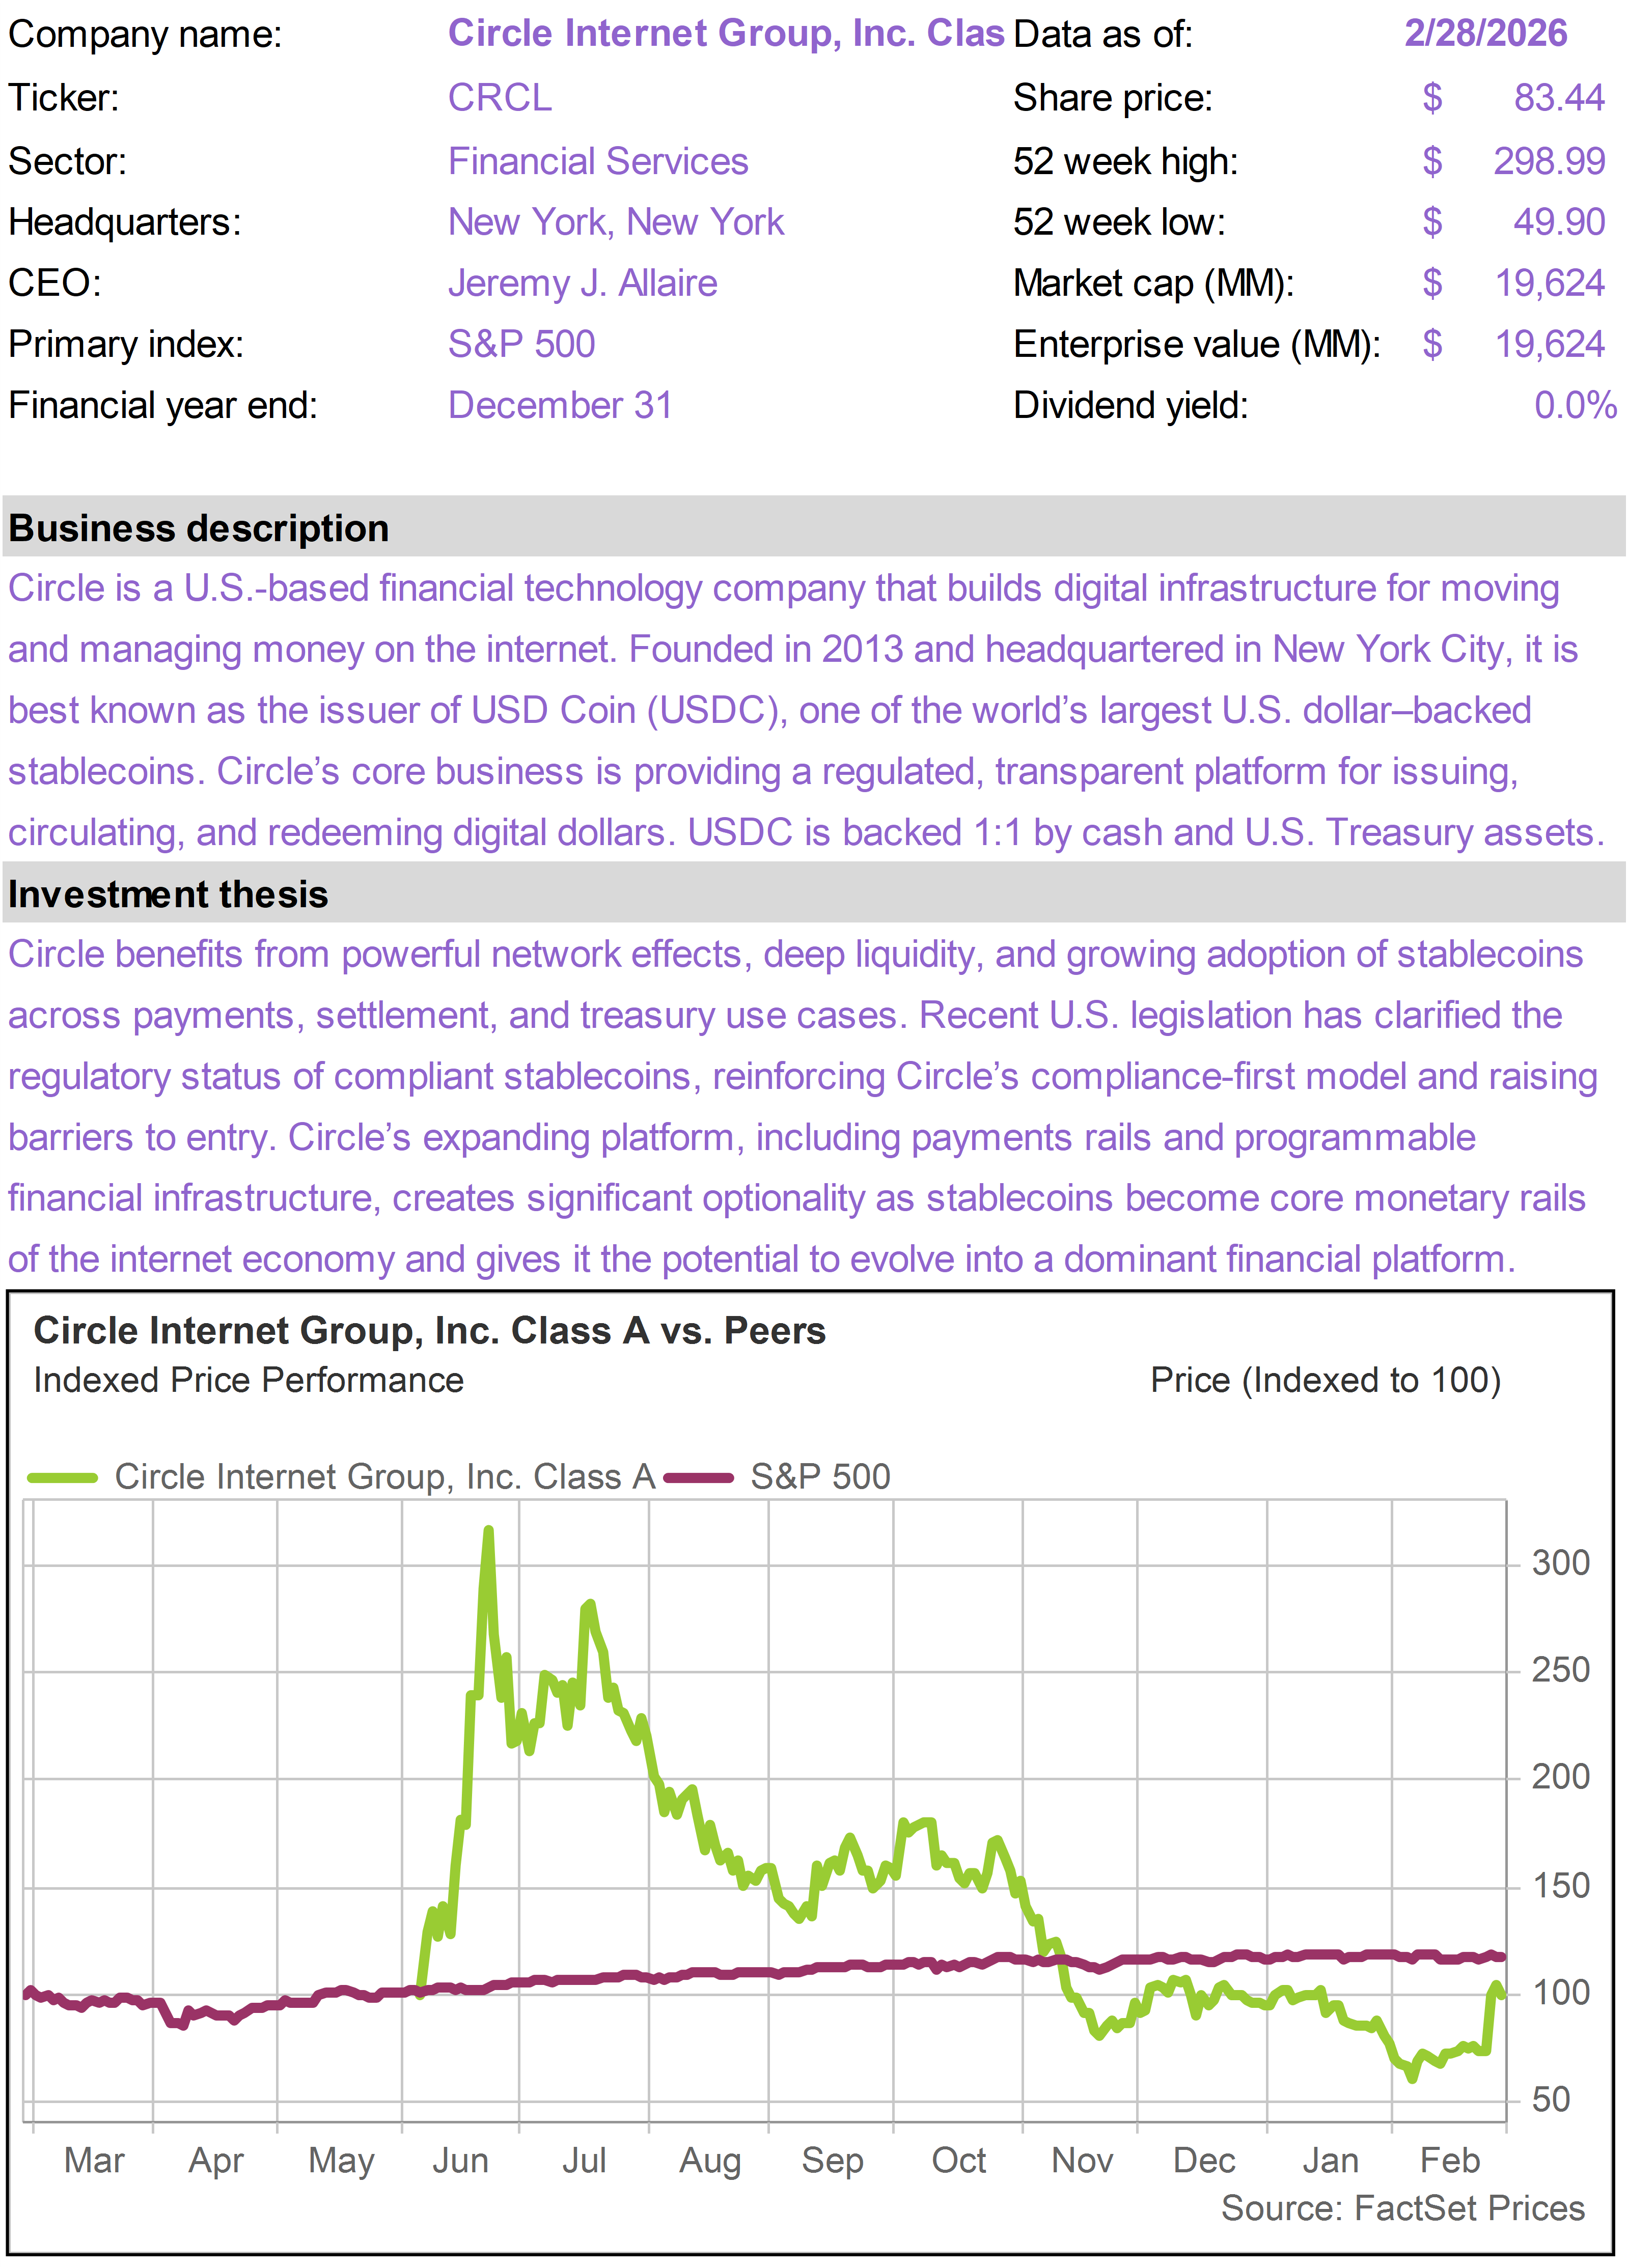
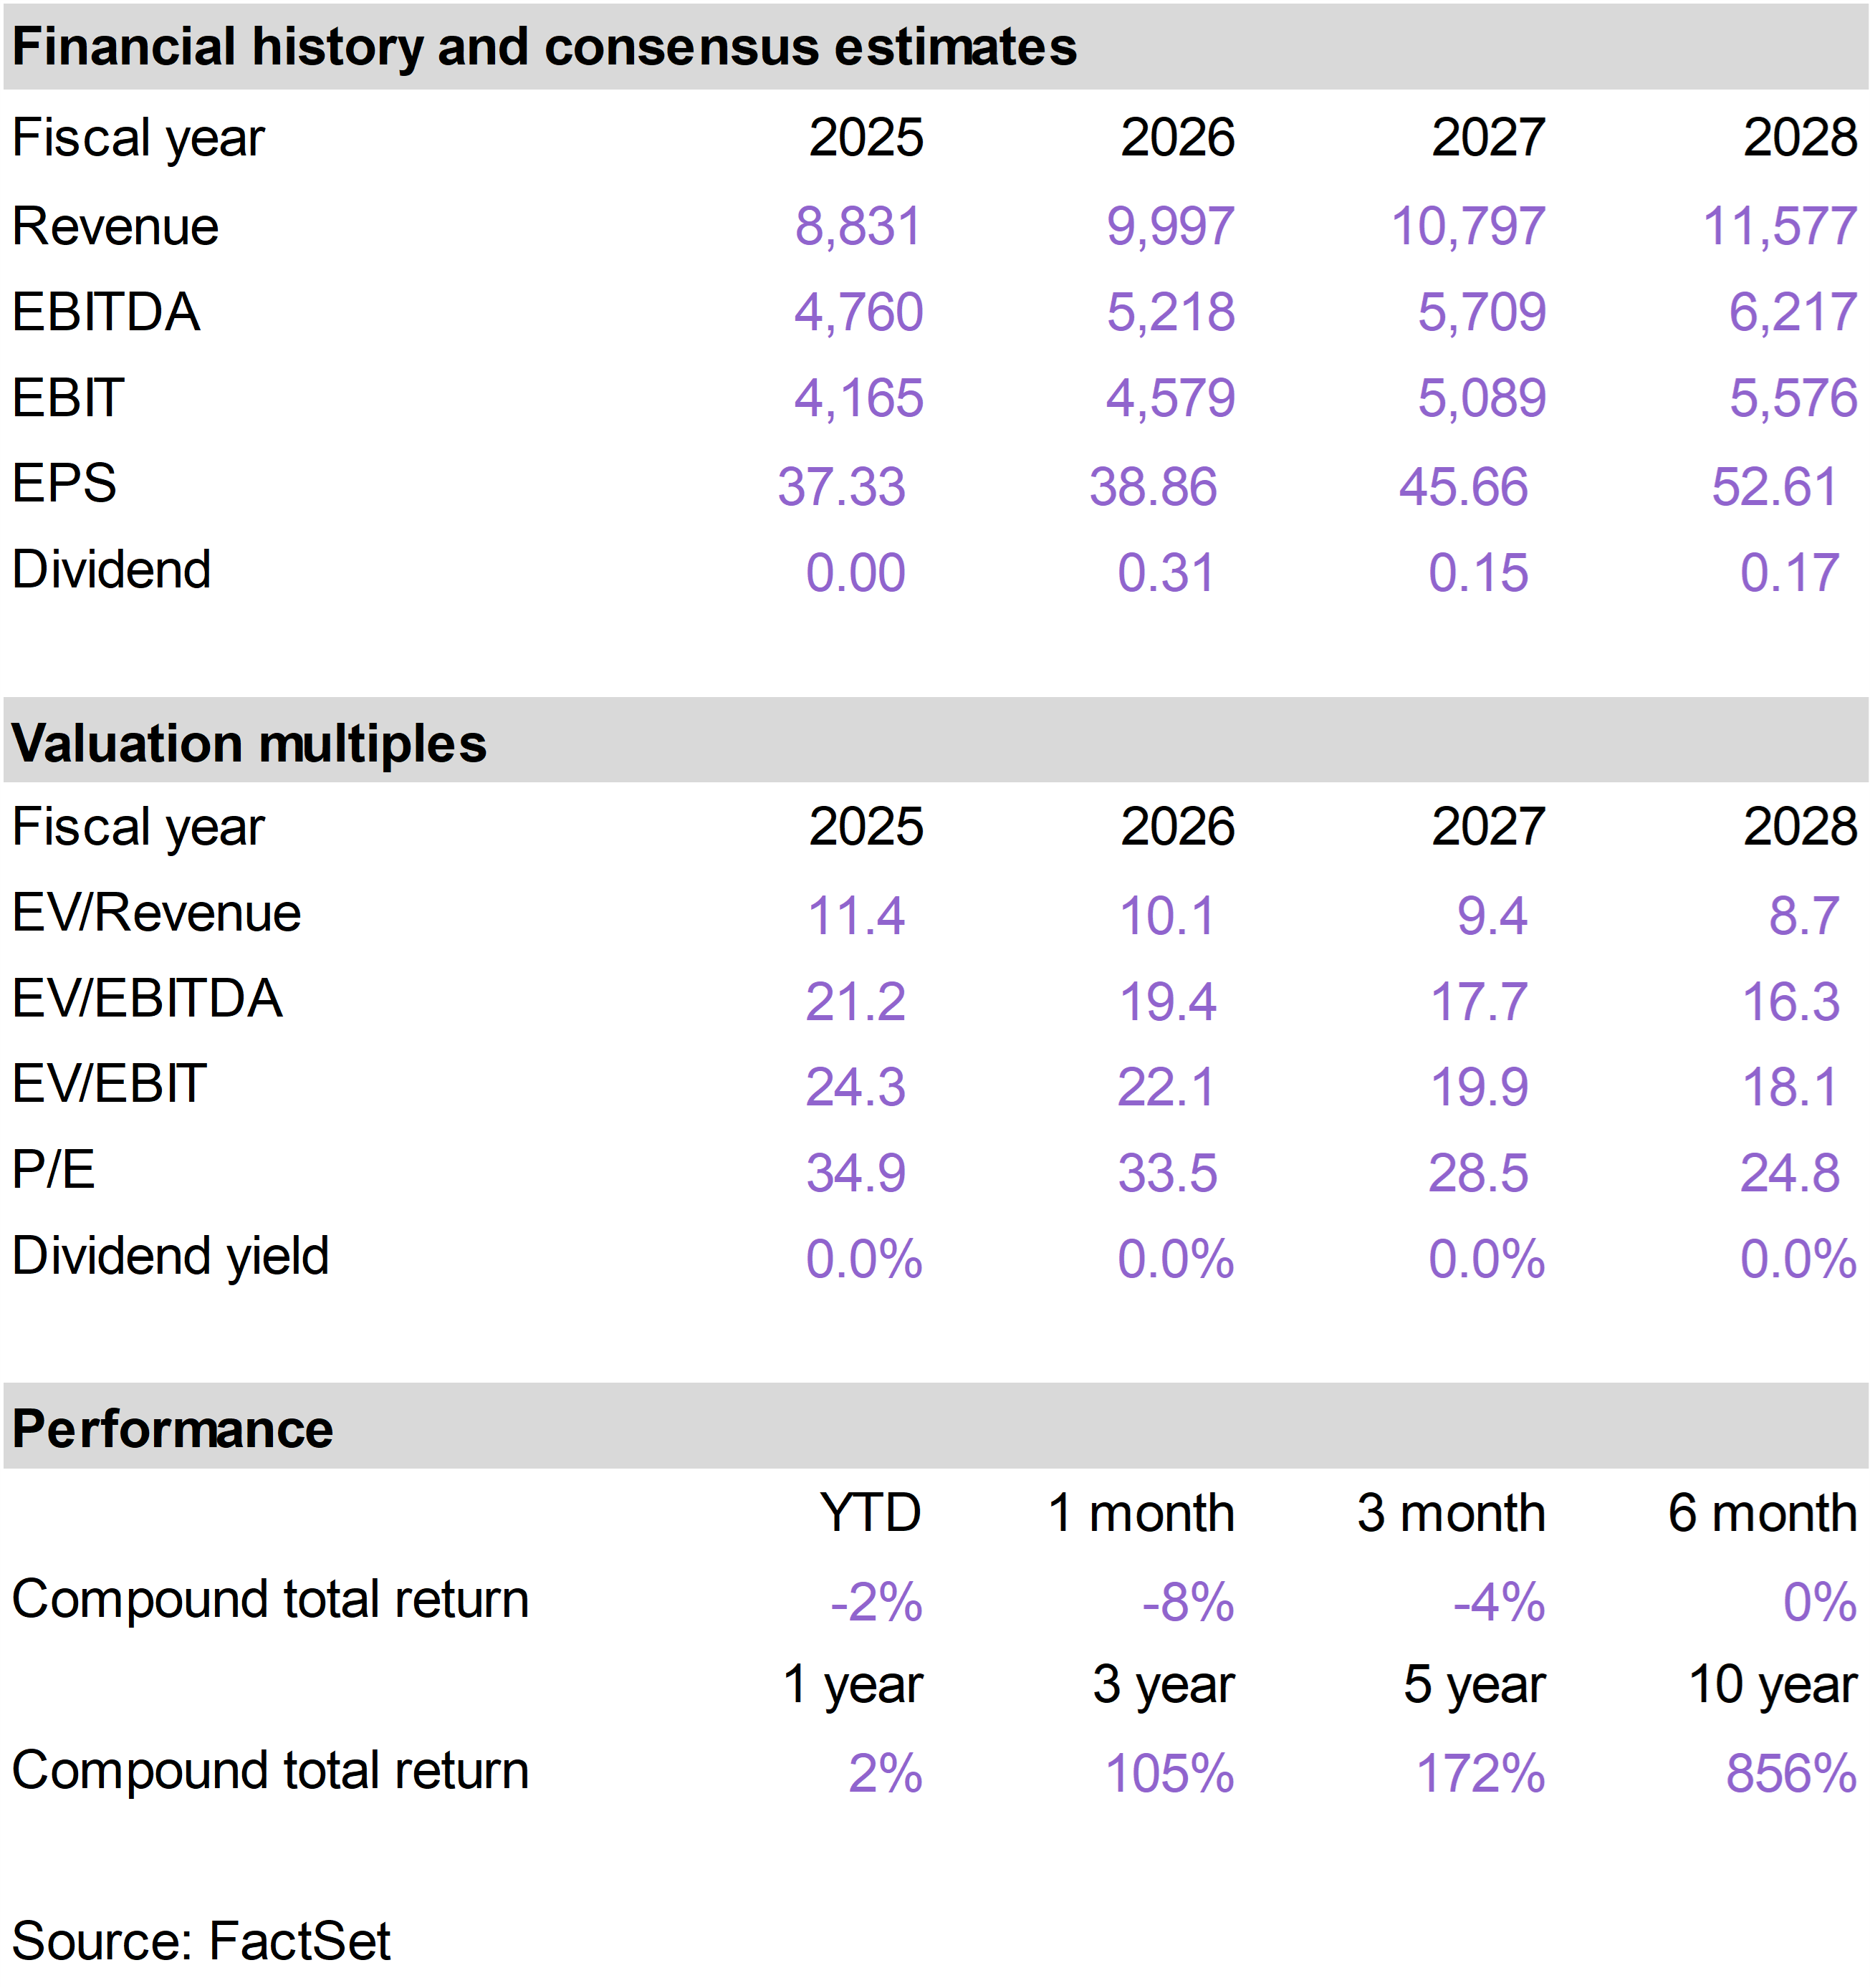
Shares of CRCL soared after the company reported fourth quarter earnings results that solidified the long-term business case.
As we explained in our initial discussion of the CRCL opportunity (Capitalizing on the Tech Downturn) as well as our post-earnings follow-up (Tech and Crypto Snap Back), we believe CRCL should not have been included in the harsh software-led sell-off.
Market sentiment can move a stock up or down, but ultimately fundamentals tend to prevail. When CRCL reported fourth quarter results on February 25, attention shifted away from sweeping sector narratives and toward the company’s substantial operational progress.
Notwithstanding the difficult environment for crypto, stablecoins continue to attract capital and gain adoption. CRCL stands to benefit from AI as more transactions, payments, and financial services move online and become automated, increasing demand for trusted, regulated digital dollars. |
|
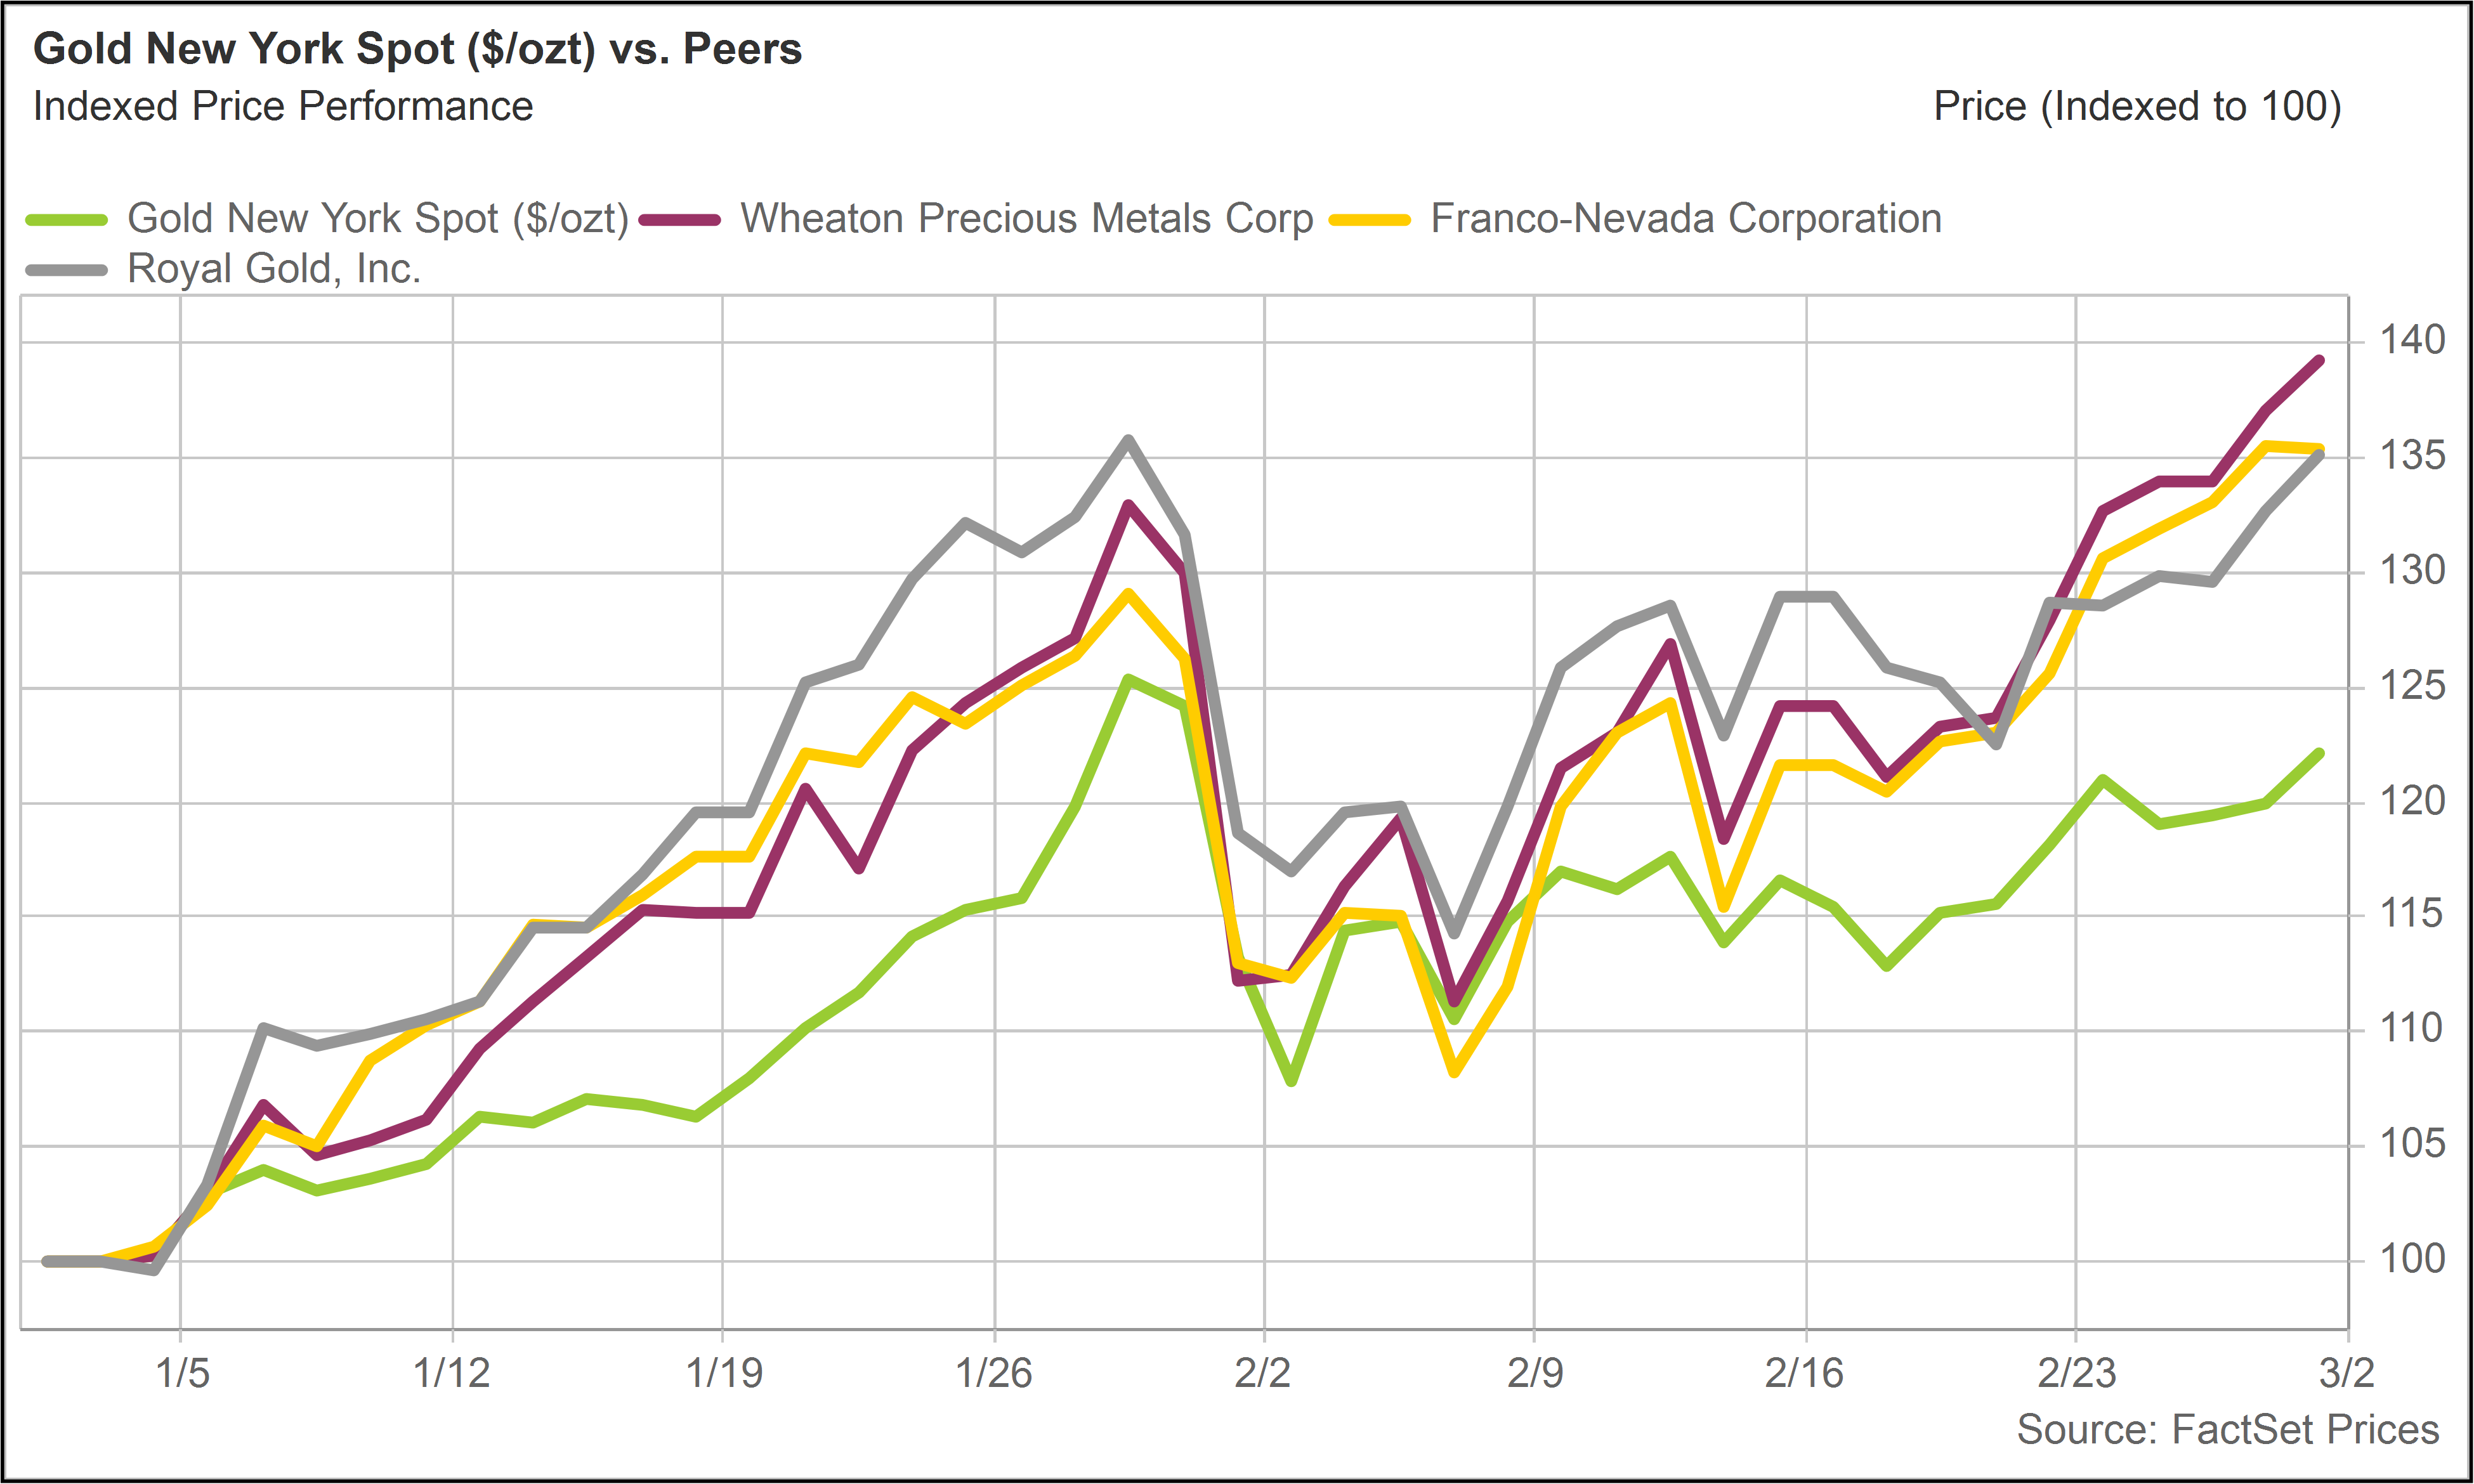
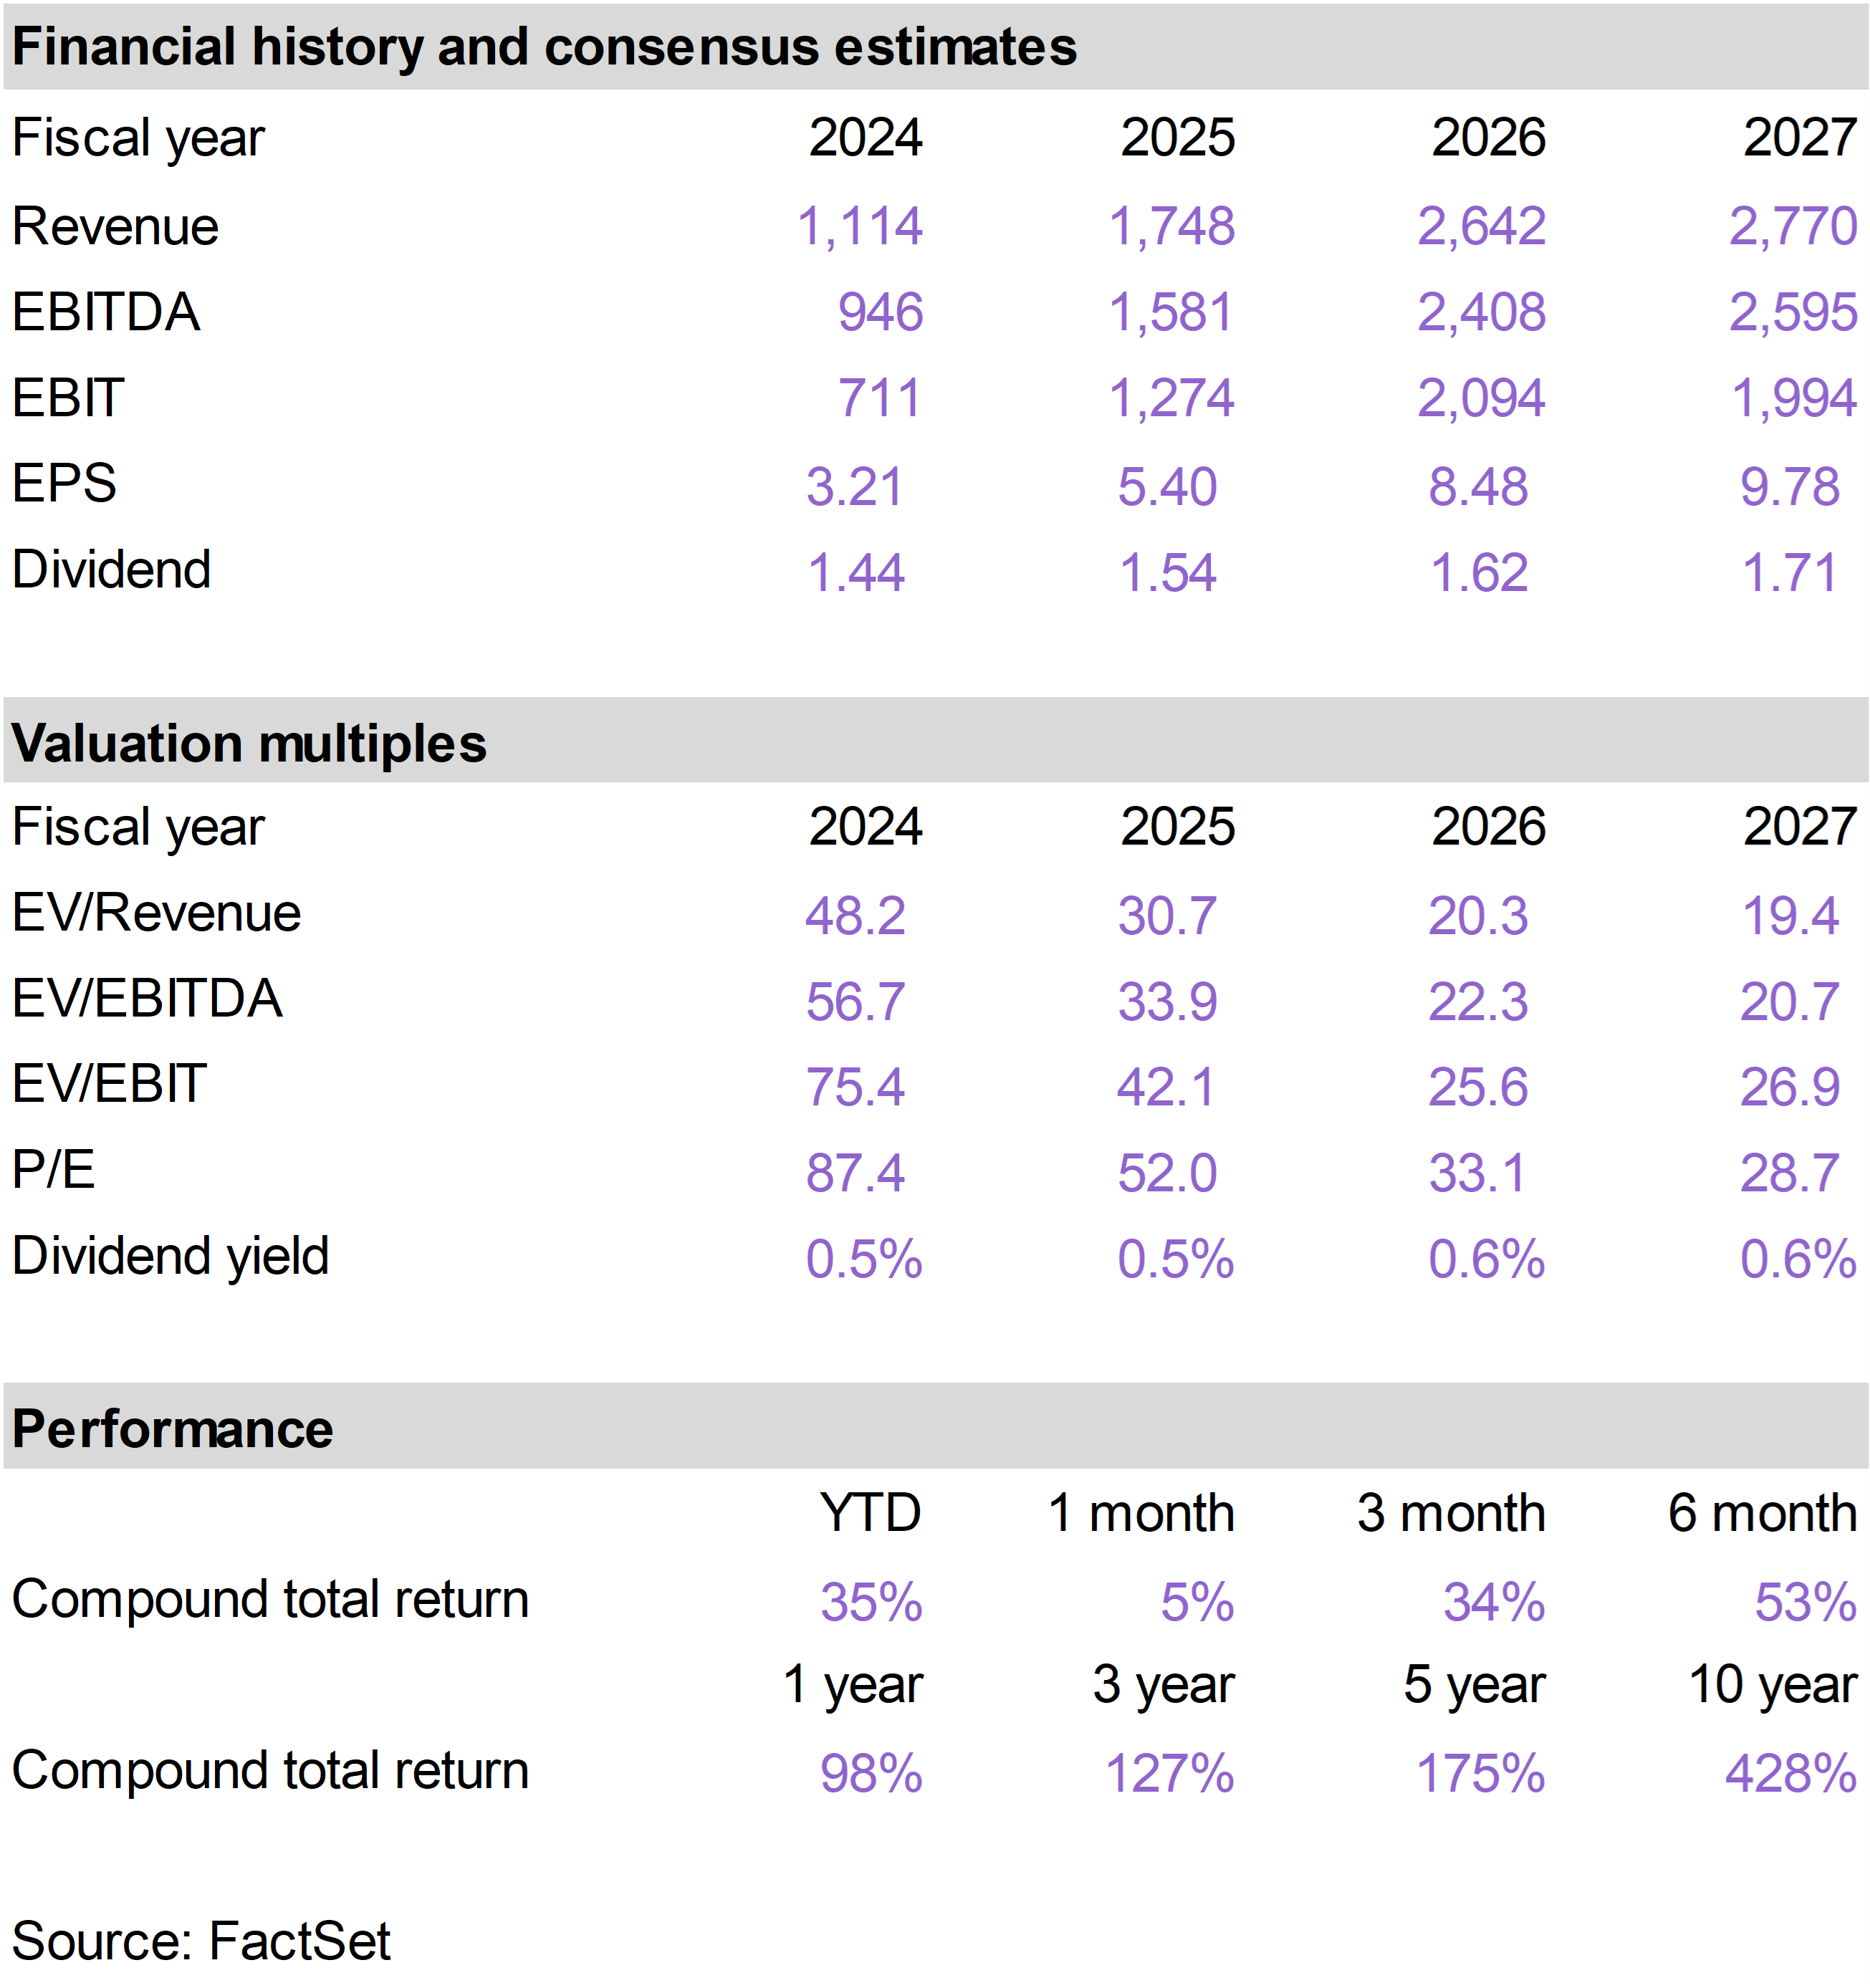
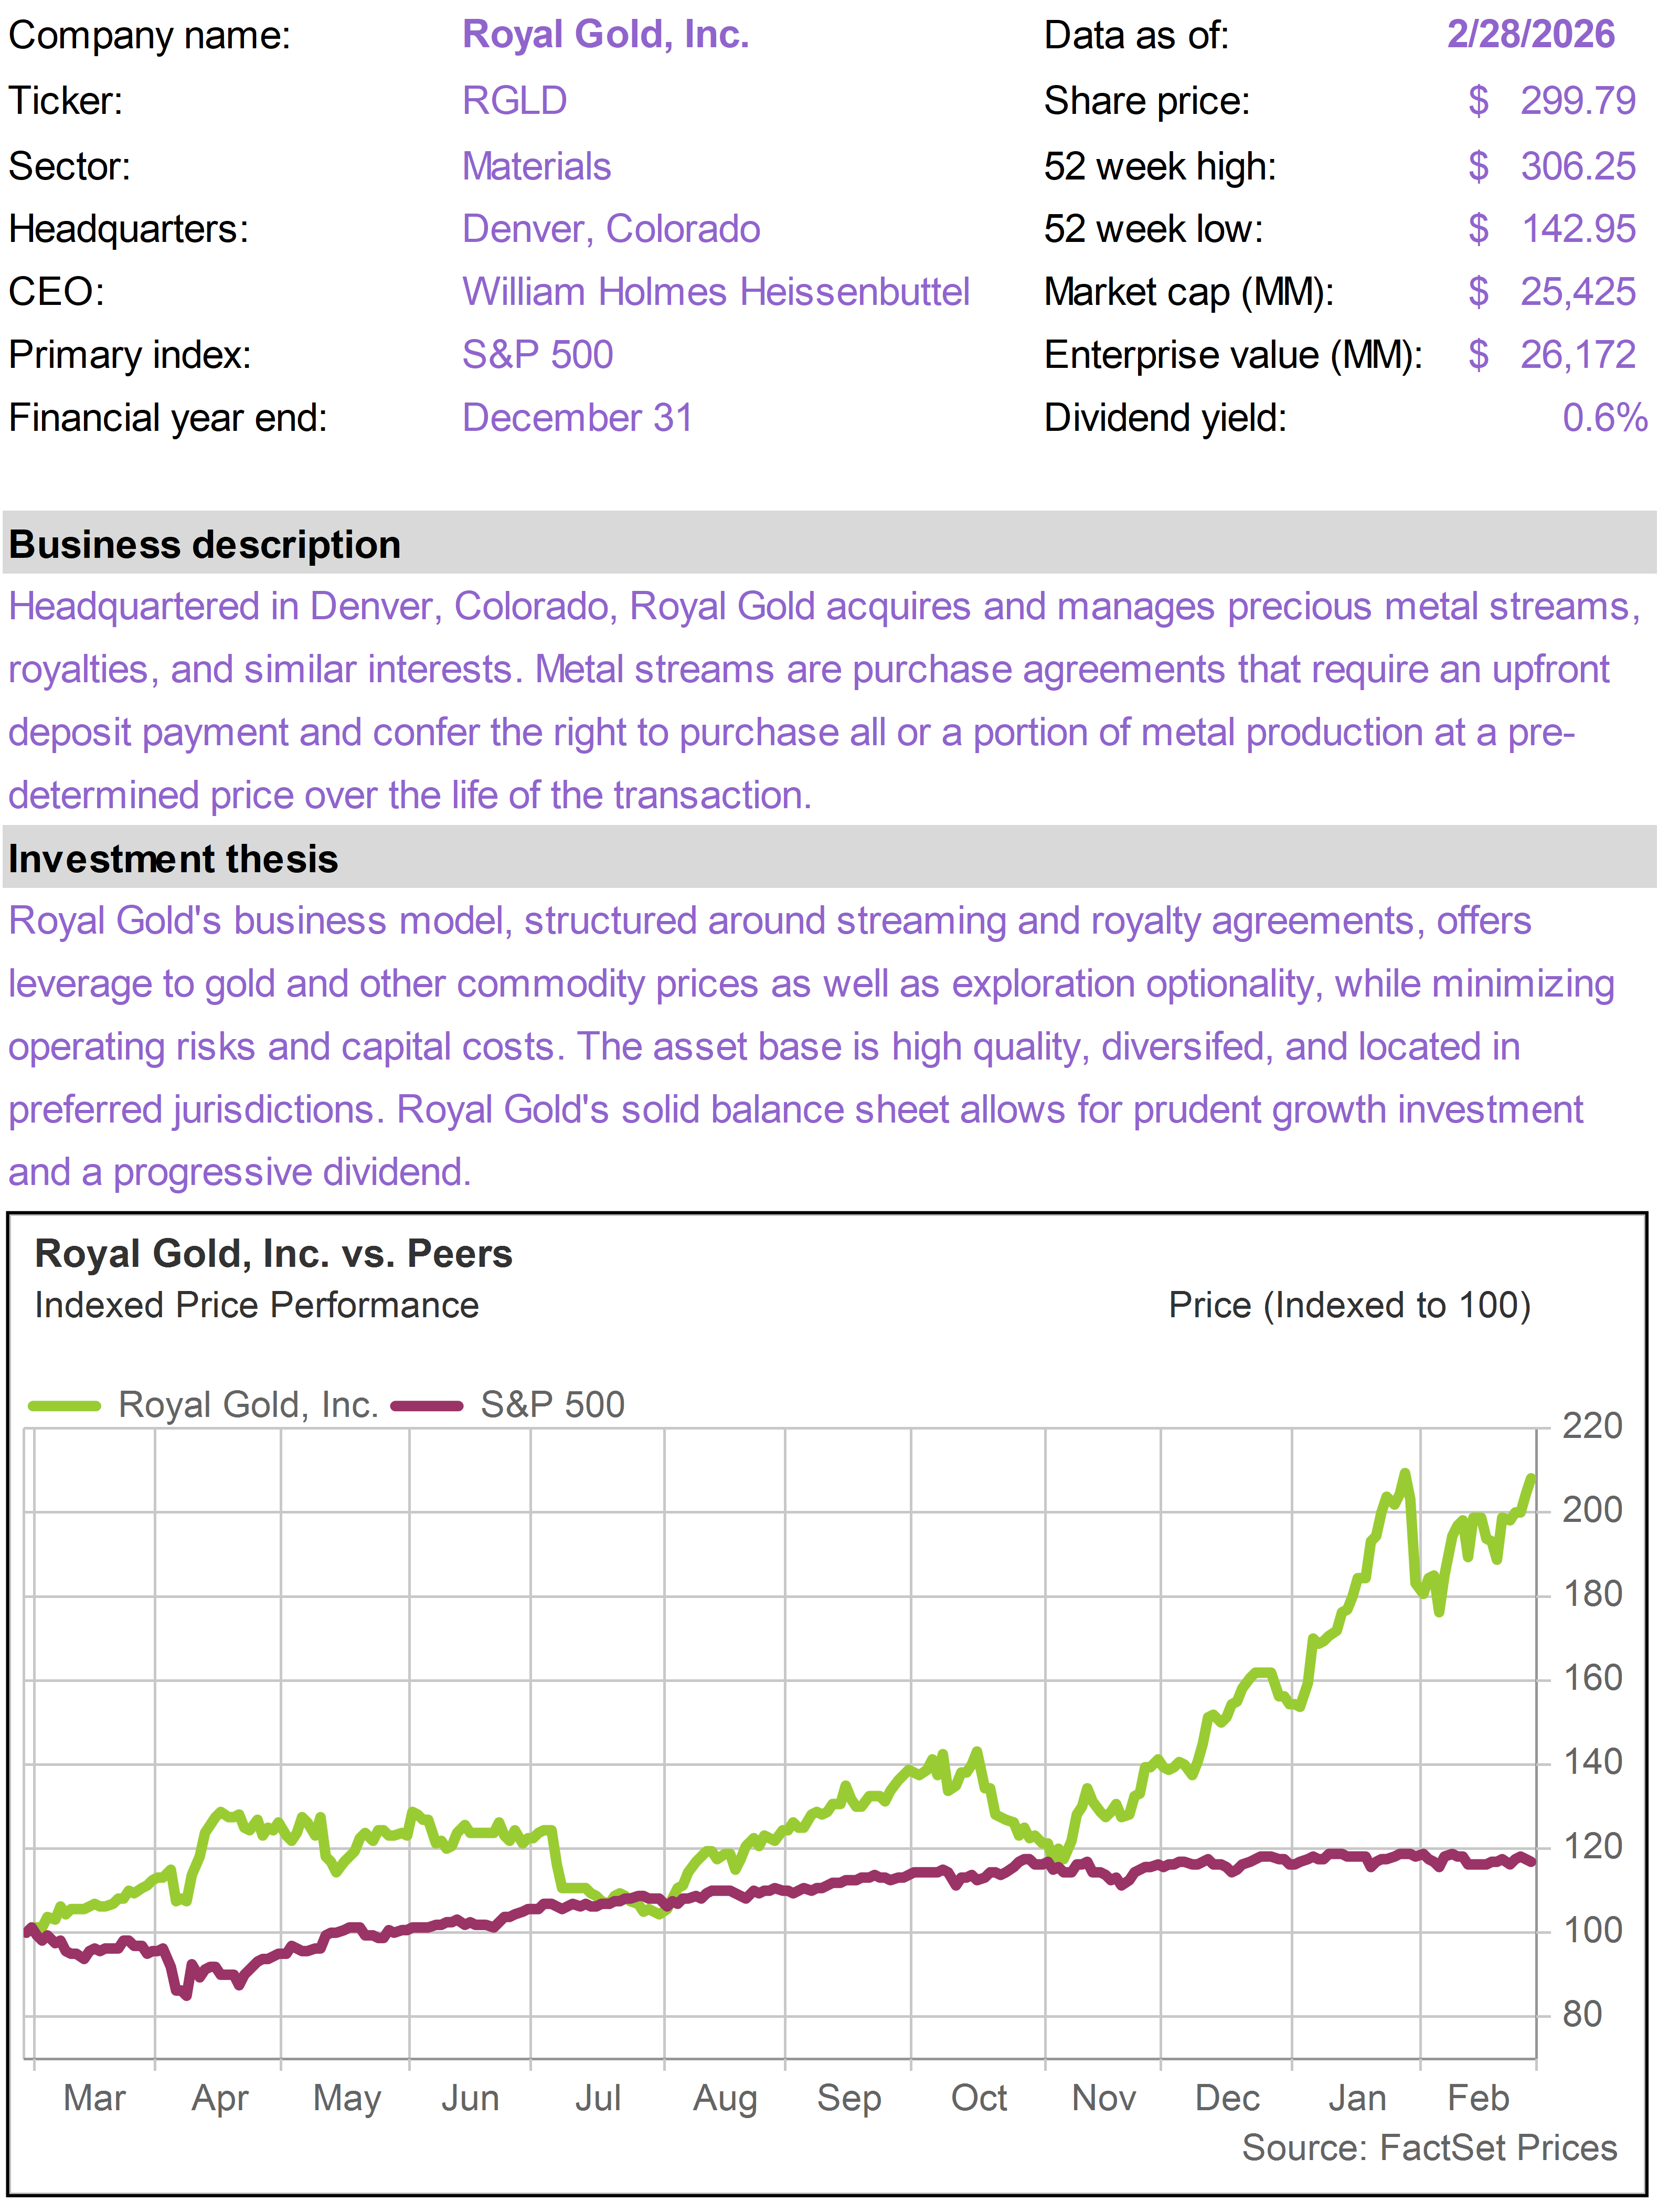
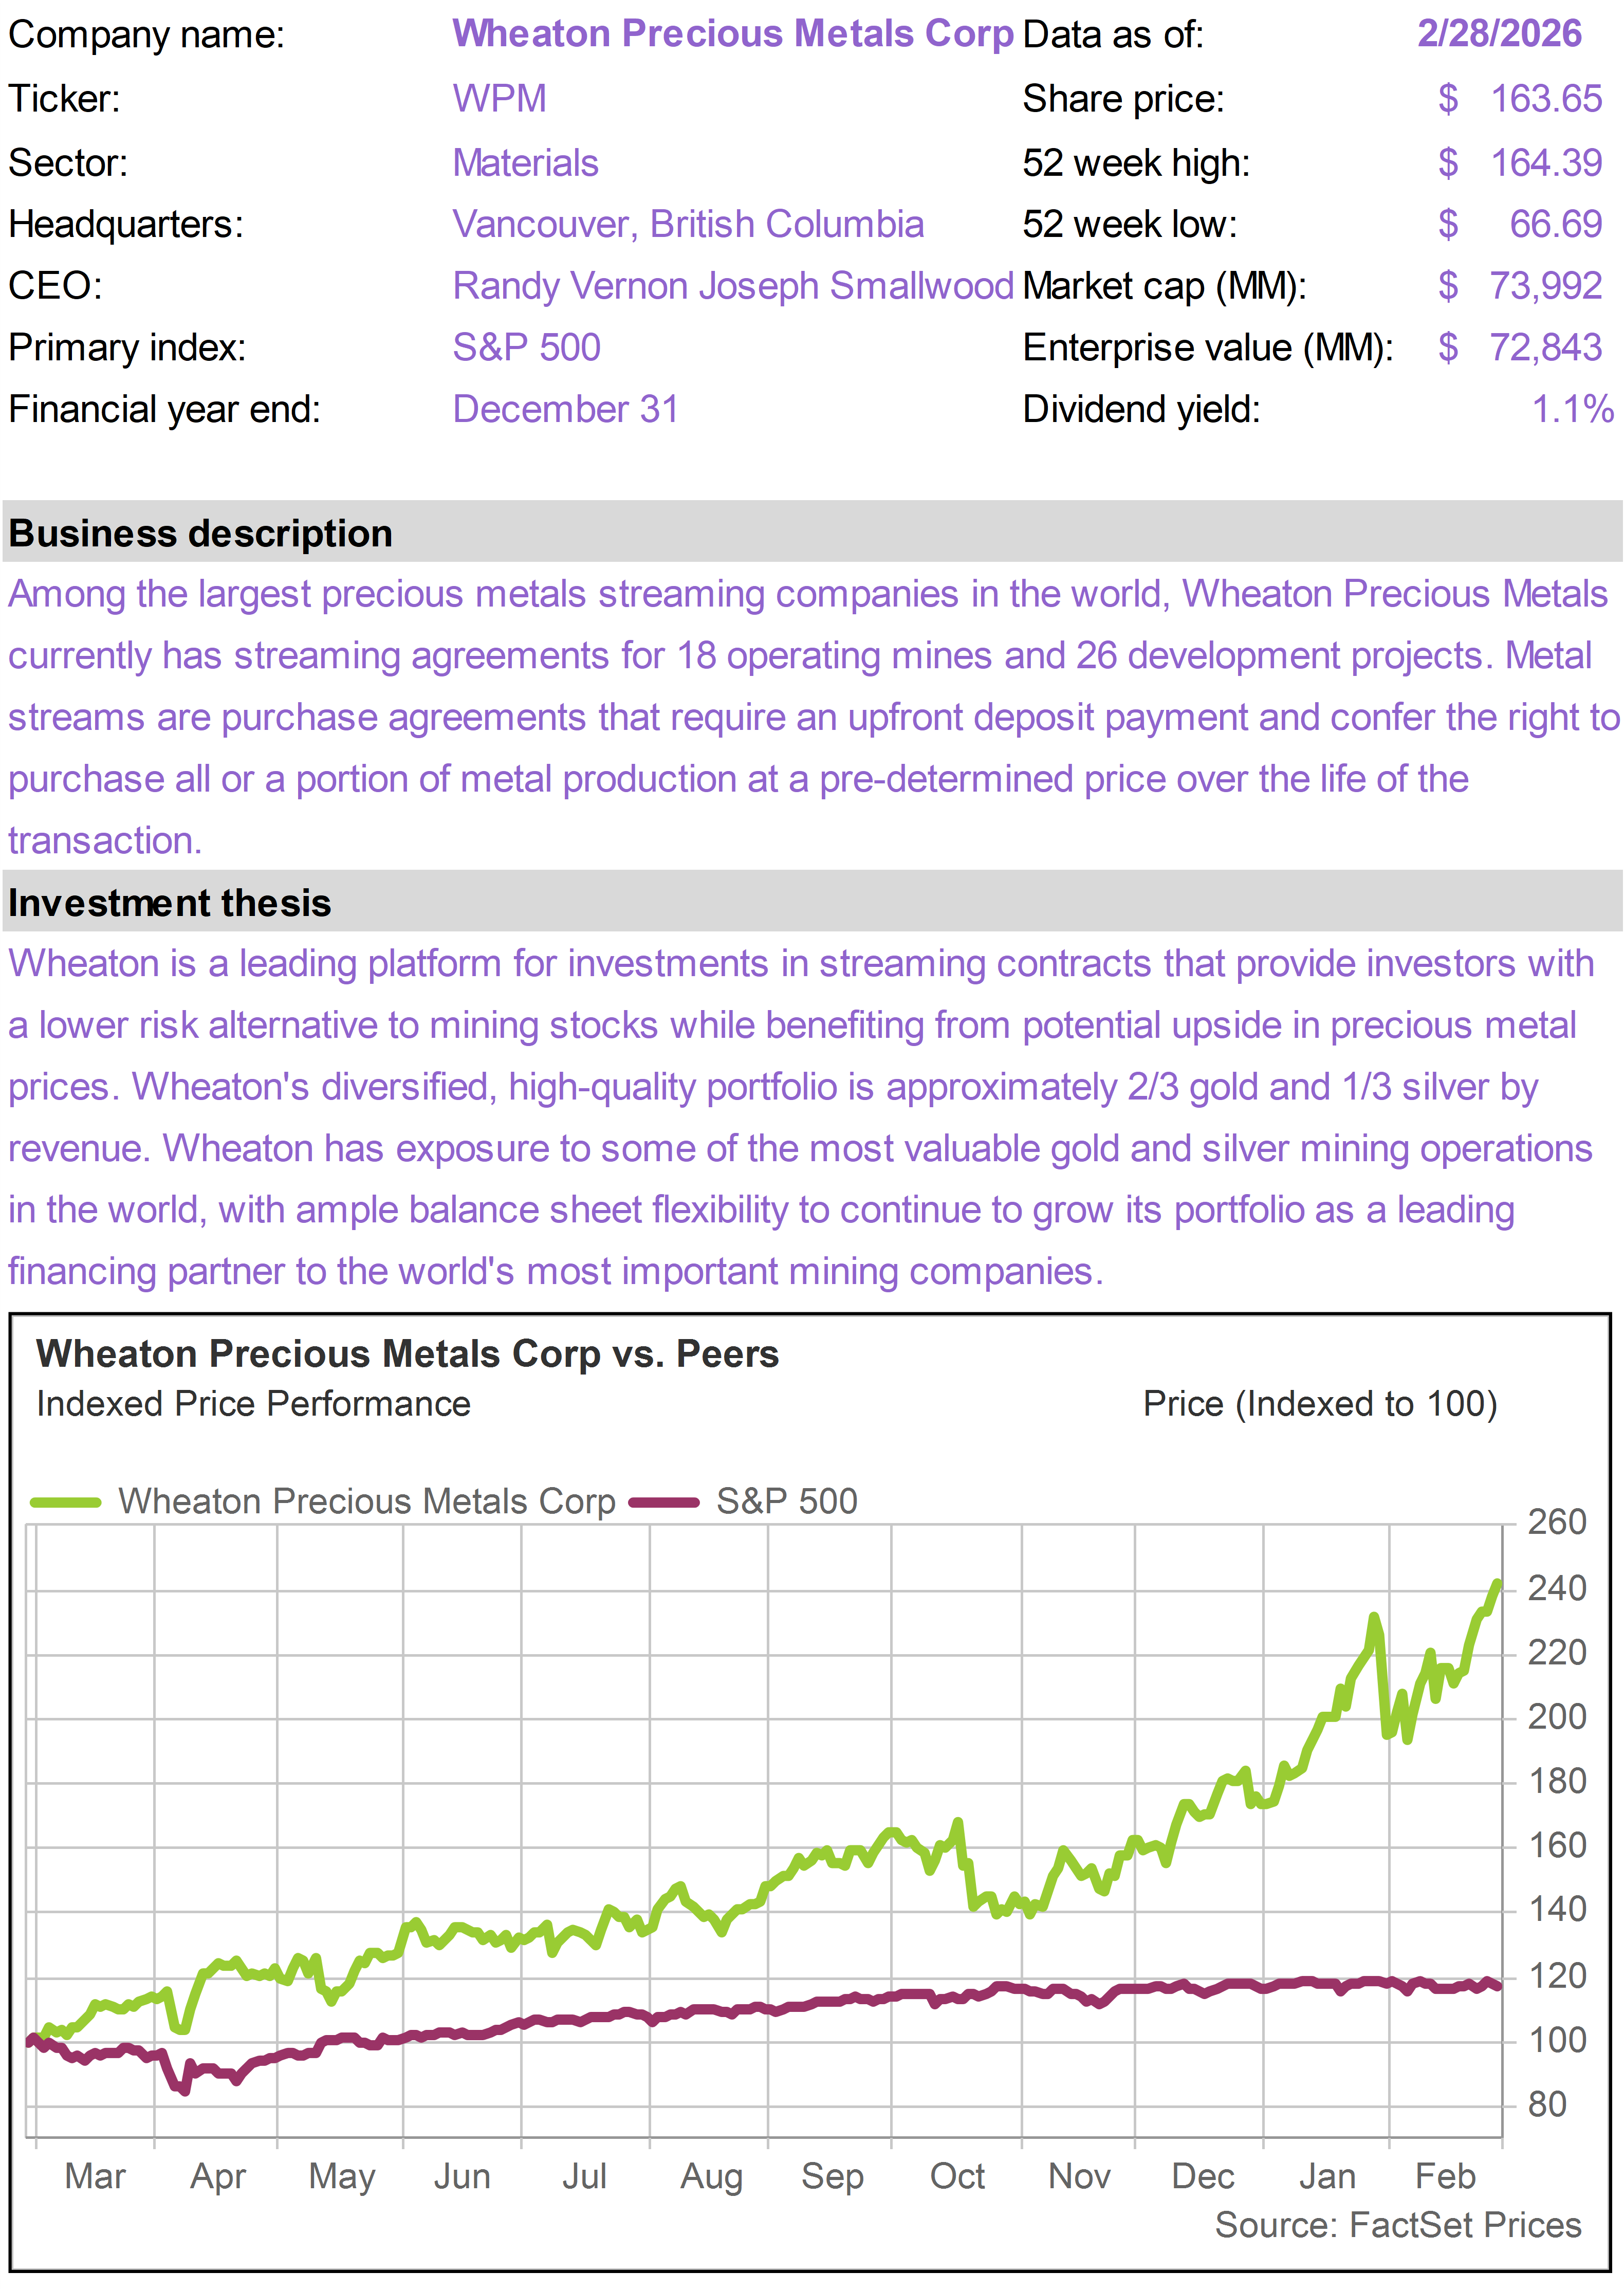
| The portfolio’s gold streaming plays, WPM, FNV and Royal Gold (RGLD), continue to generate strong returns and outperform gold. Gold climbed approximately 8% in February, getting close to its record high achieved in late January. The three streaming stocks generated returns between 14% and 24%.
The sharp correction in the gold price at the end of January led to steeper declines in mining and streaming shares. As gold recovered in February, the gold-related stocks in our portfolio outperformed. |
|
|
|
Gold vs. WPM, FNV, RGLD(Total Return - Year to date 2026) |
|
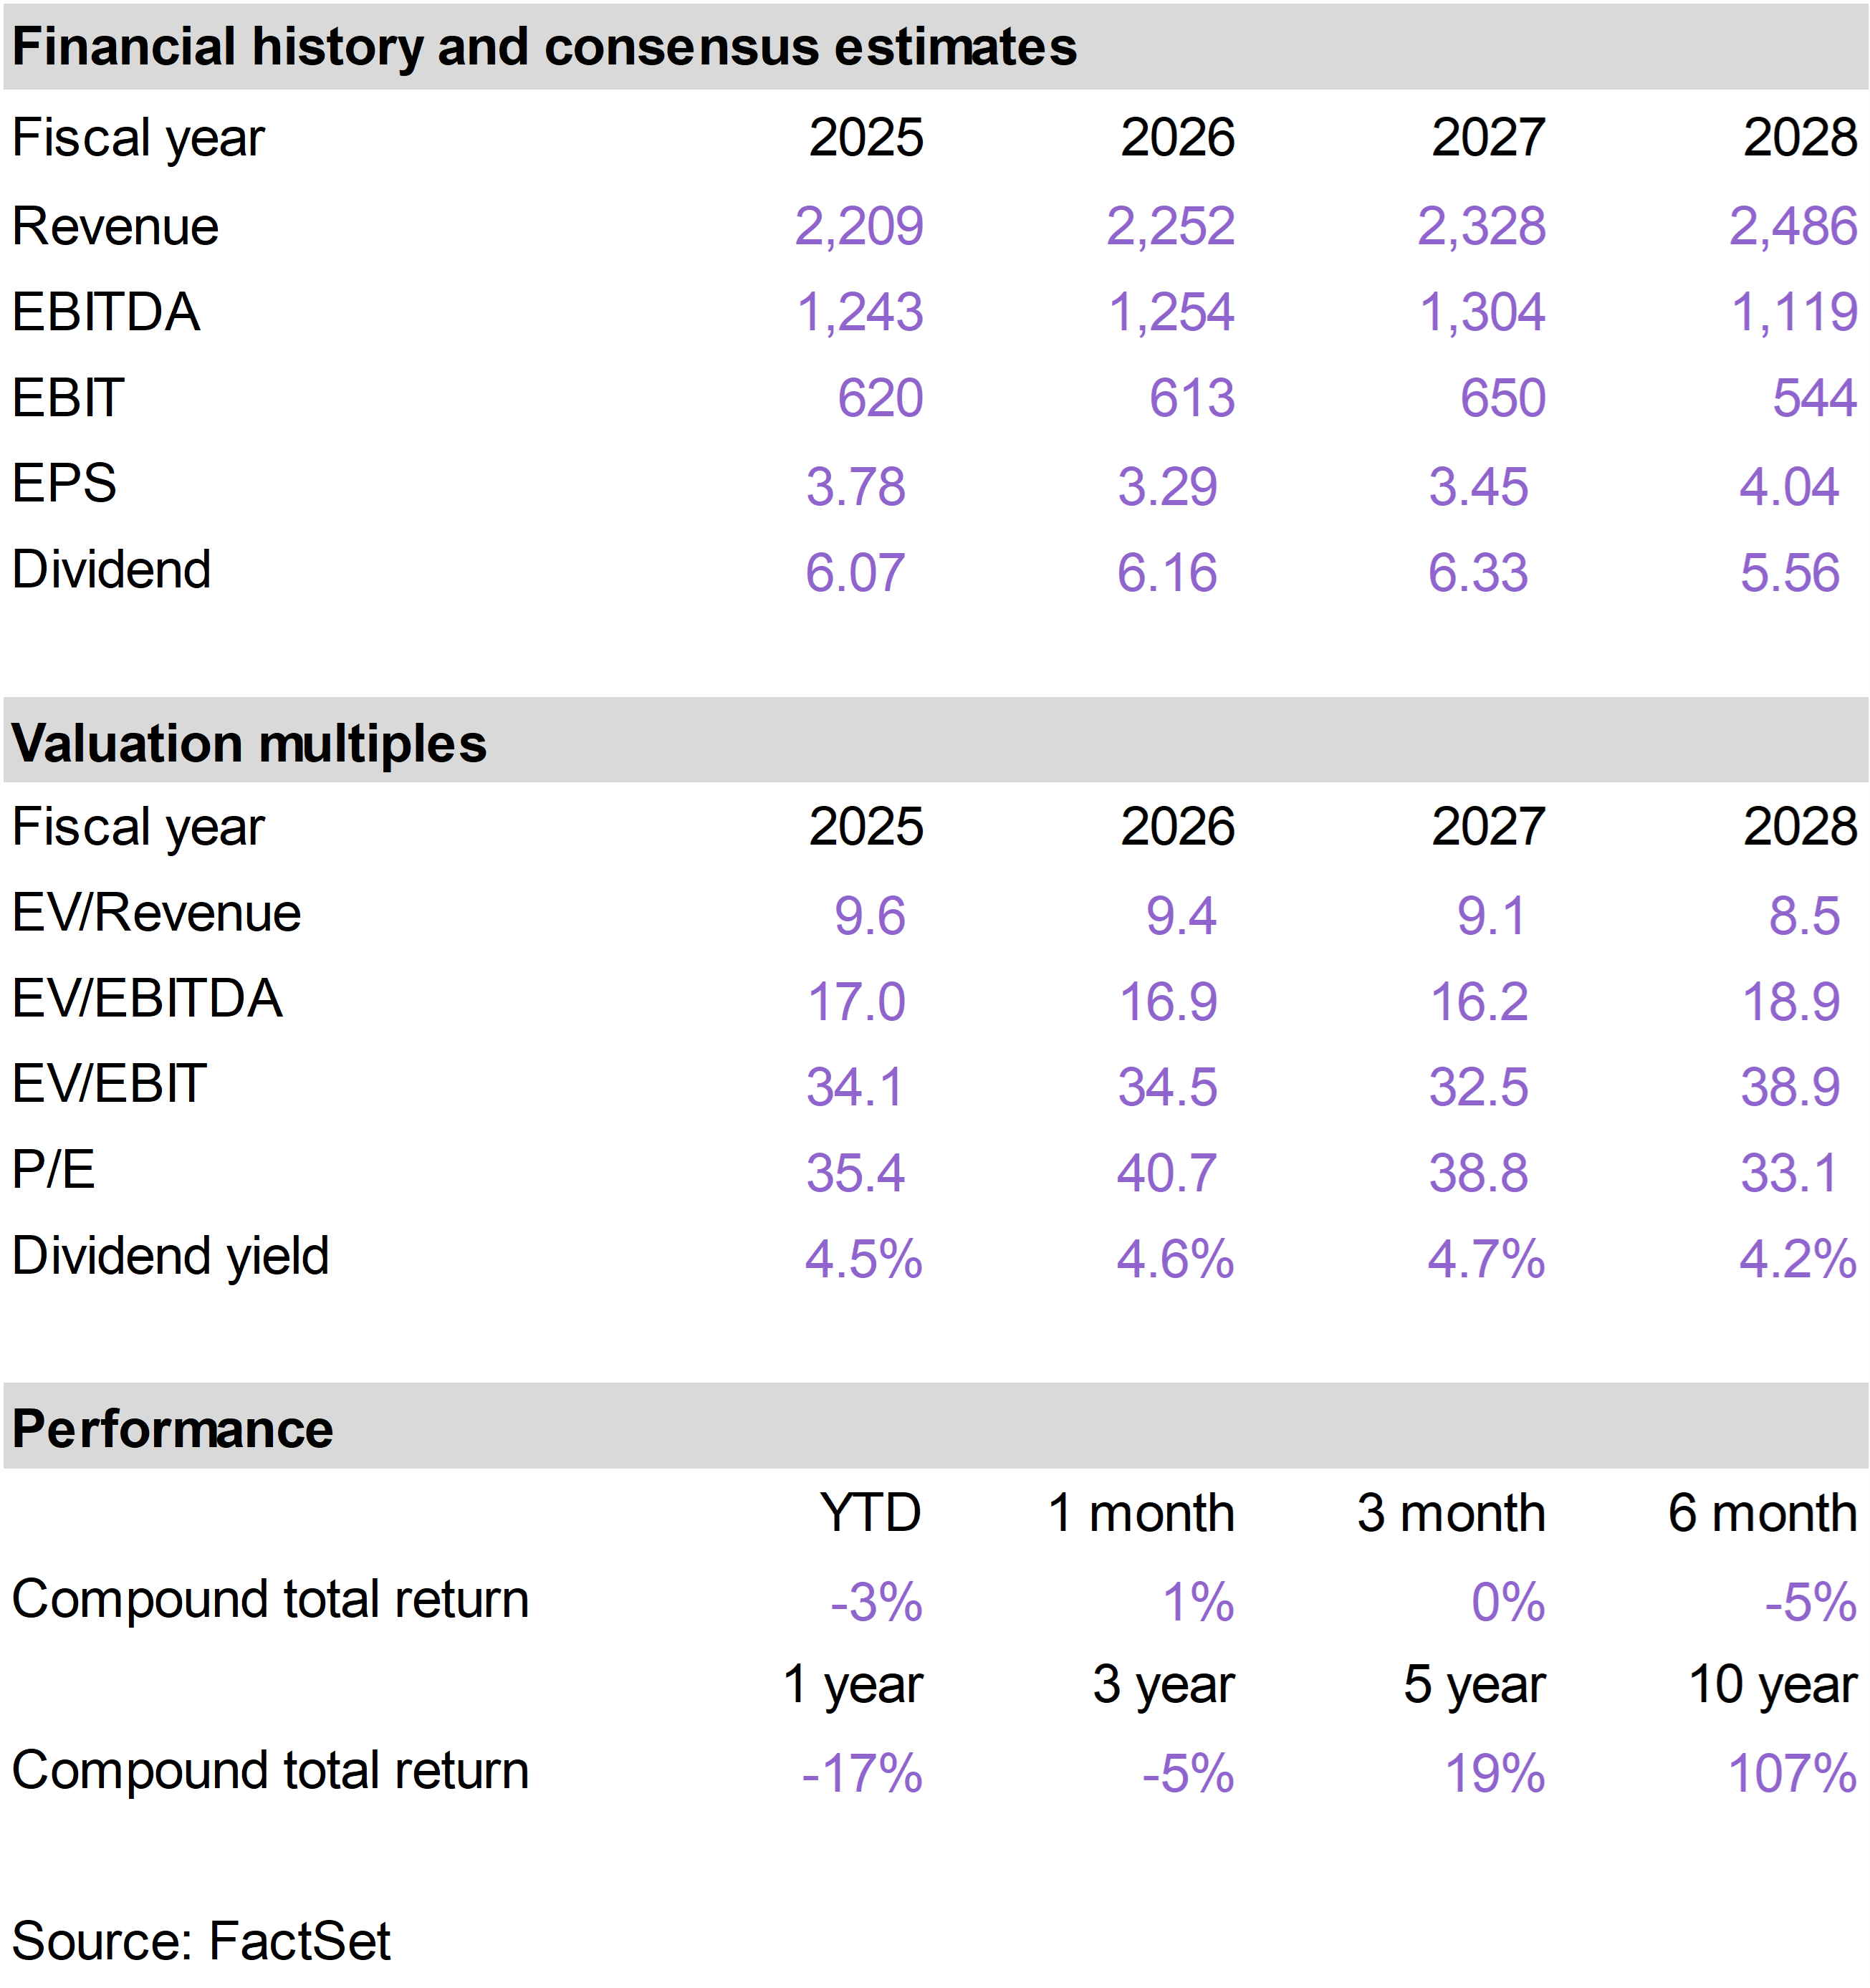
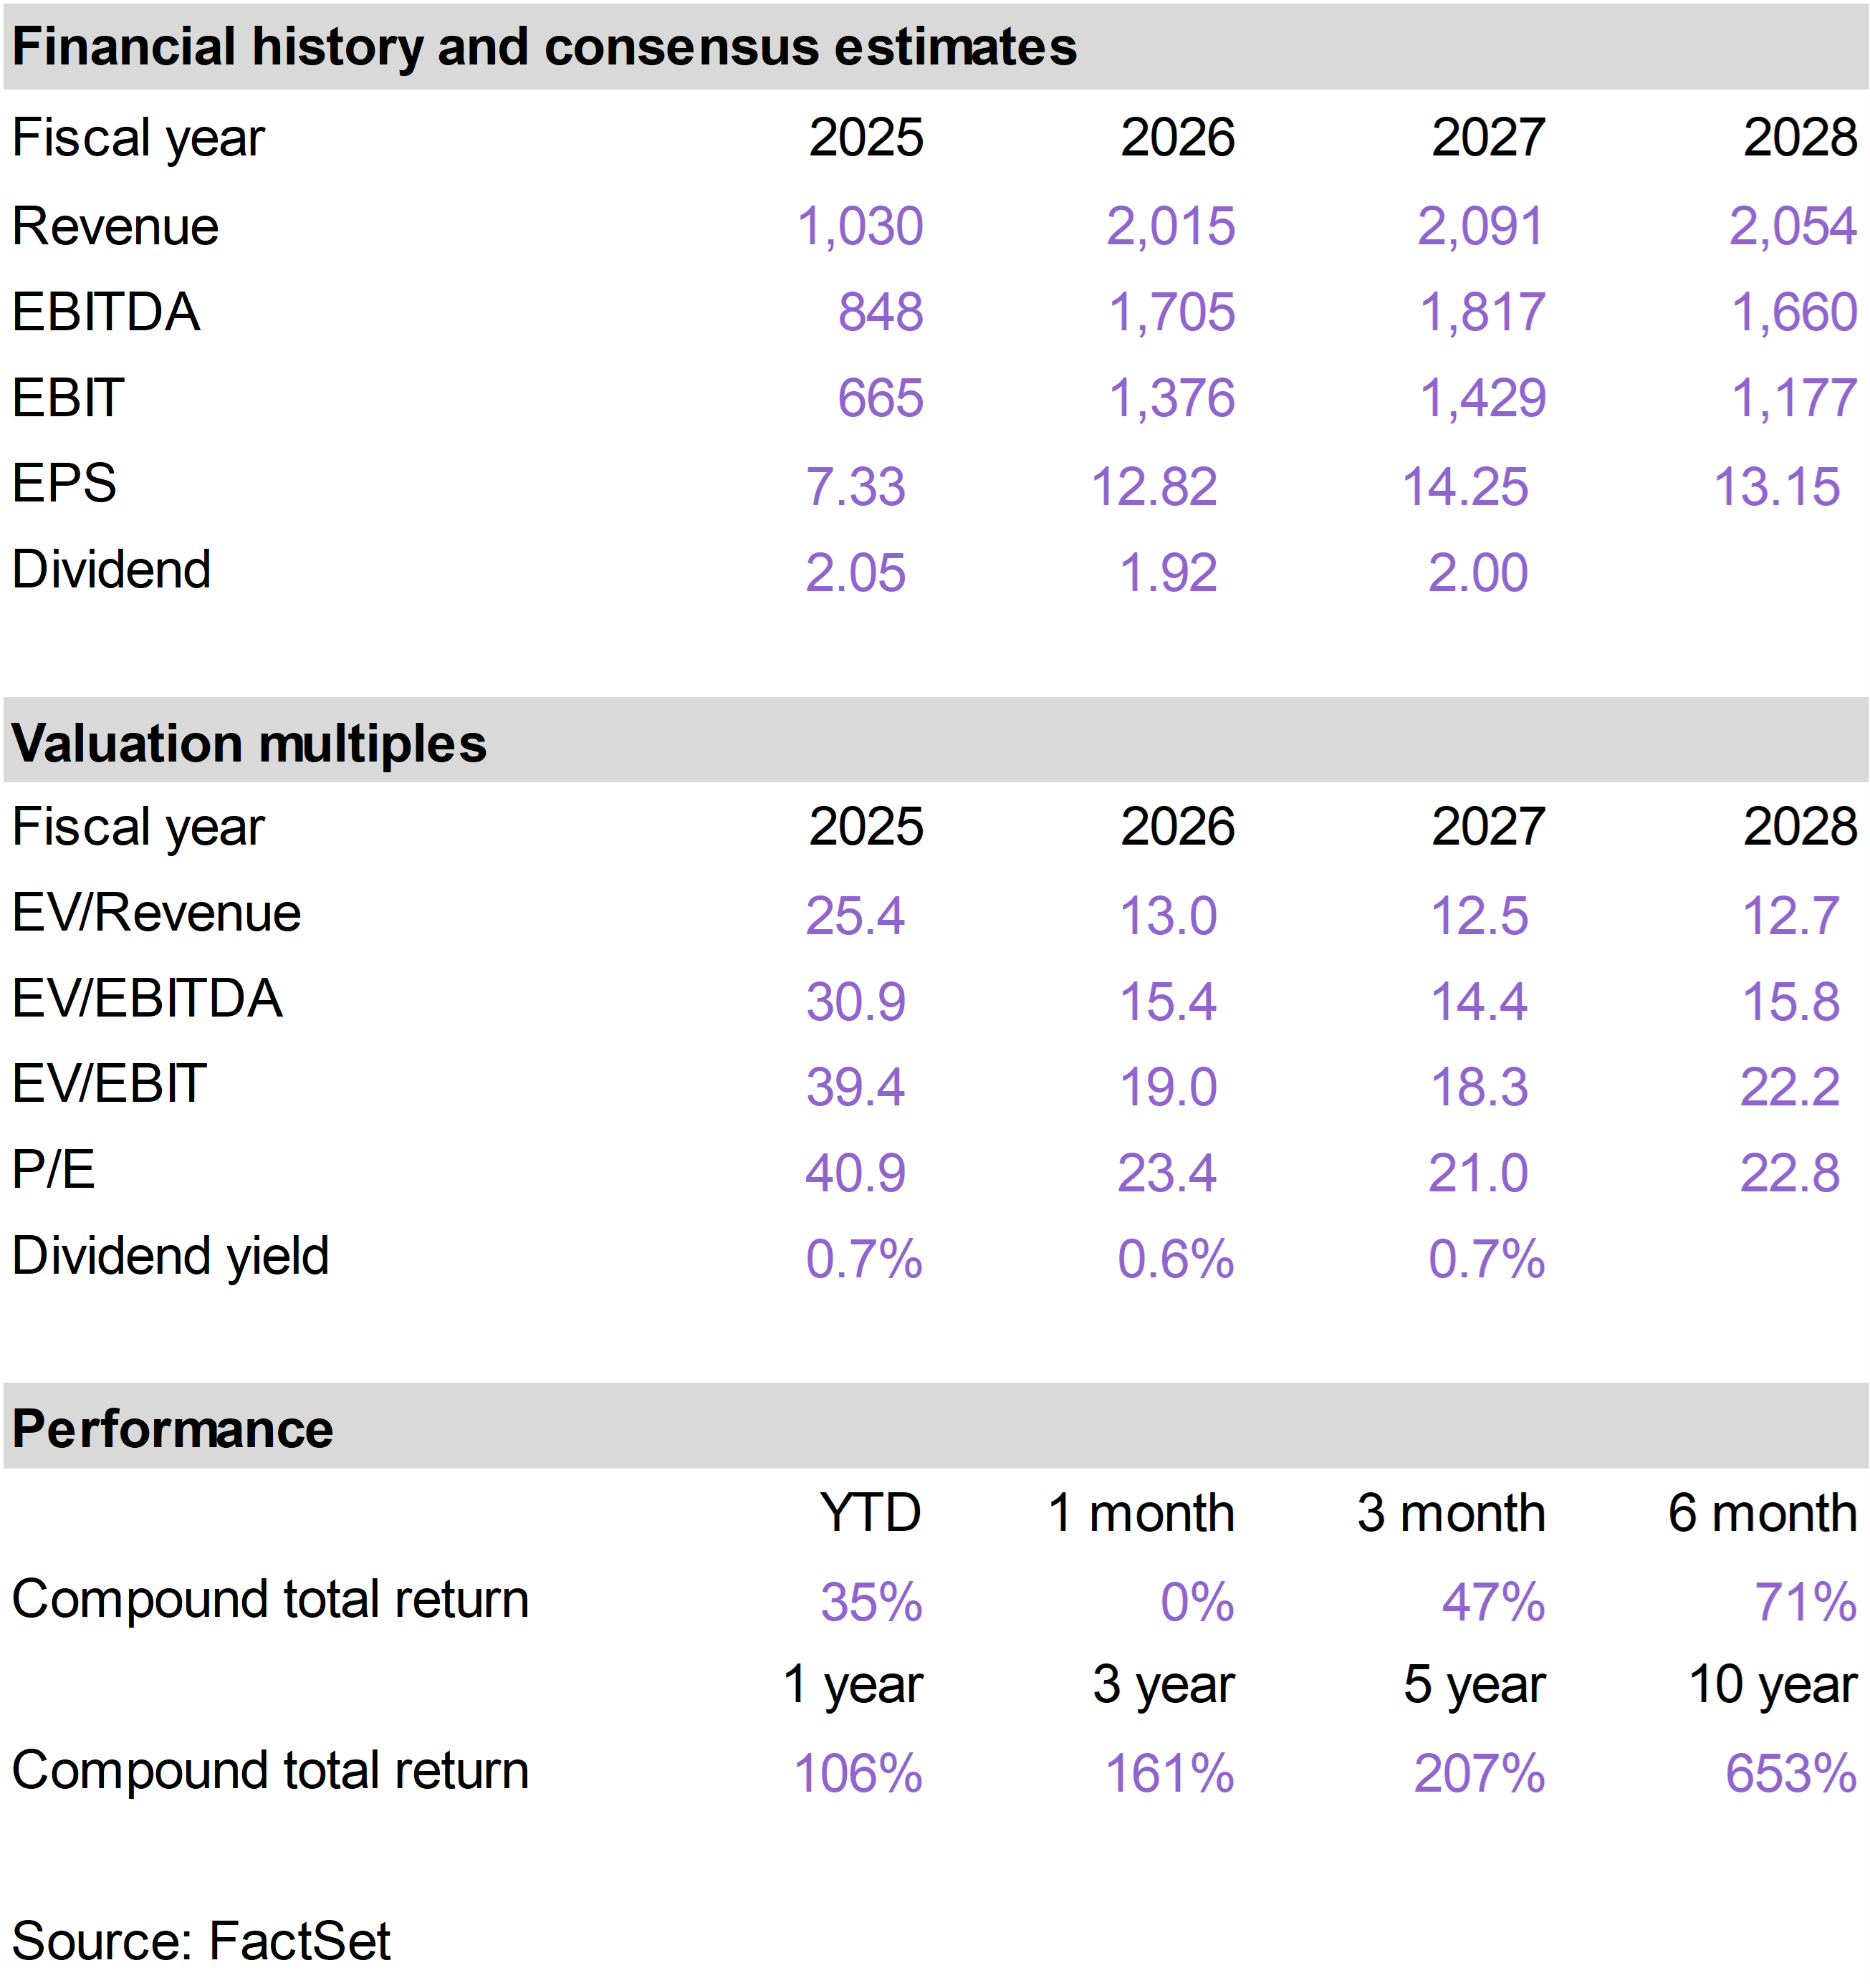
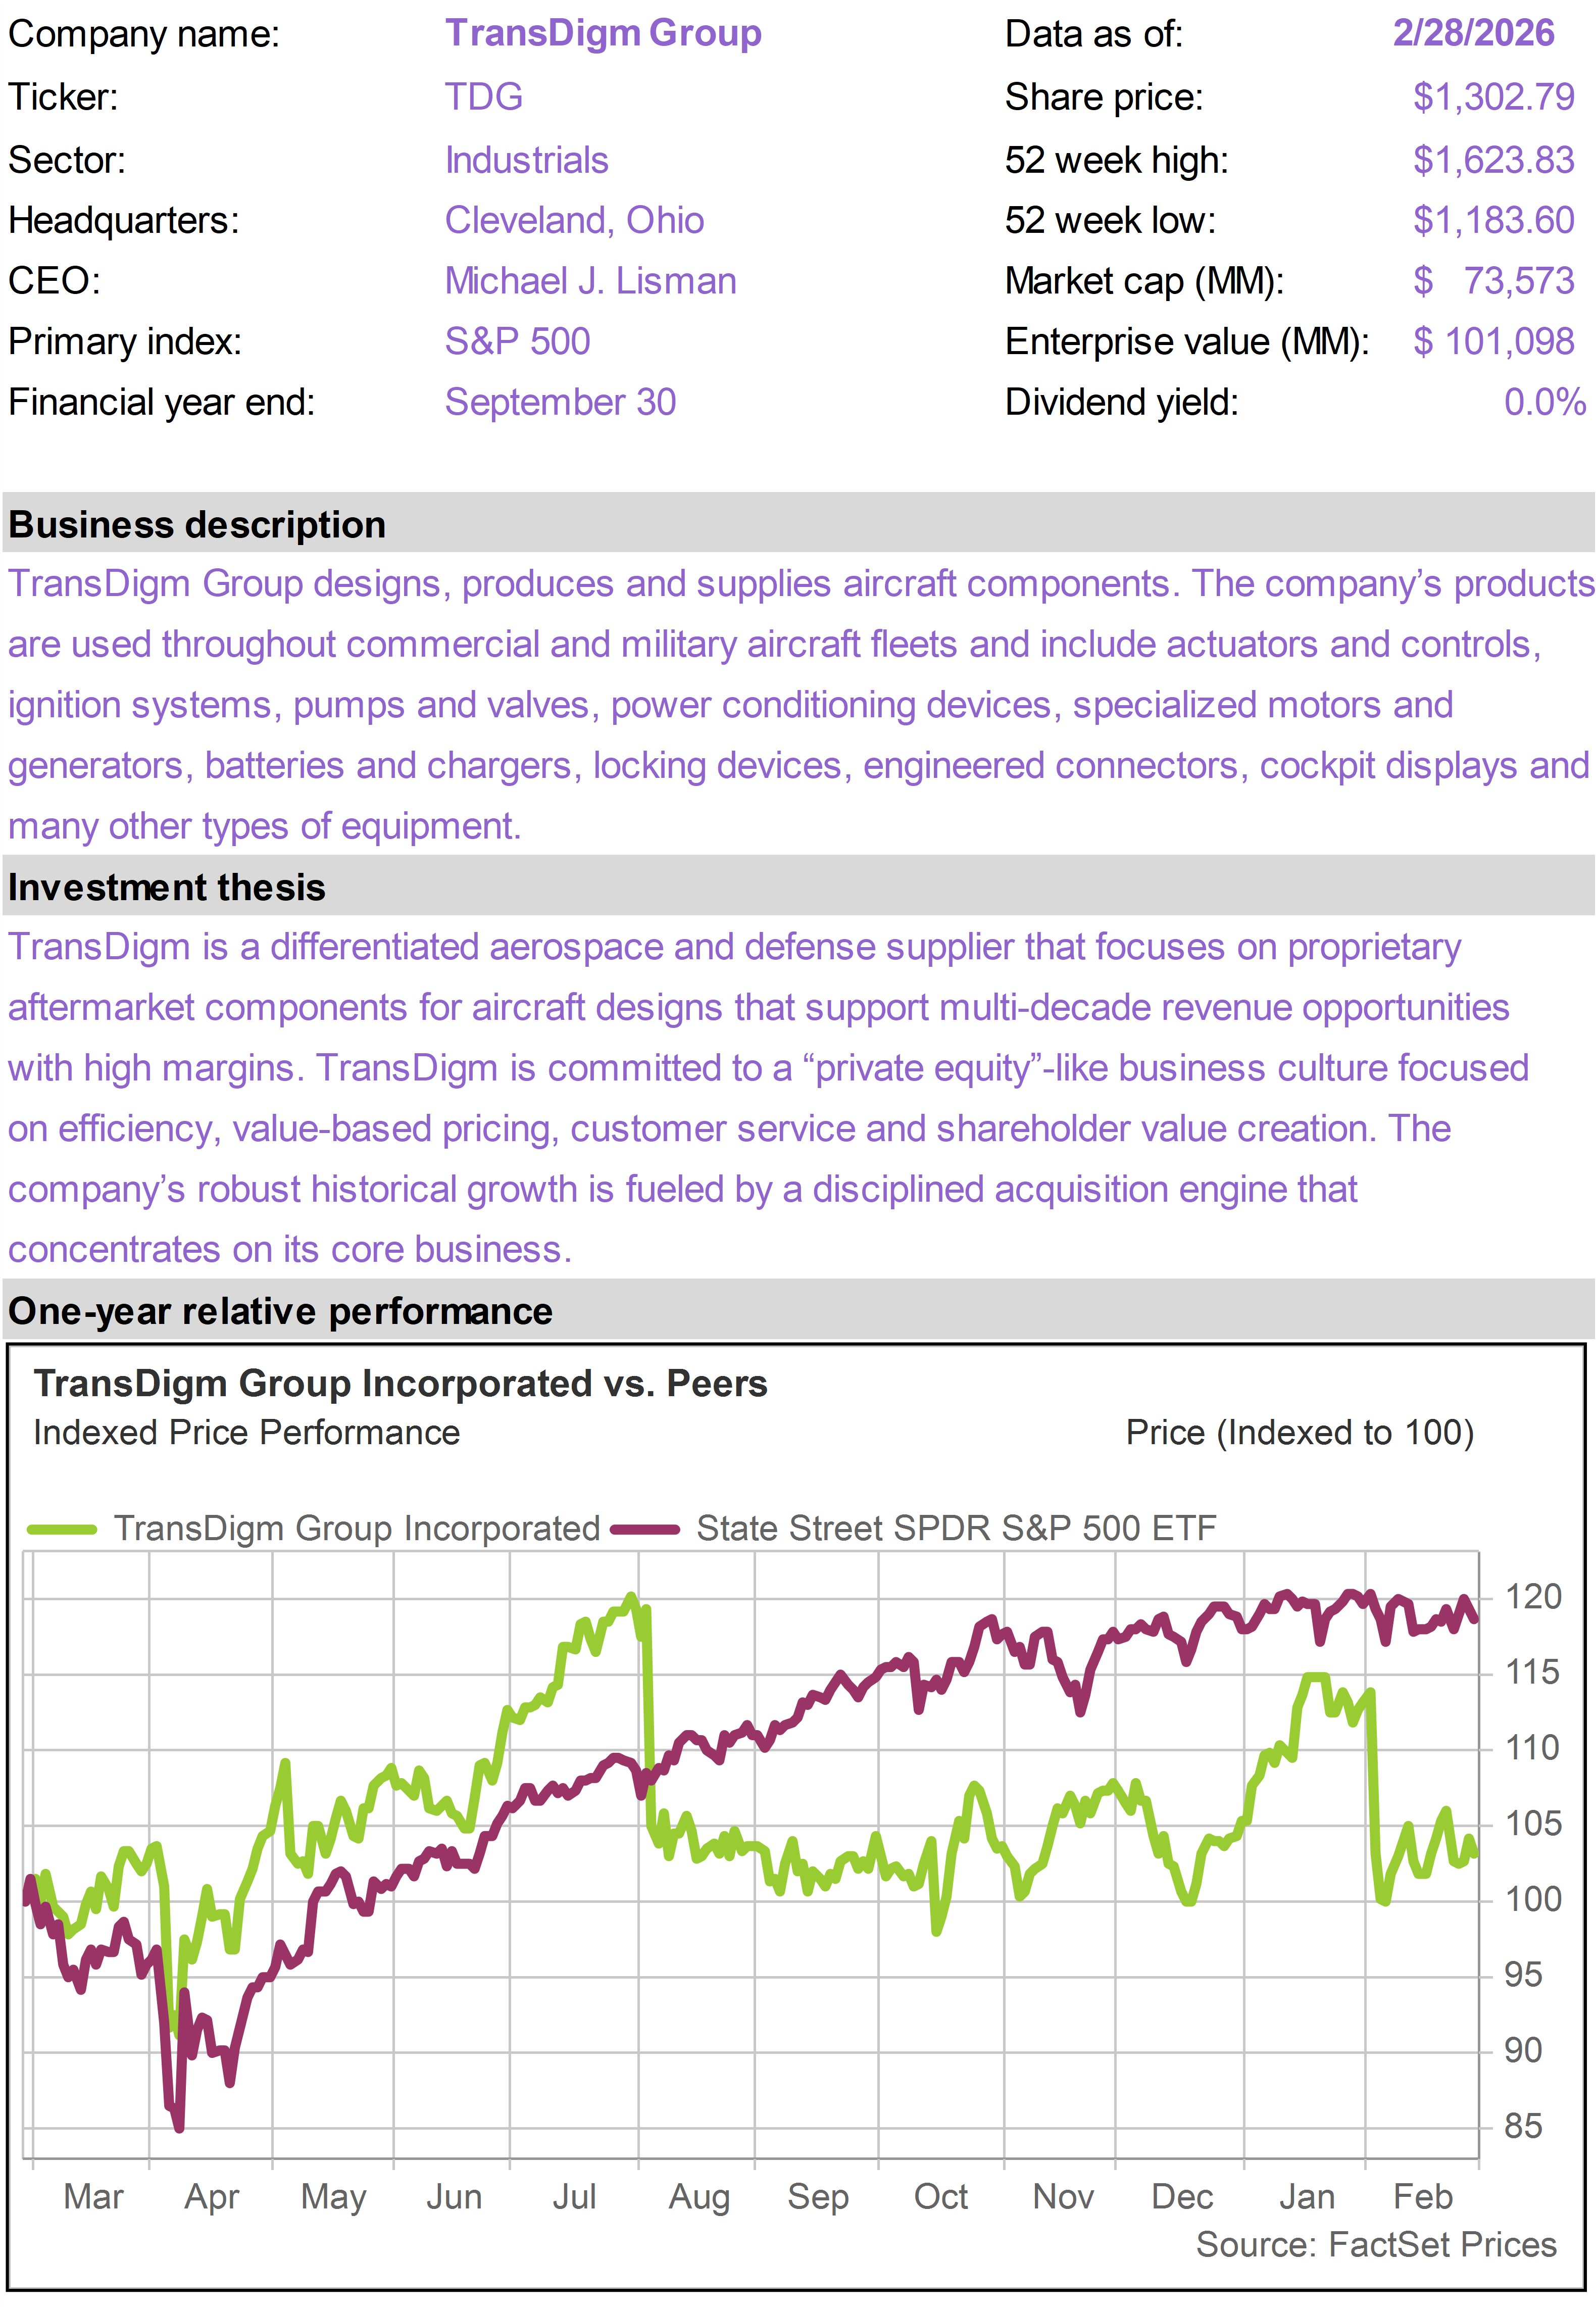
| Shares of TDG traded lower in February following the fourth quarter earnings results. Results were in-line with expectations but investors reacted negatively to what appears to be temporary deceleration in its commercial aftermarket segment.
Organic commercial aftermarket growth slowed to 7% in the quarter, down from double-digit growth previously, reflecting lumpy ordering patterns and mix dynamics rather than a deterioration in underlying demand.
At the same time, commercial OEM revenue accelerated meaningfully, up 17% organically. Management raised full-year revenue, EBITDA, and EPS guidance, signaling confidence in the broader trajectory of the business, and reiterated its long-term playbook: proprietary parts, meaningful aftermarket exposure, disciplined pricing, and consistent cash generation.
As a reminder, we reduced the portfolio allocation to TDG from 10% to 5% when we added CRCL to the portfolio on 2/10/2026. |
|
| | |
| | |
| | |
| | | |
|
| | |
|
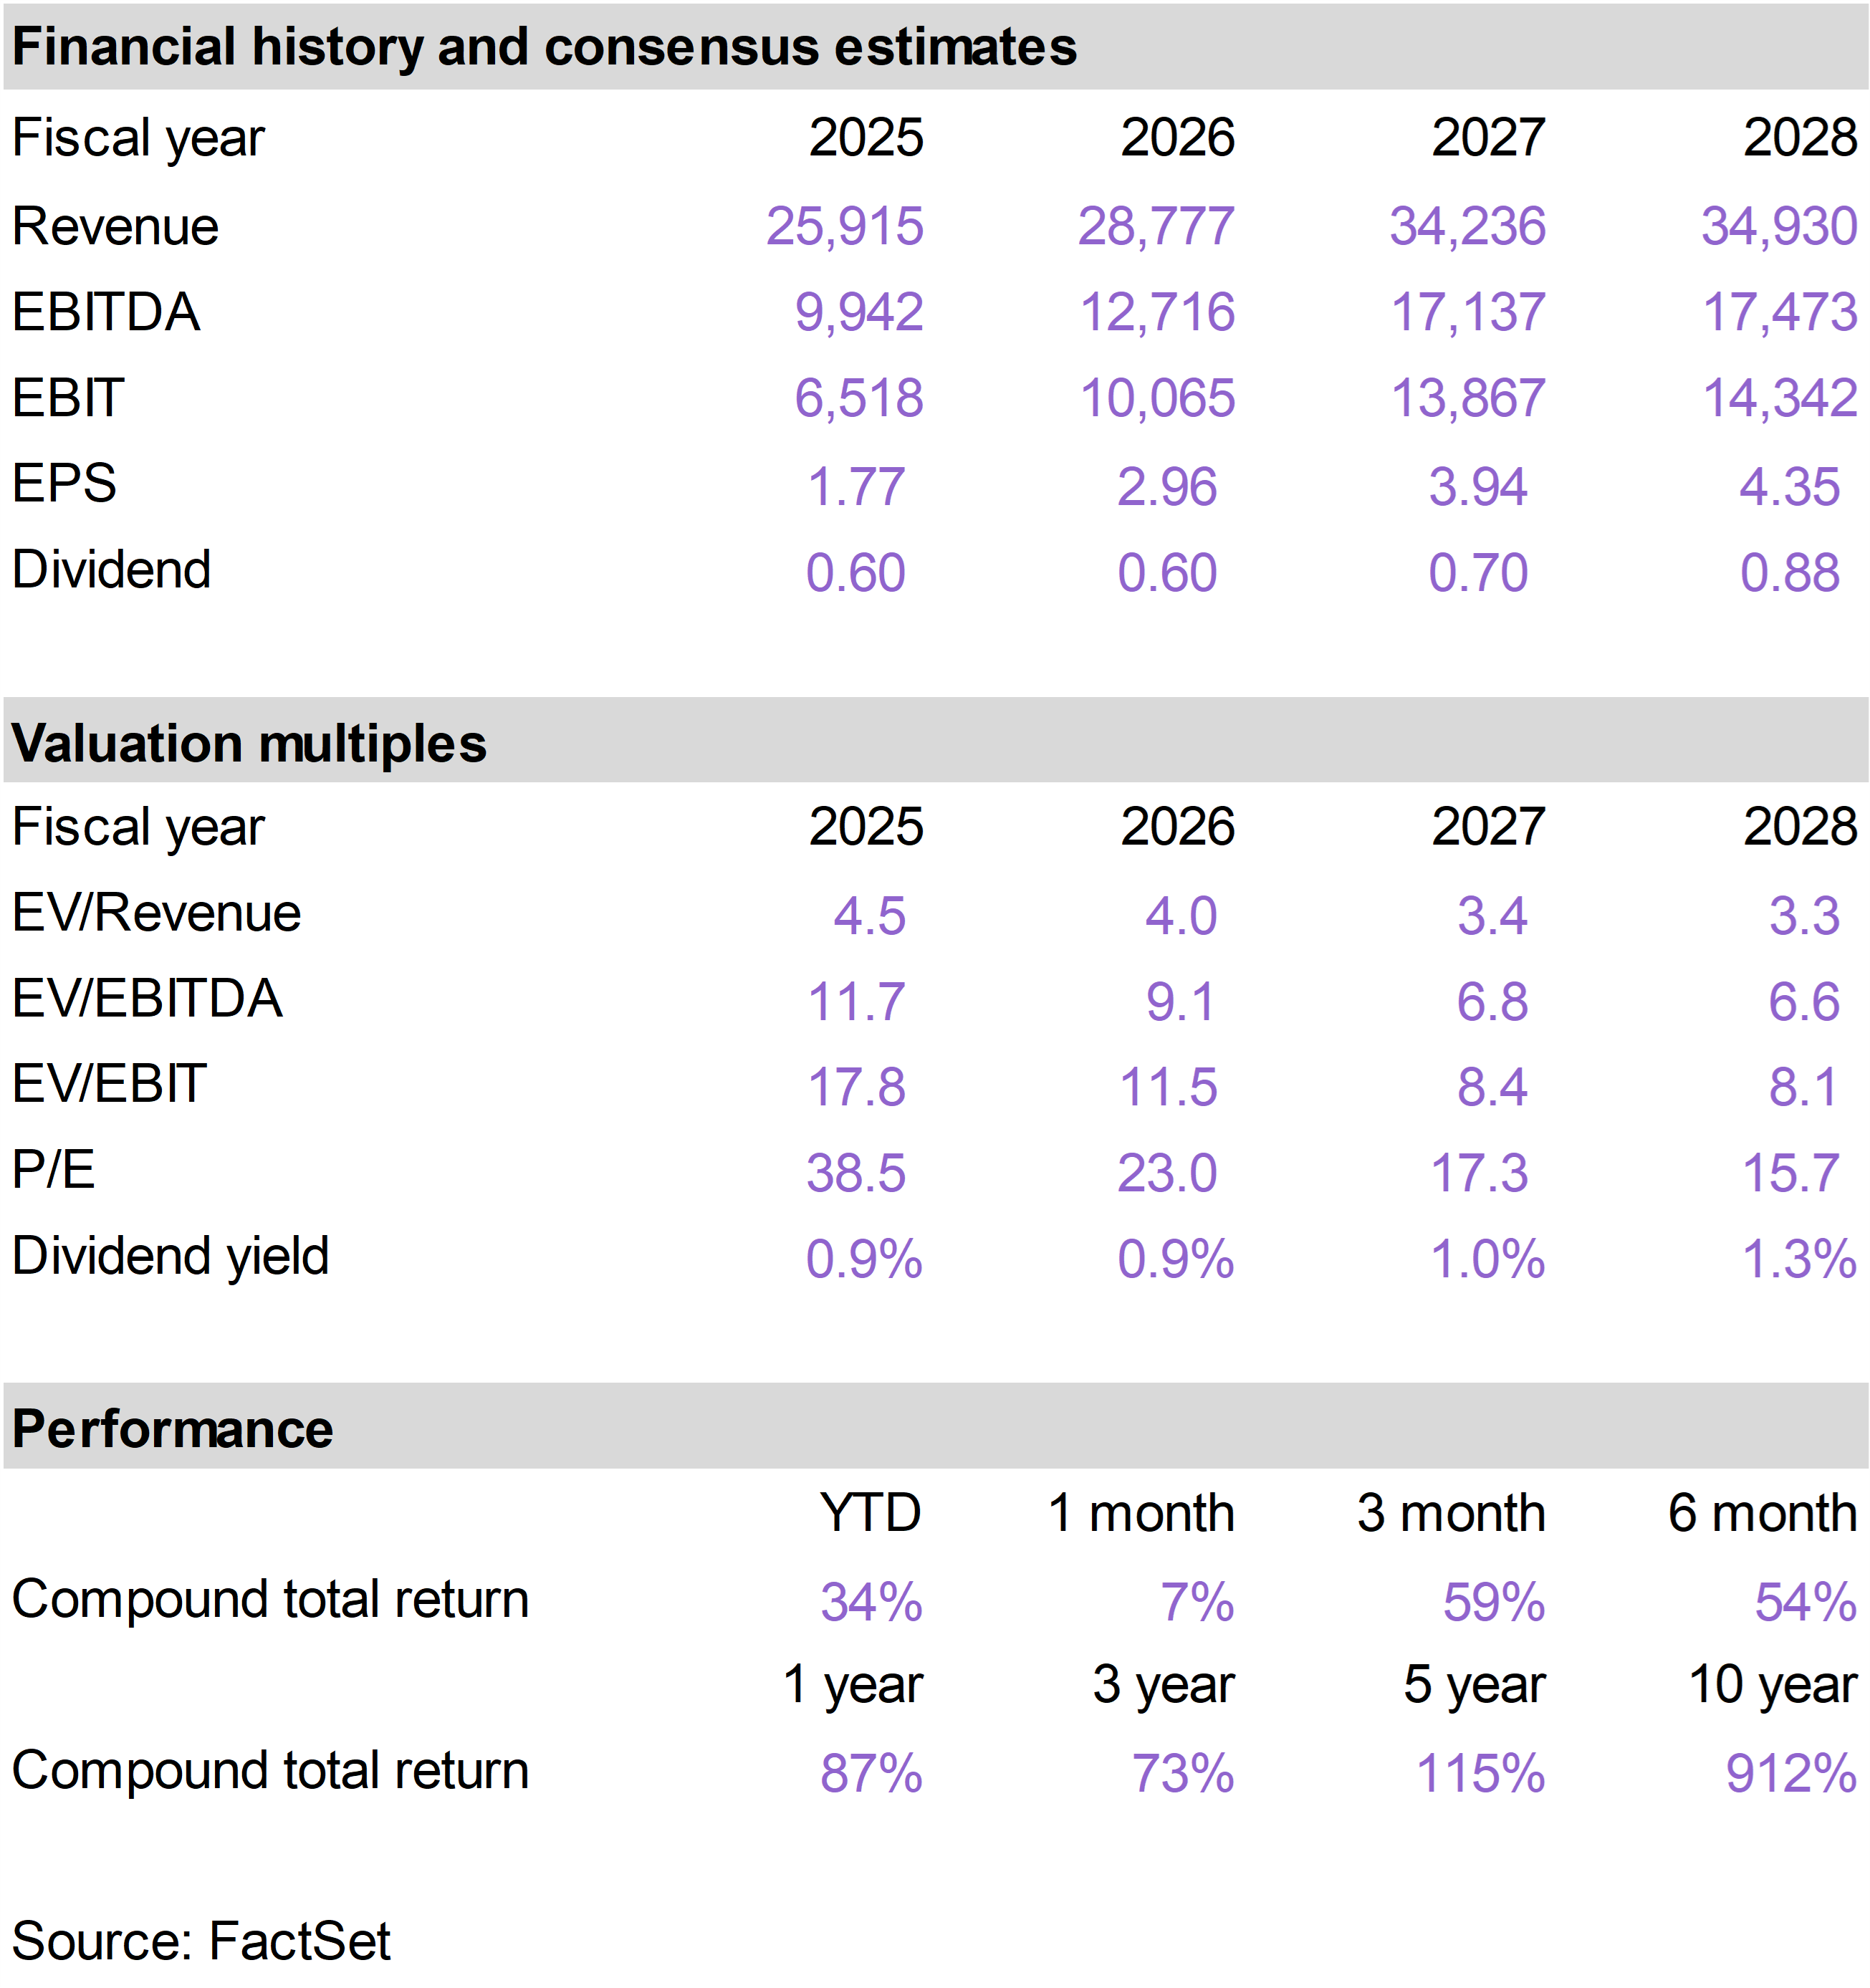
| | Mid-America Apartment (MAA) |
|
|
|
| | |
|
| | |
|
| | |
|
| | Circle Internet Group (CRCL) |
|
|
|
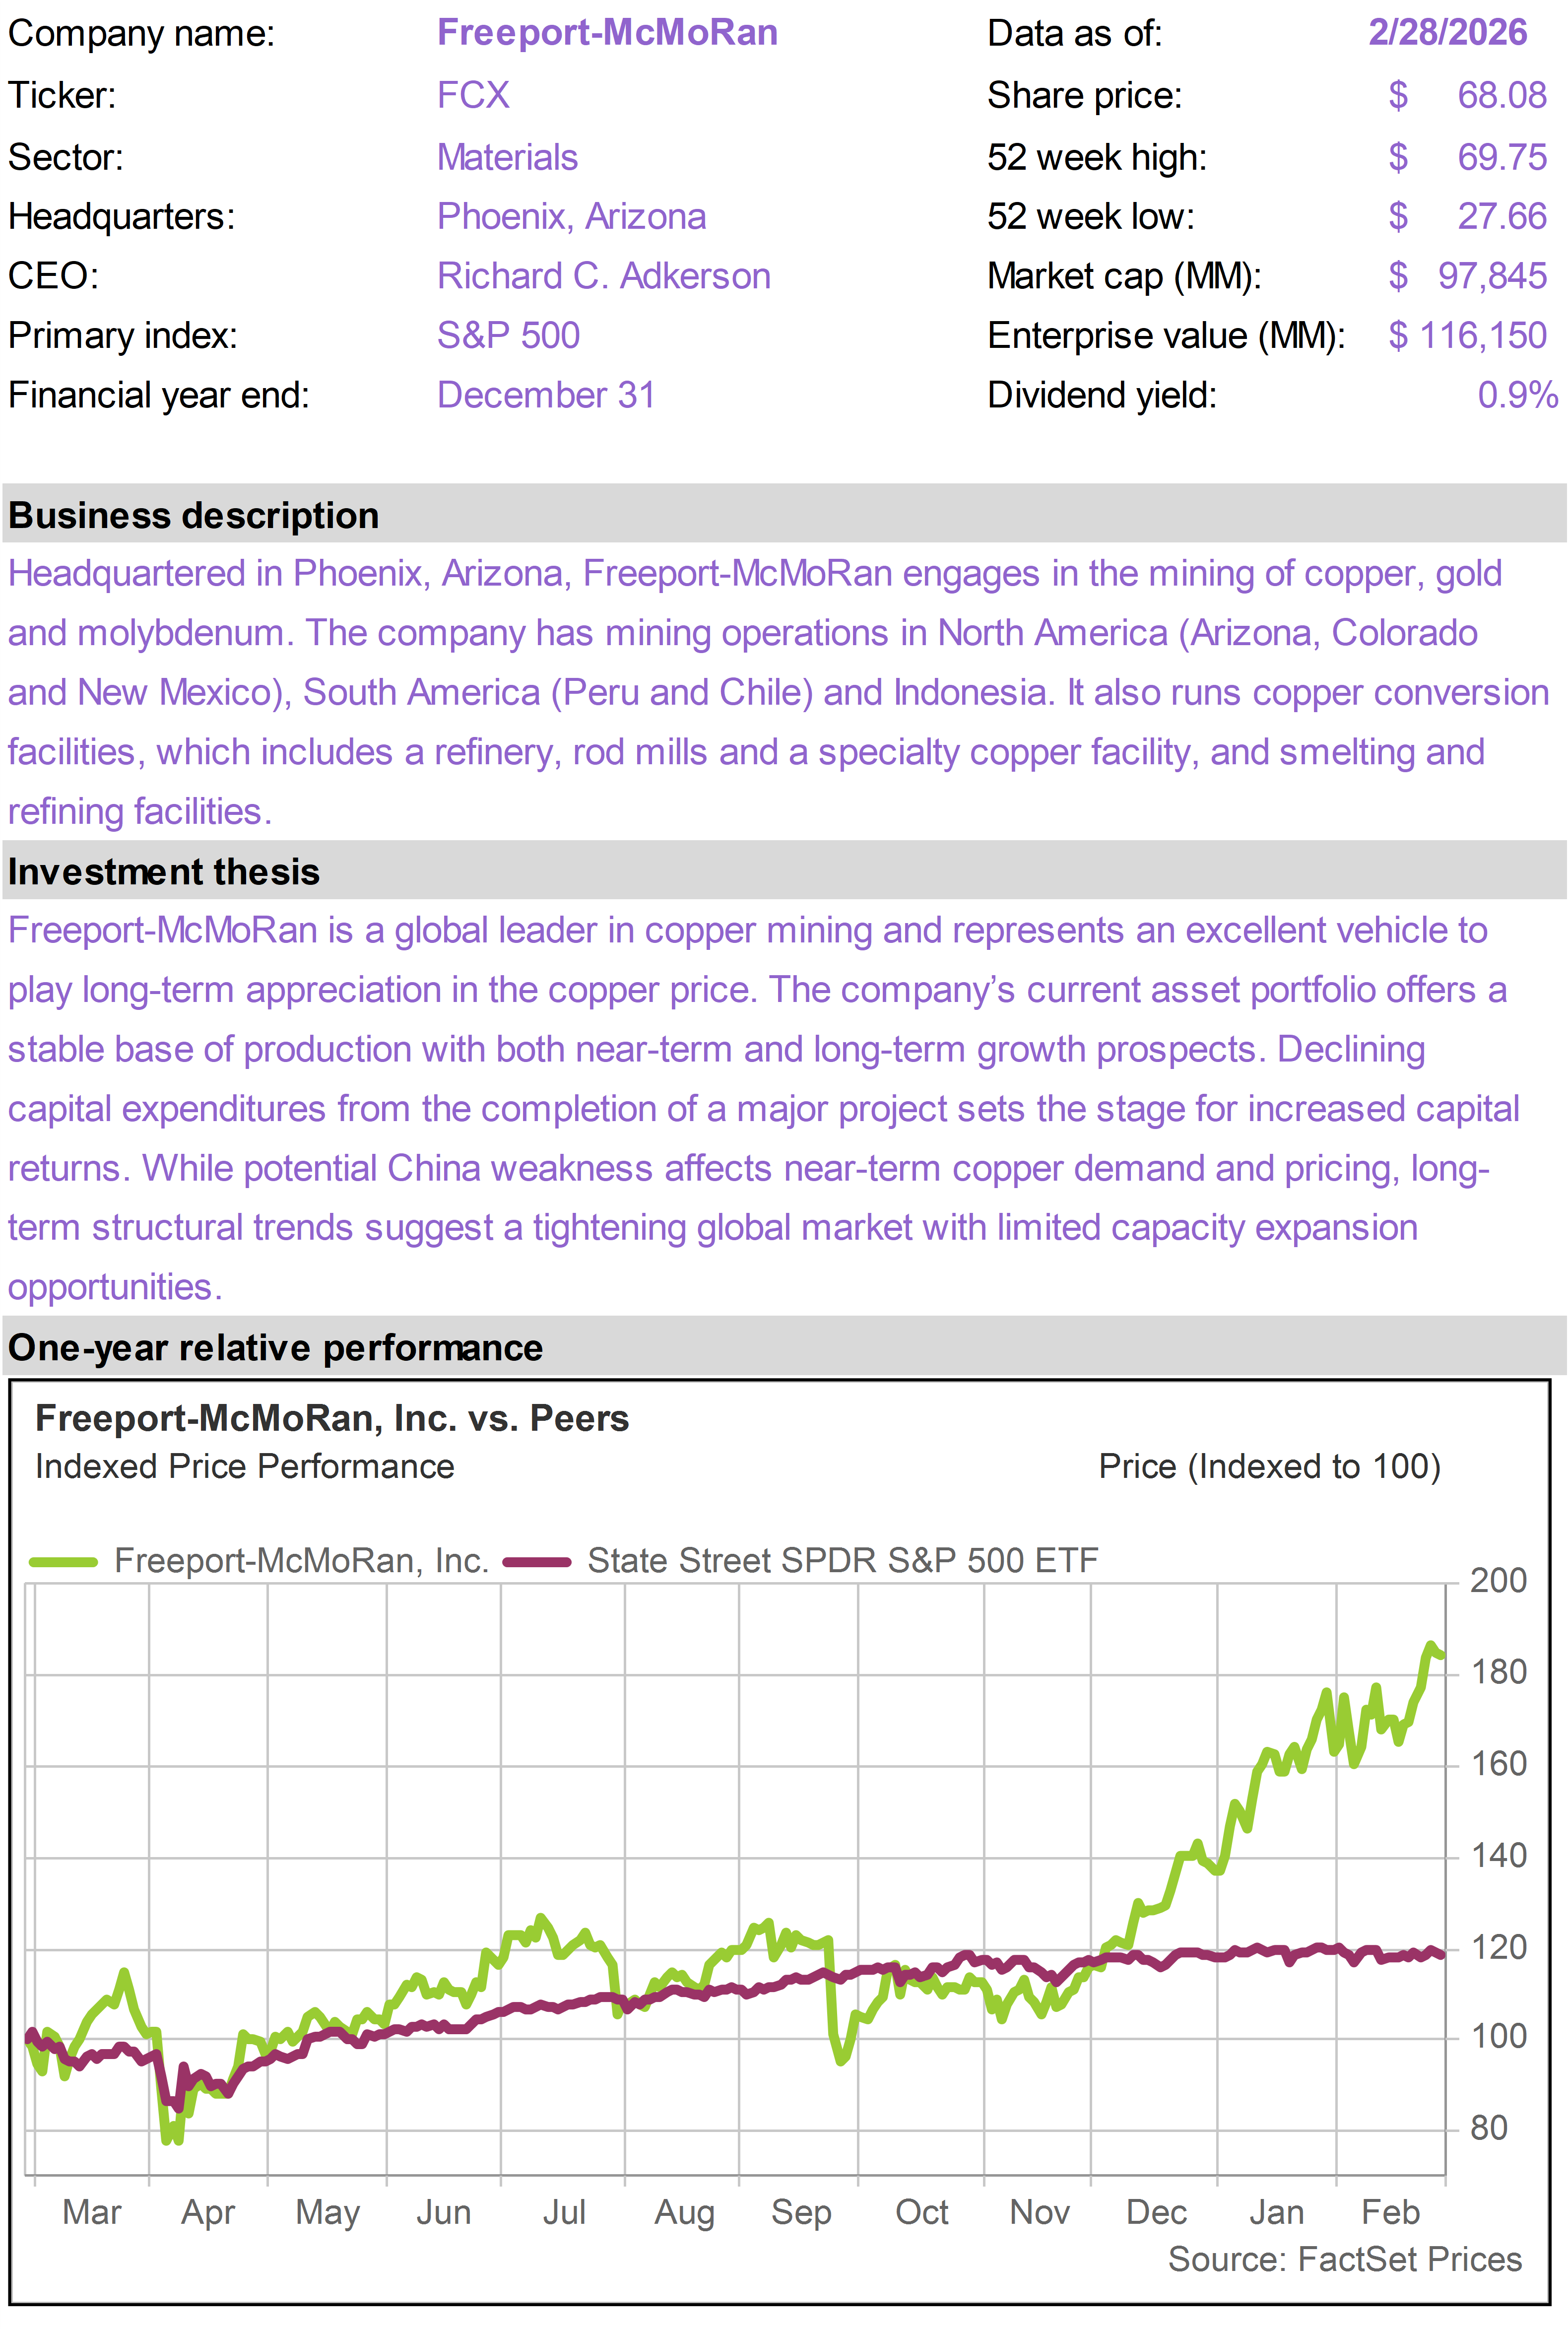
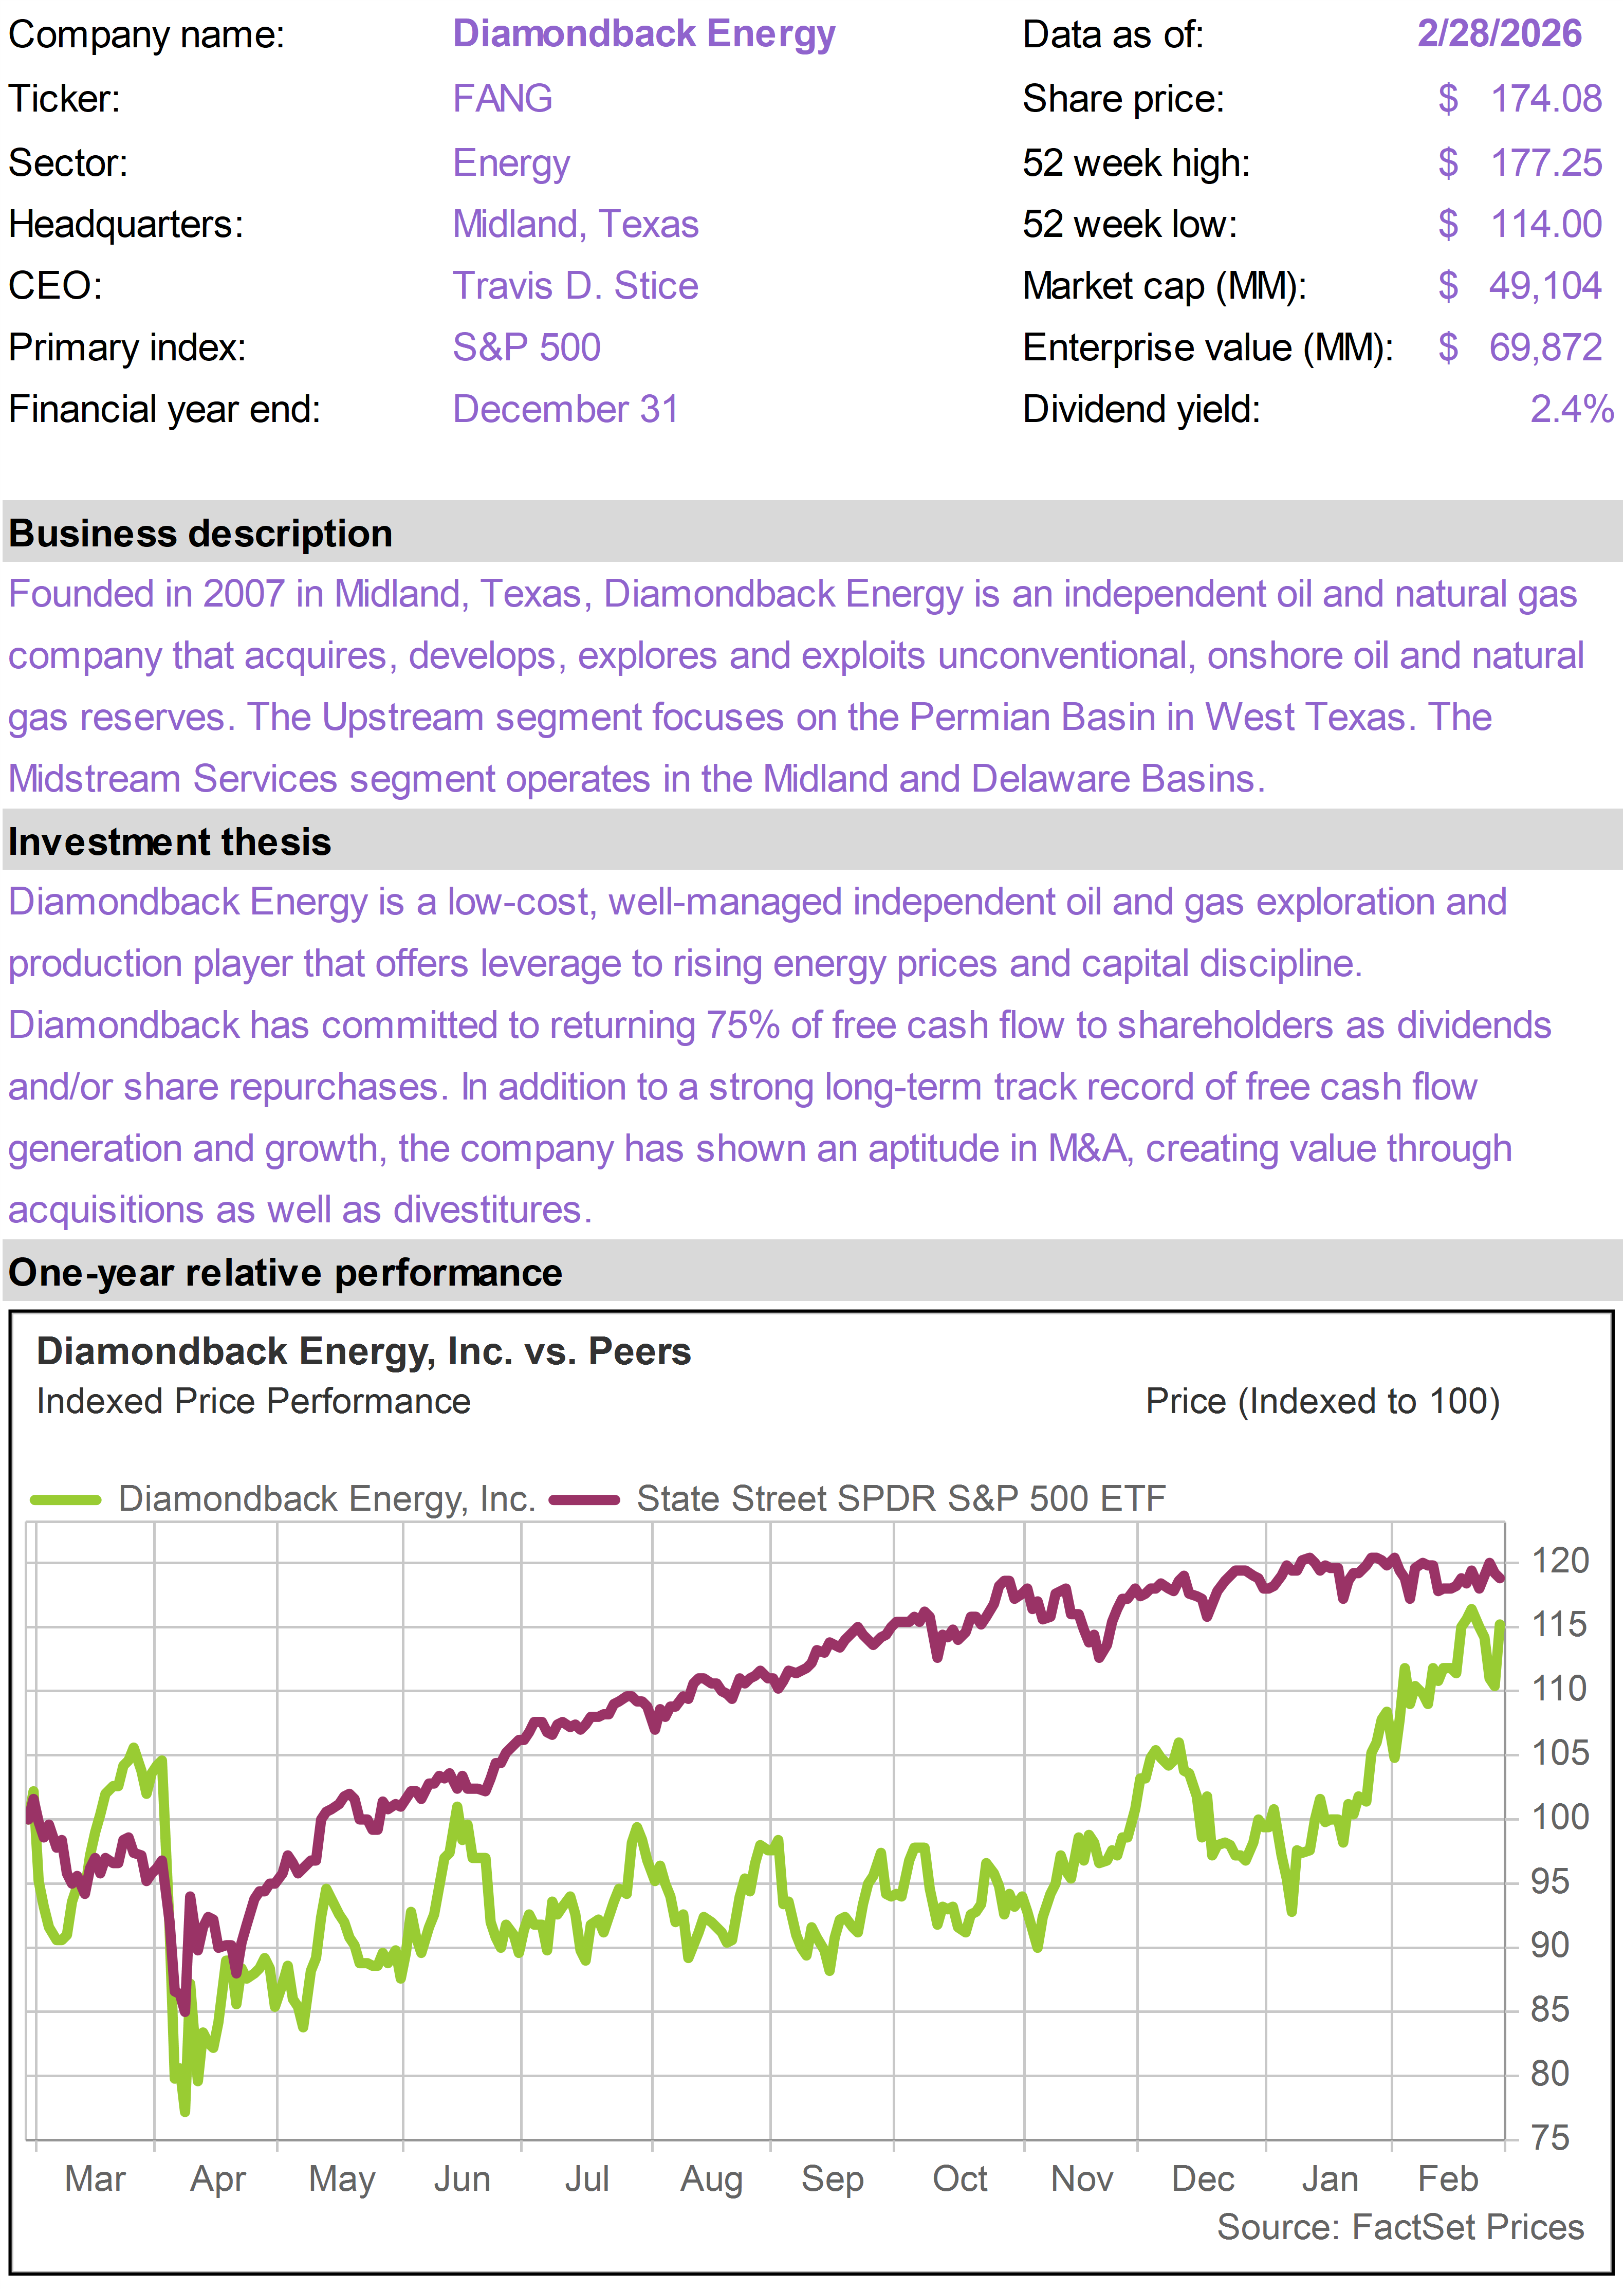
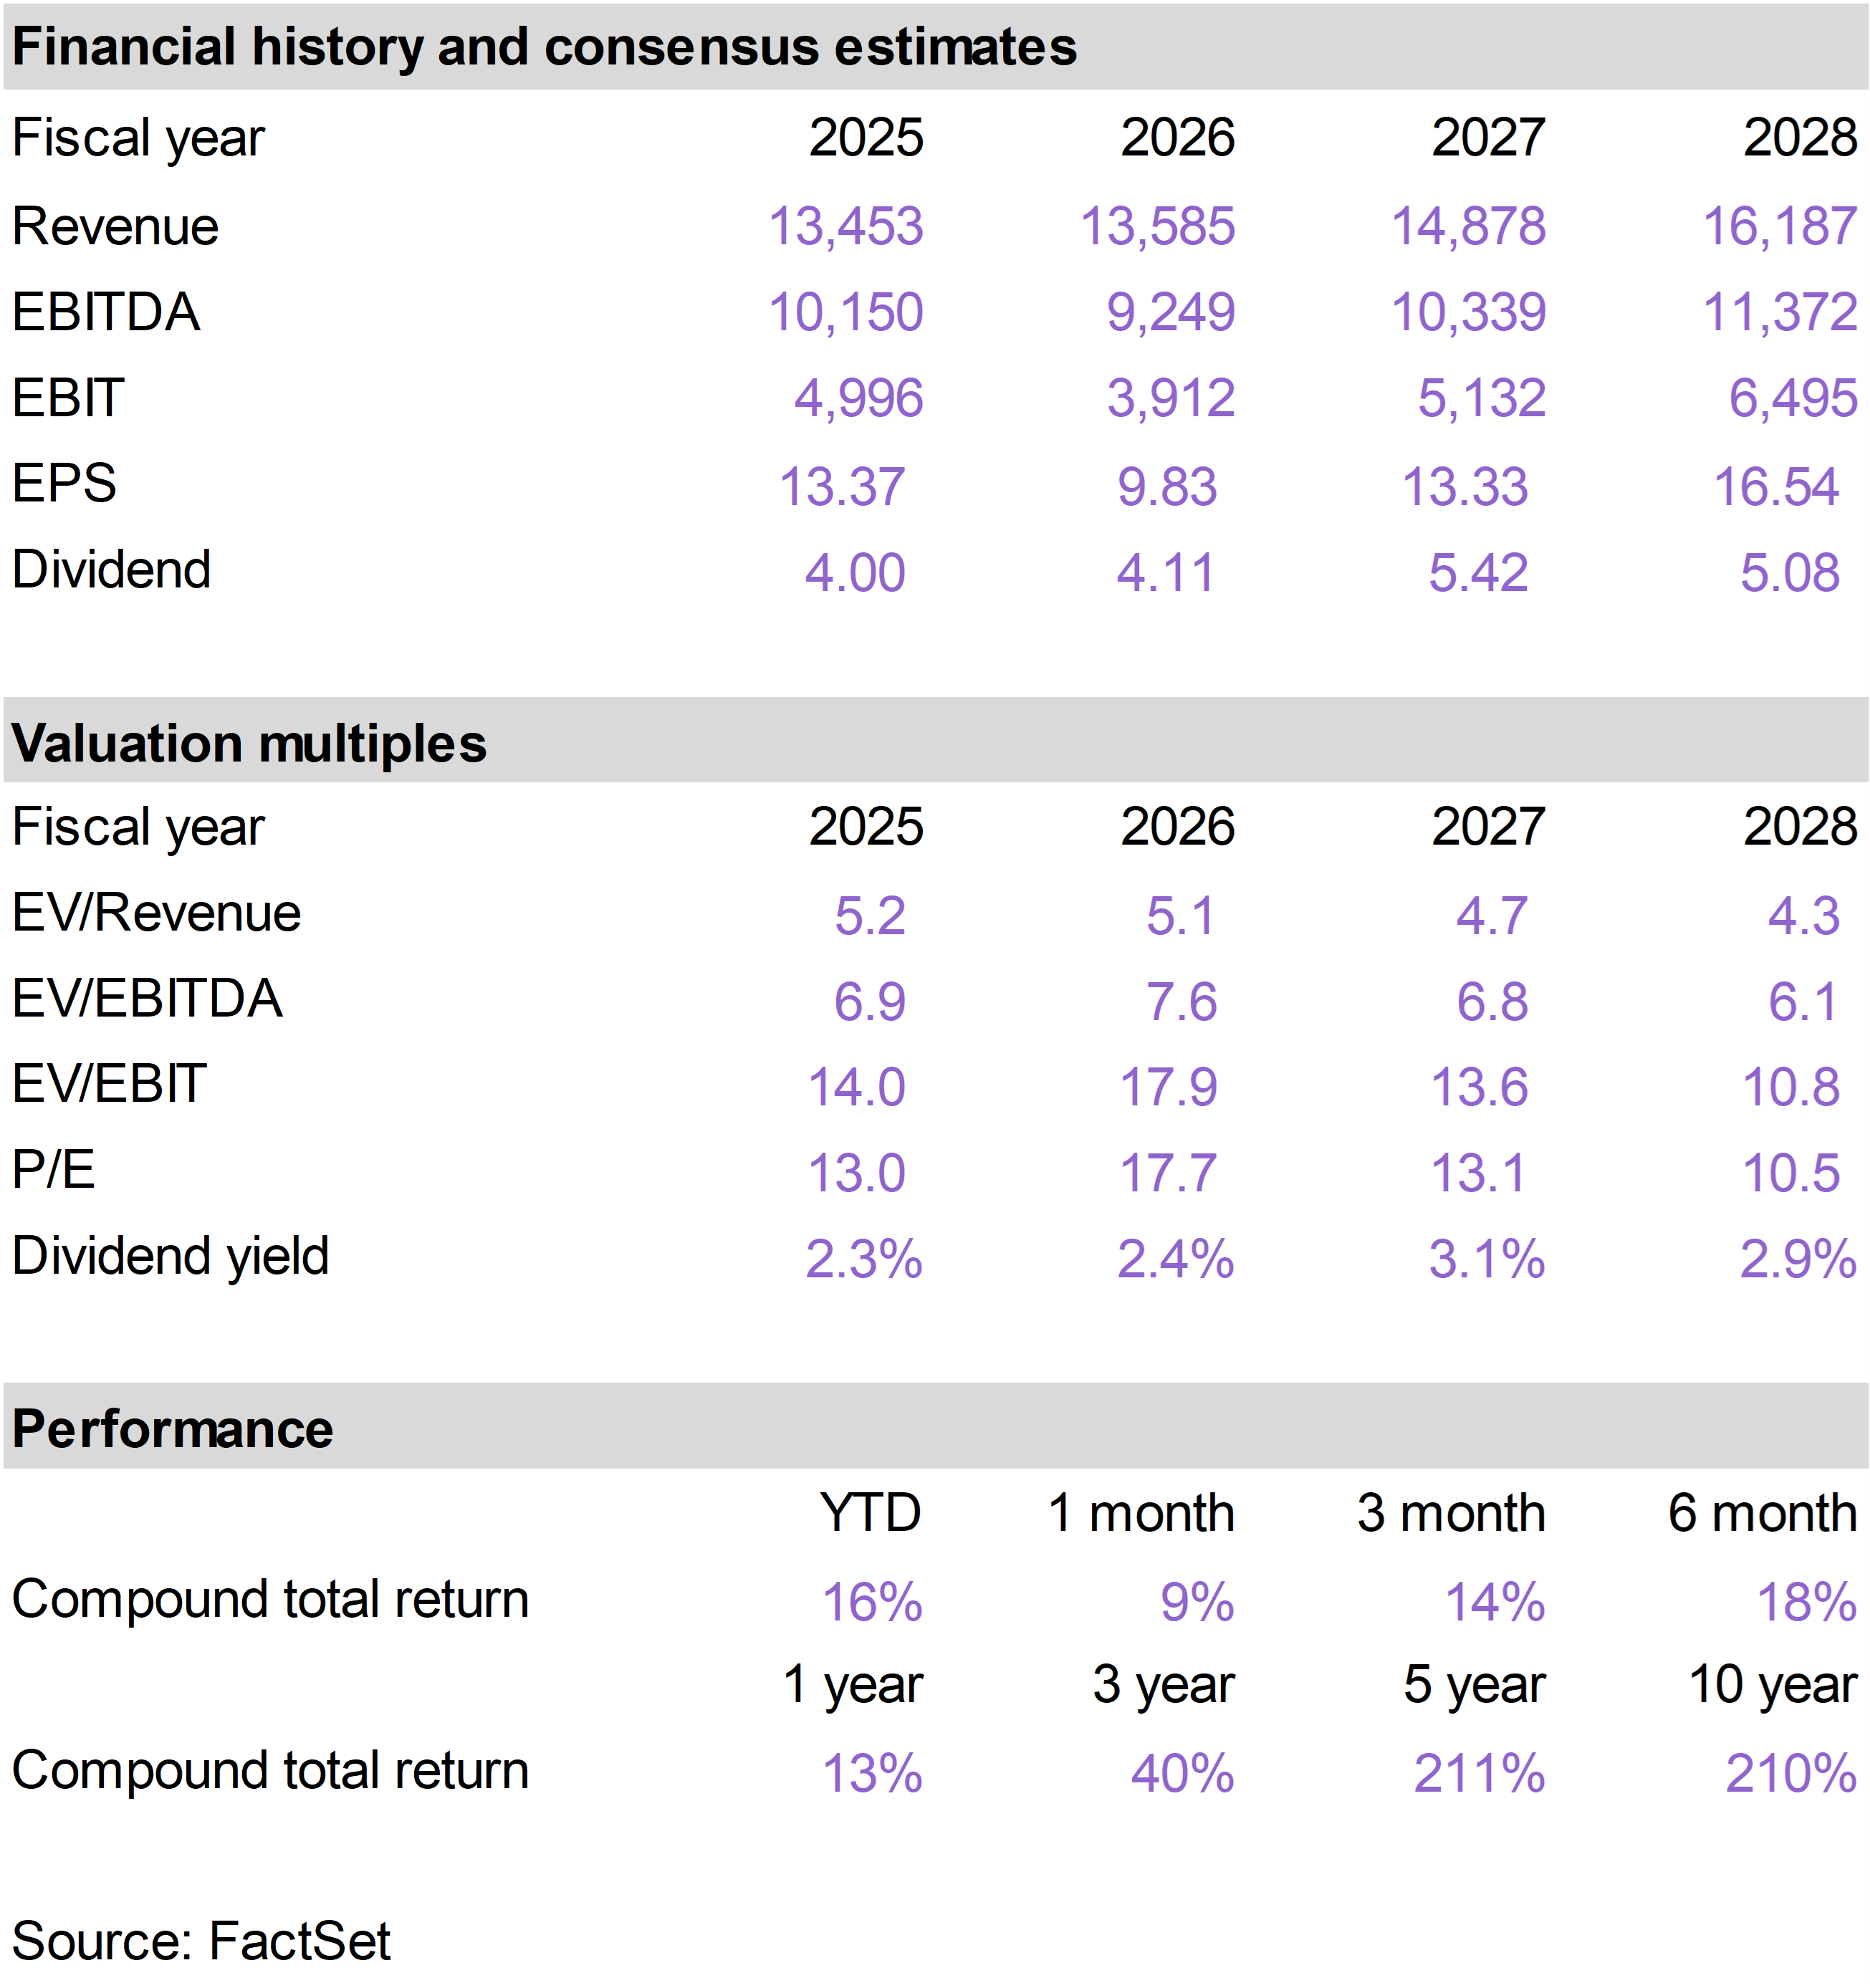
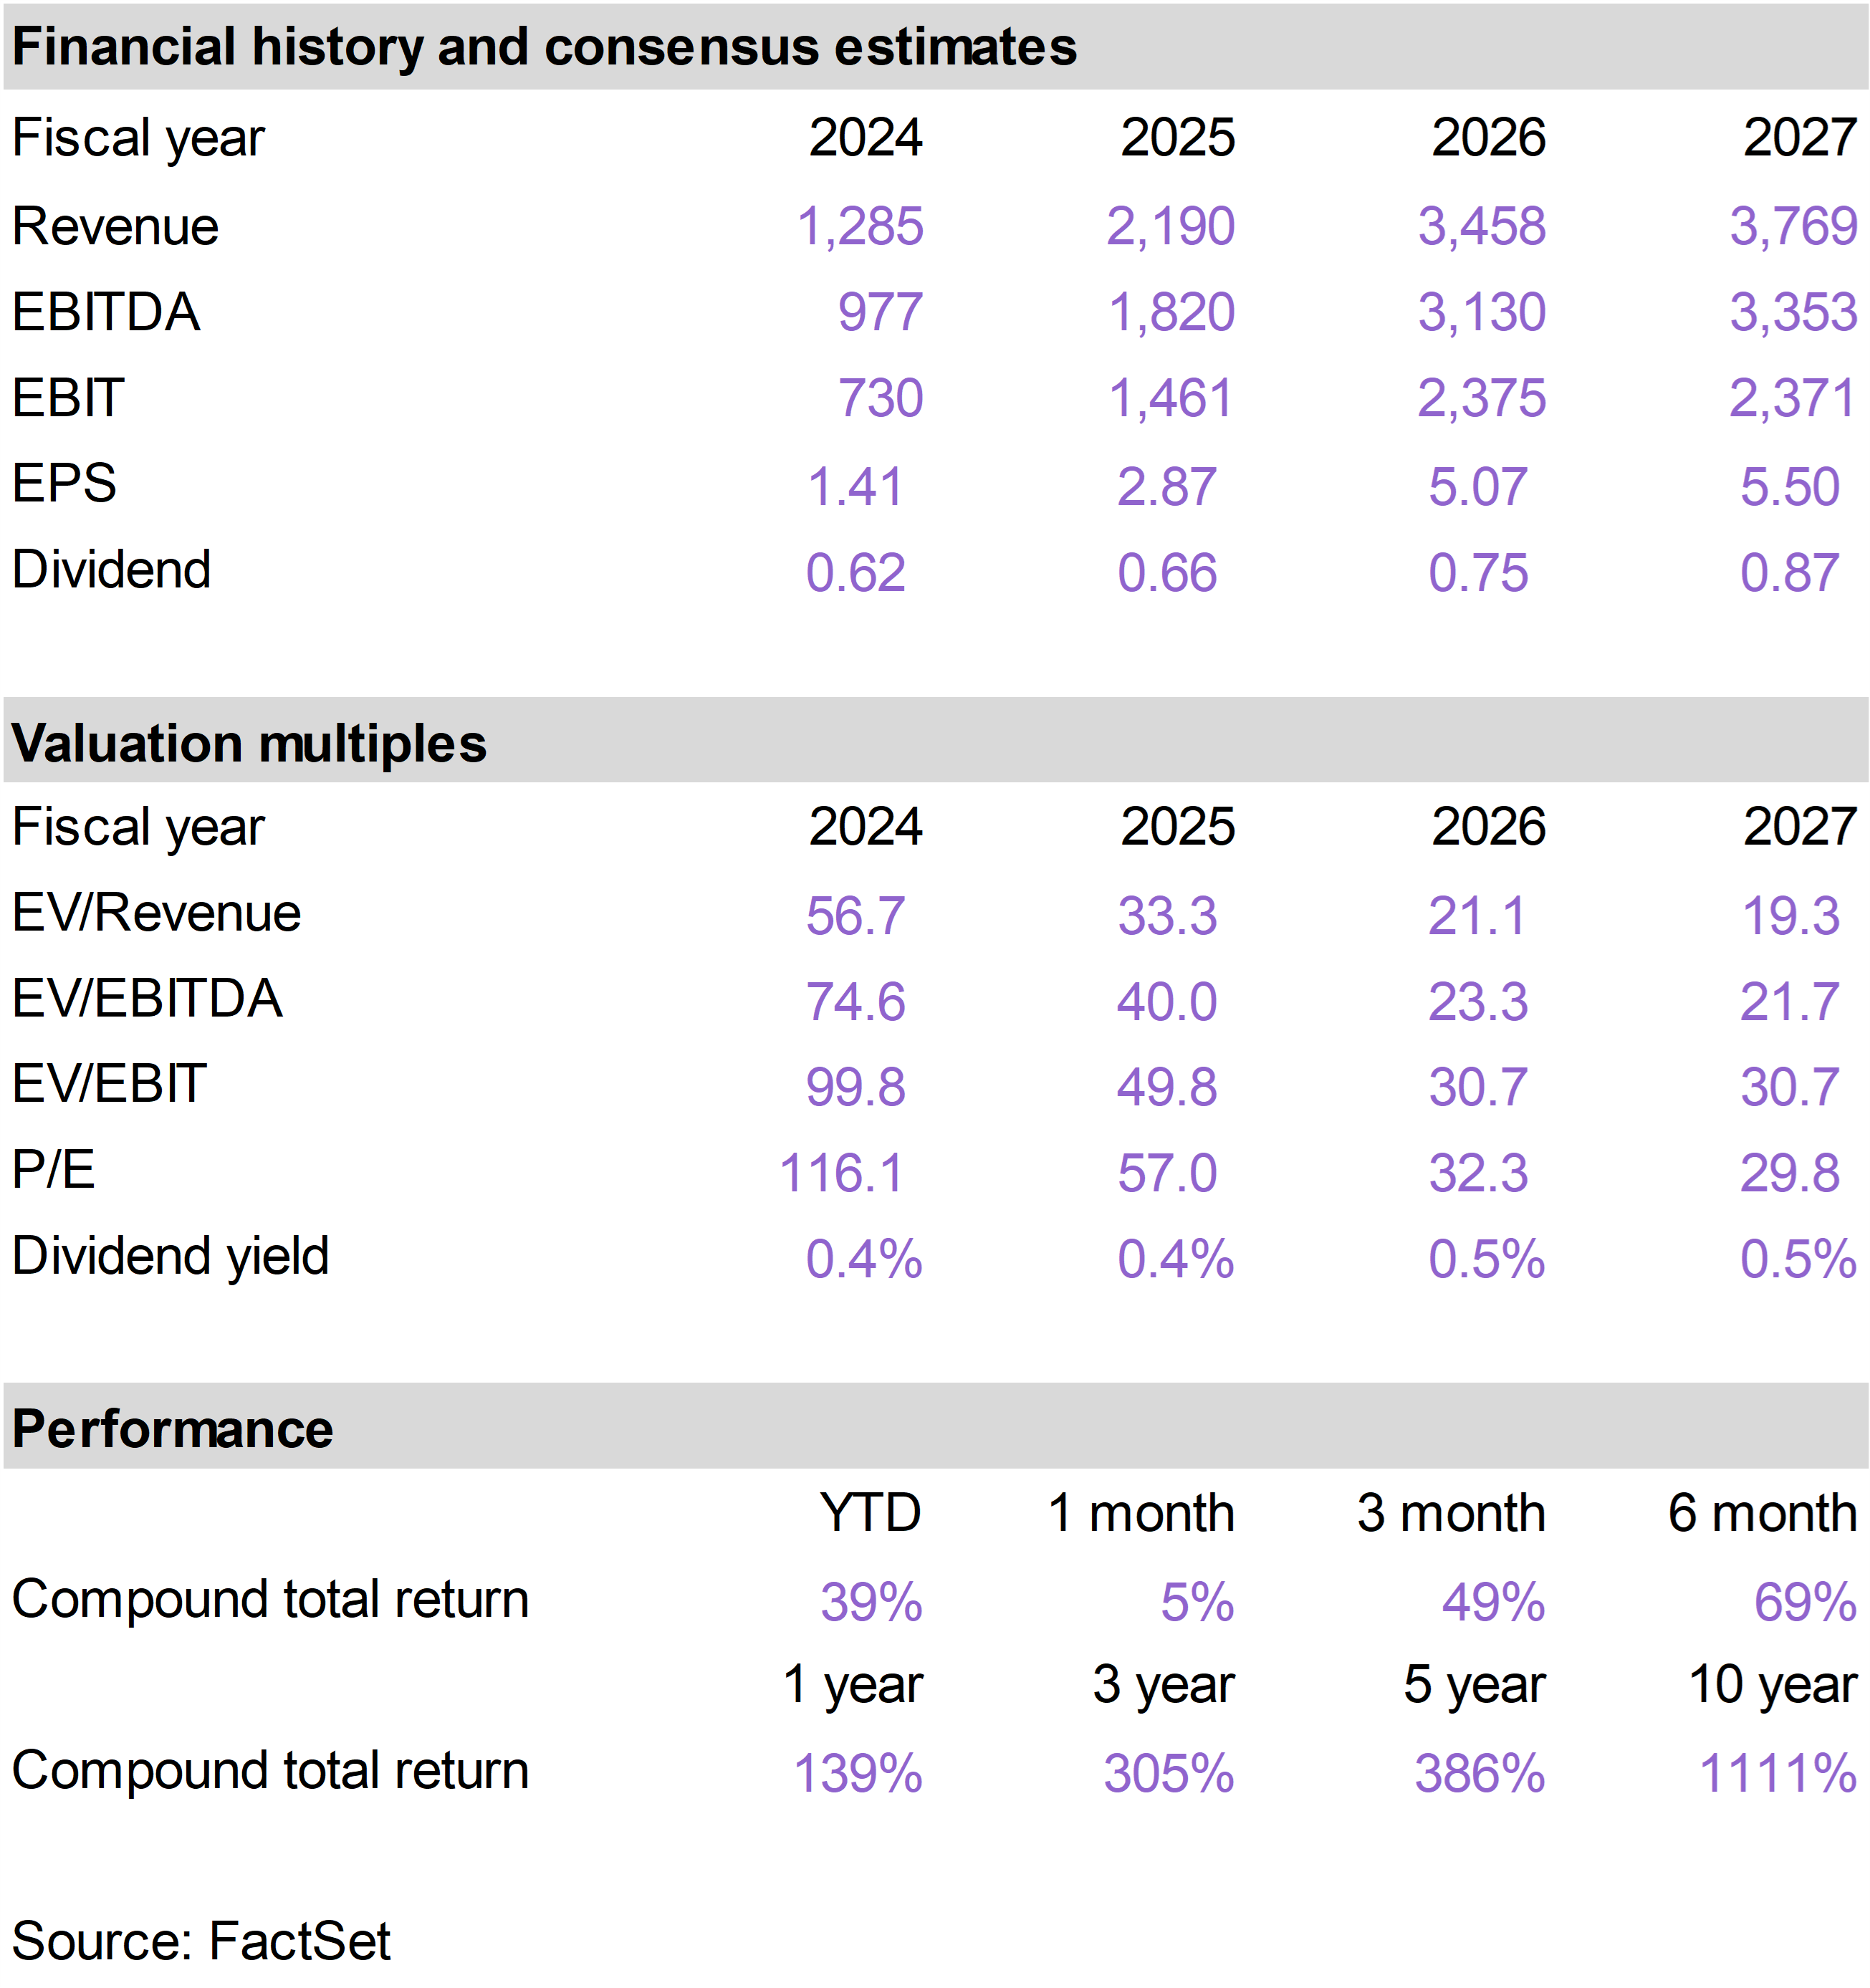
| | Diamondback Energy (FANG) |
|
|
|
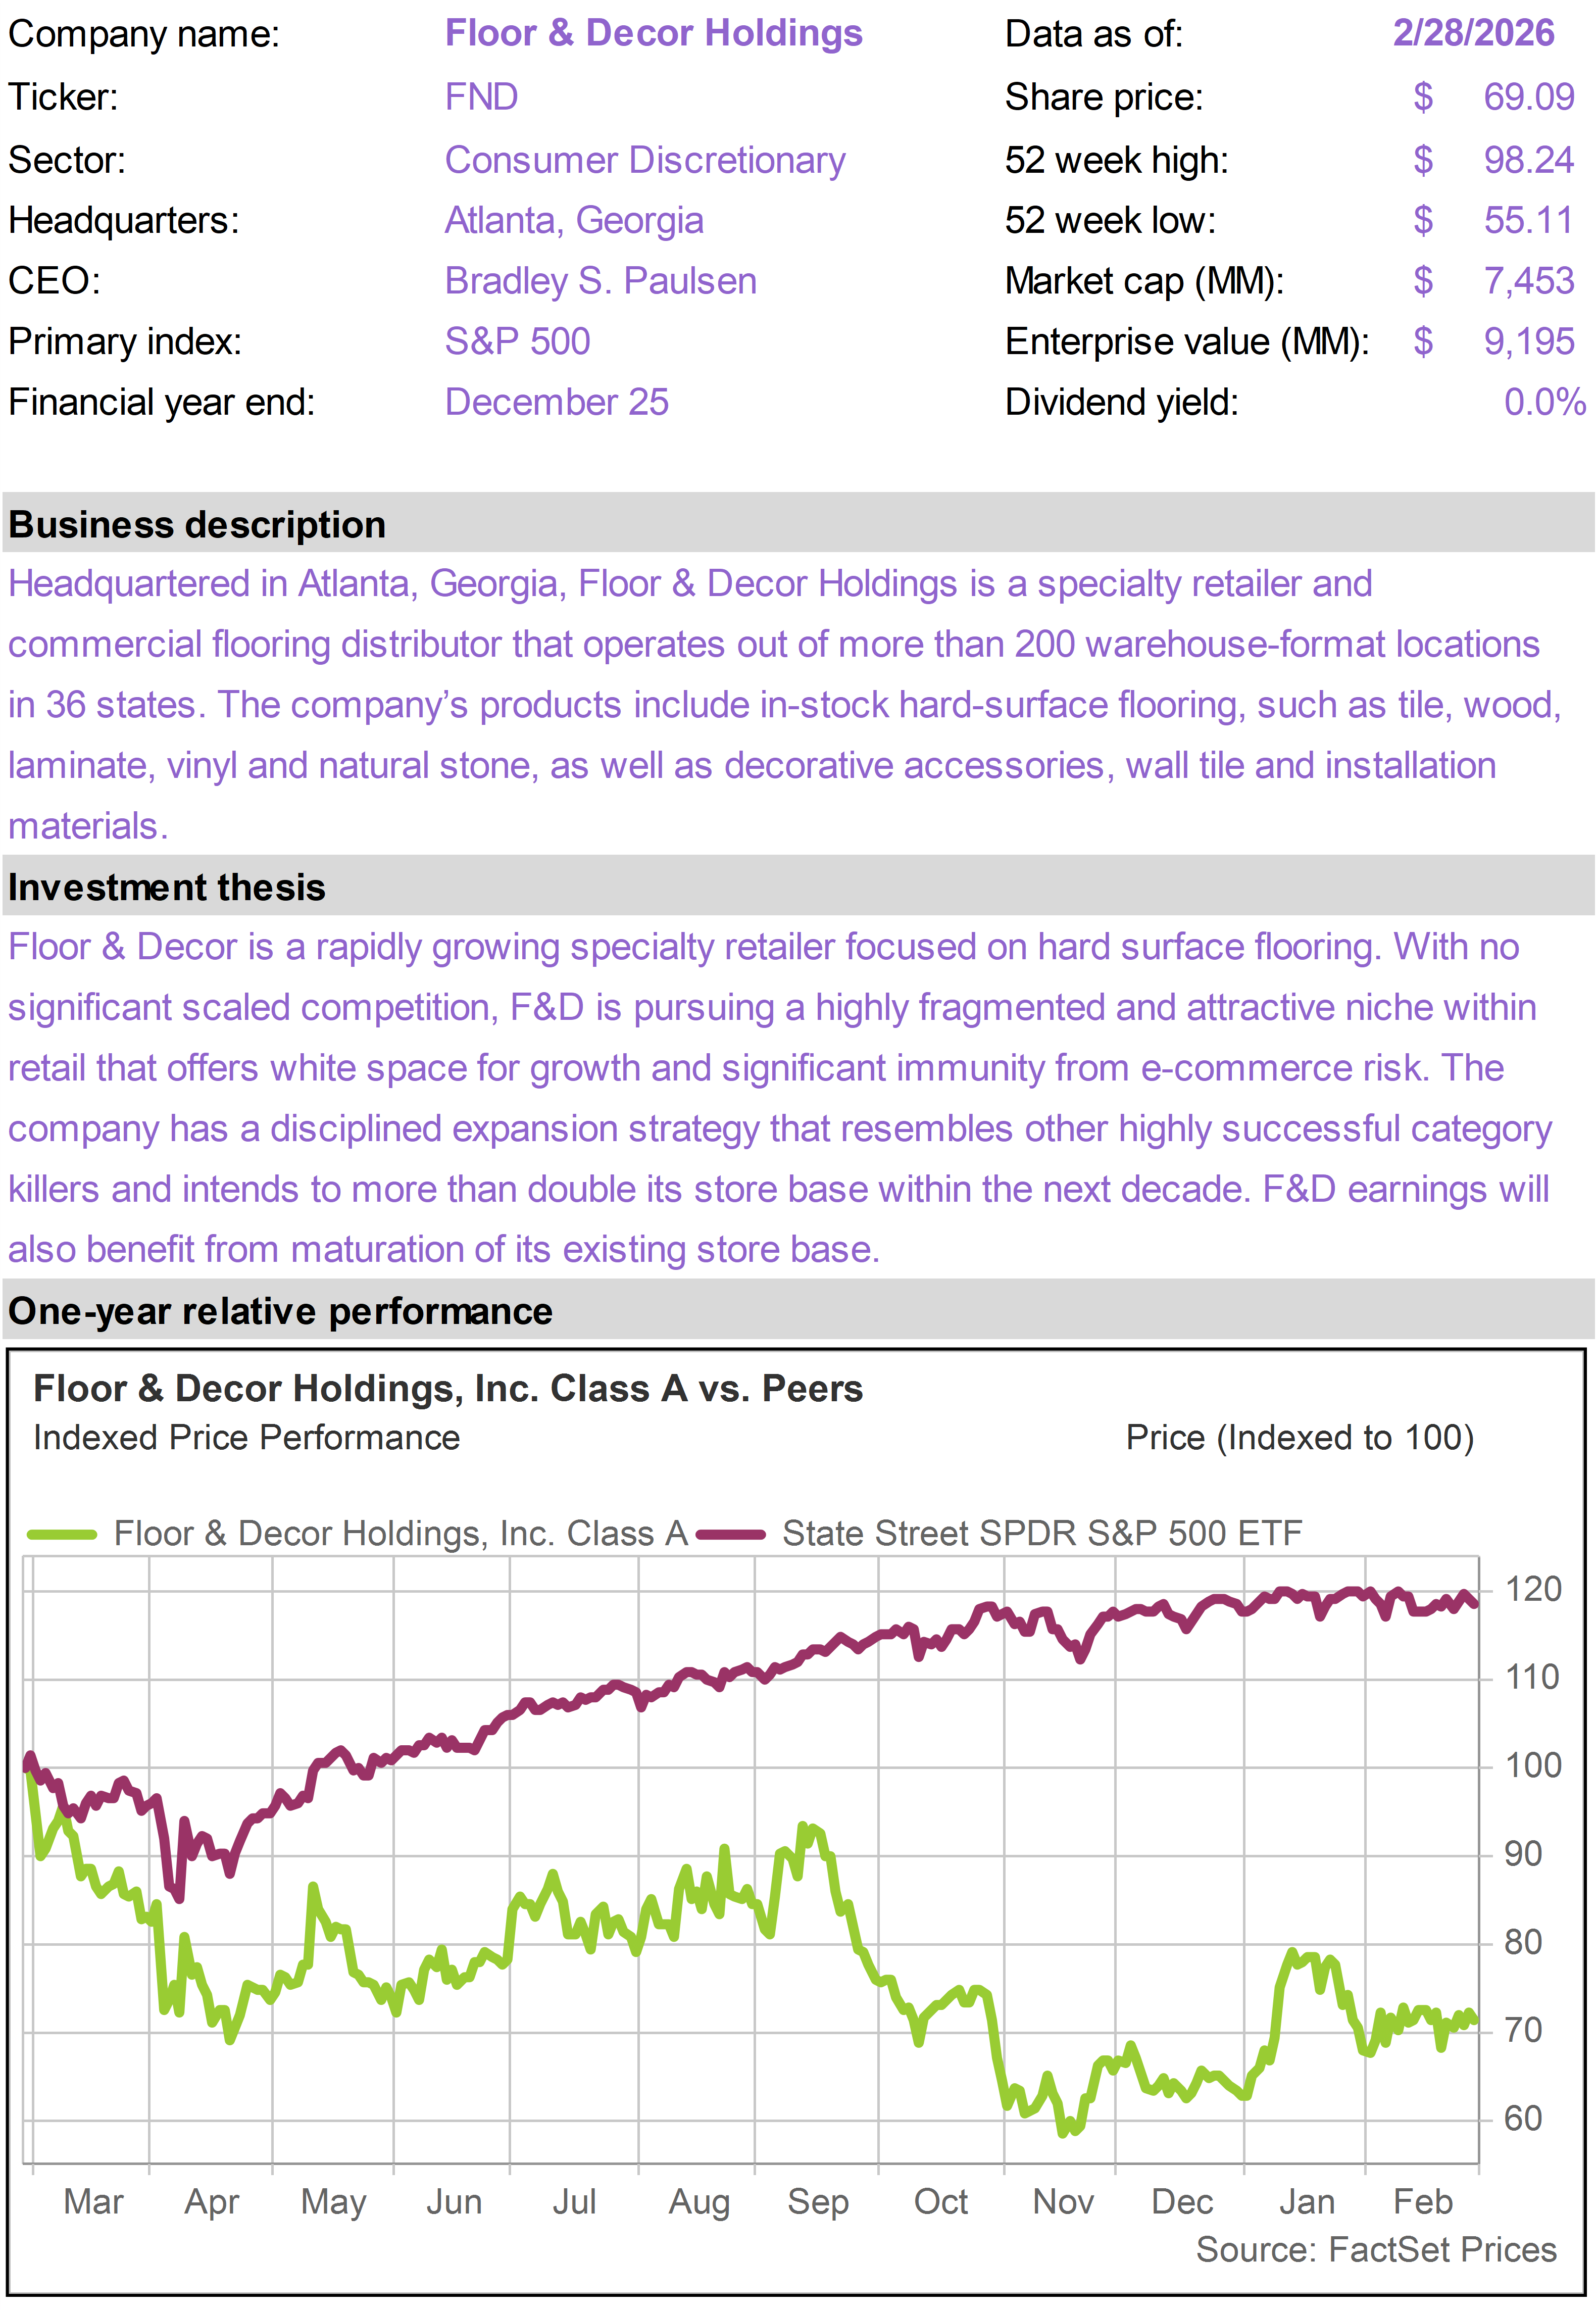
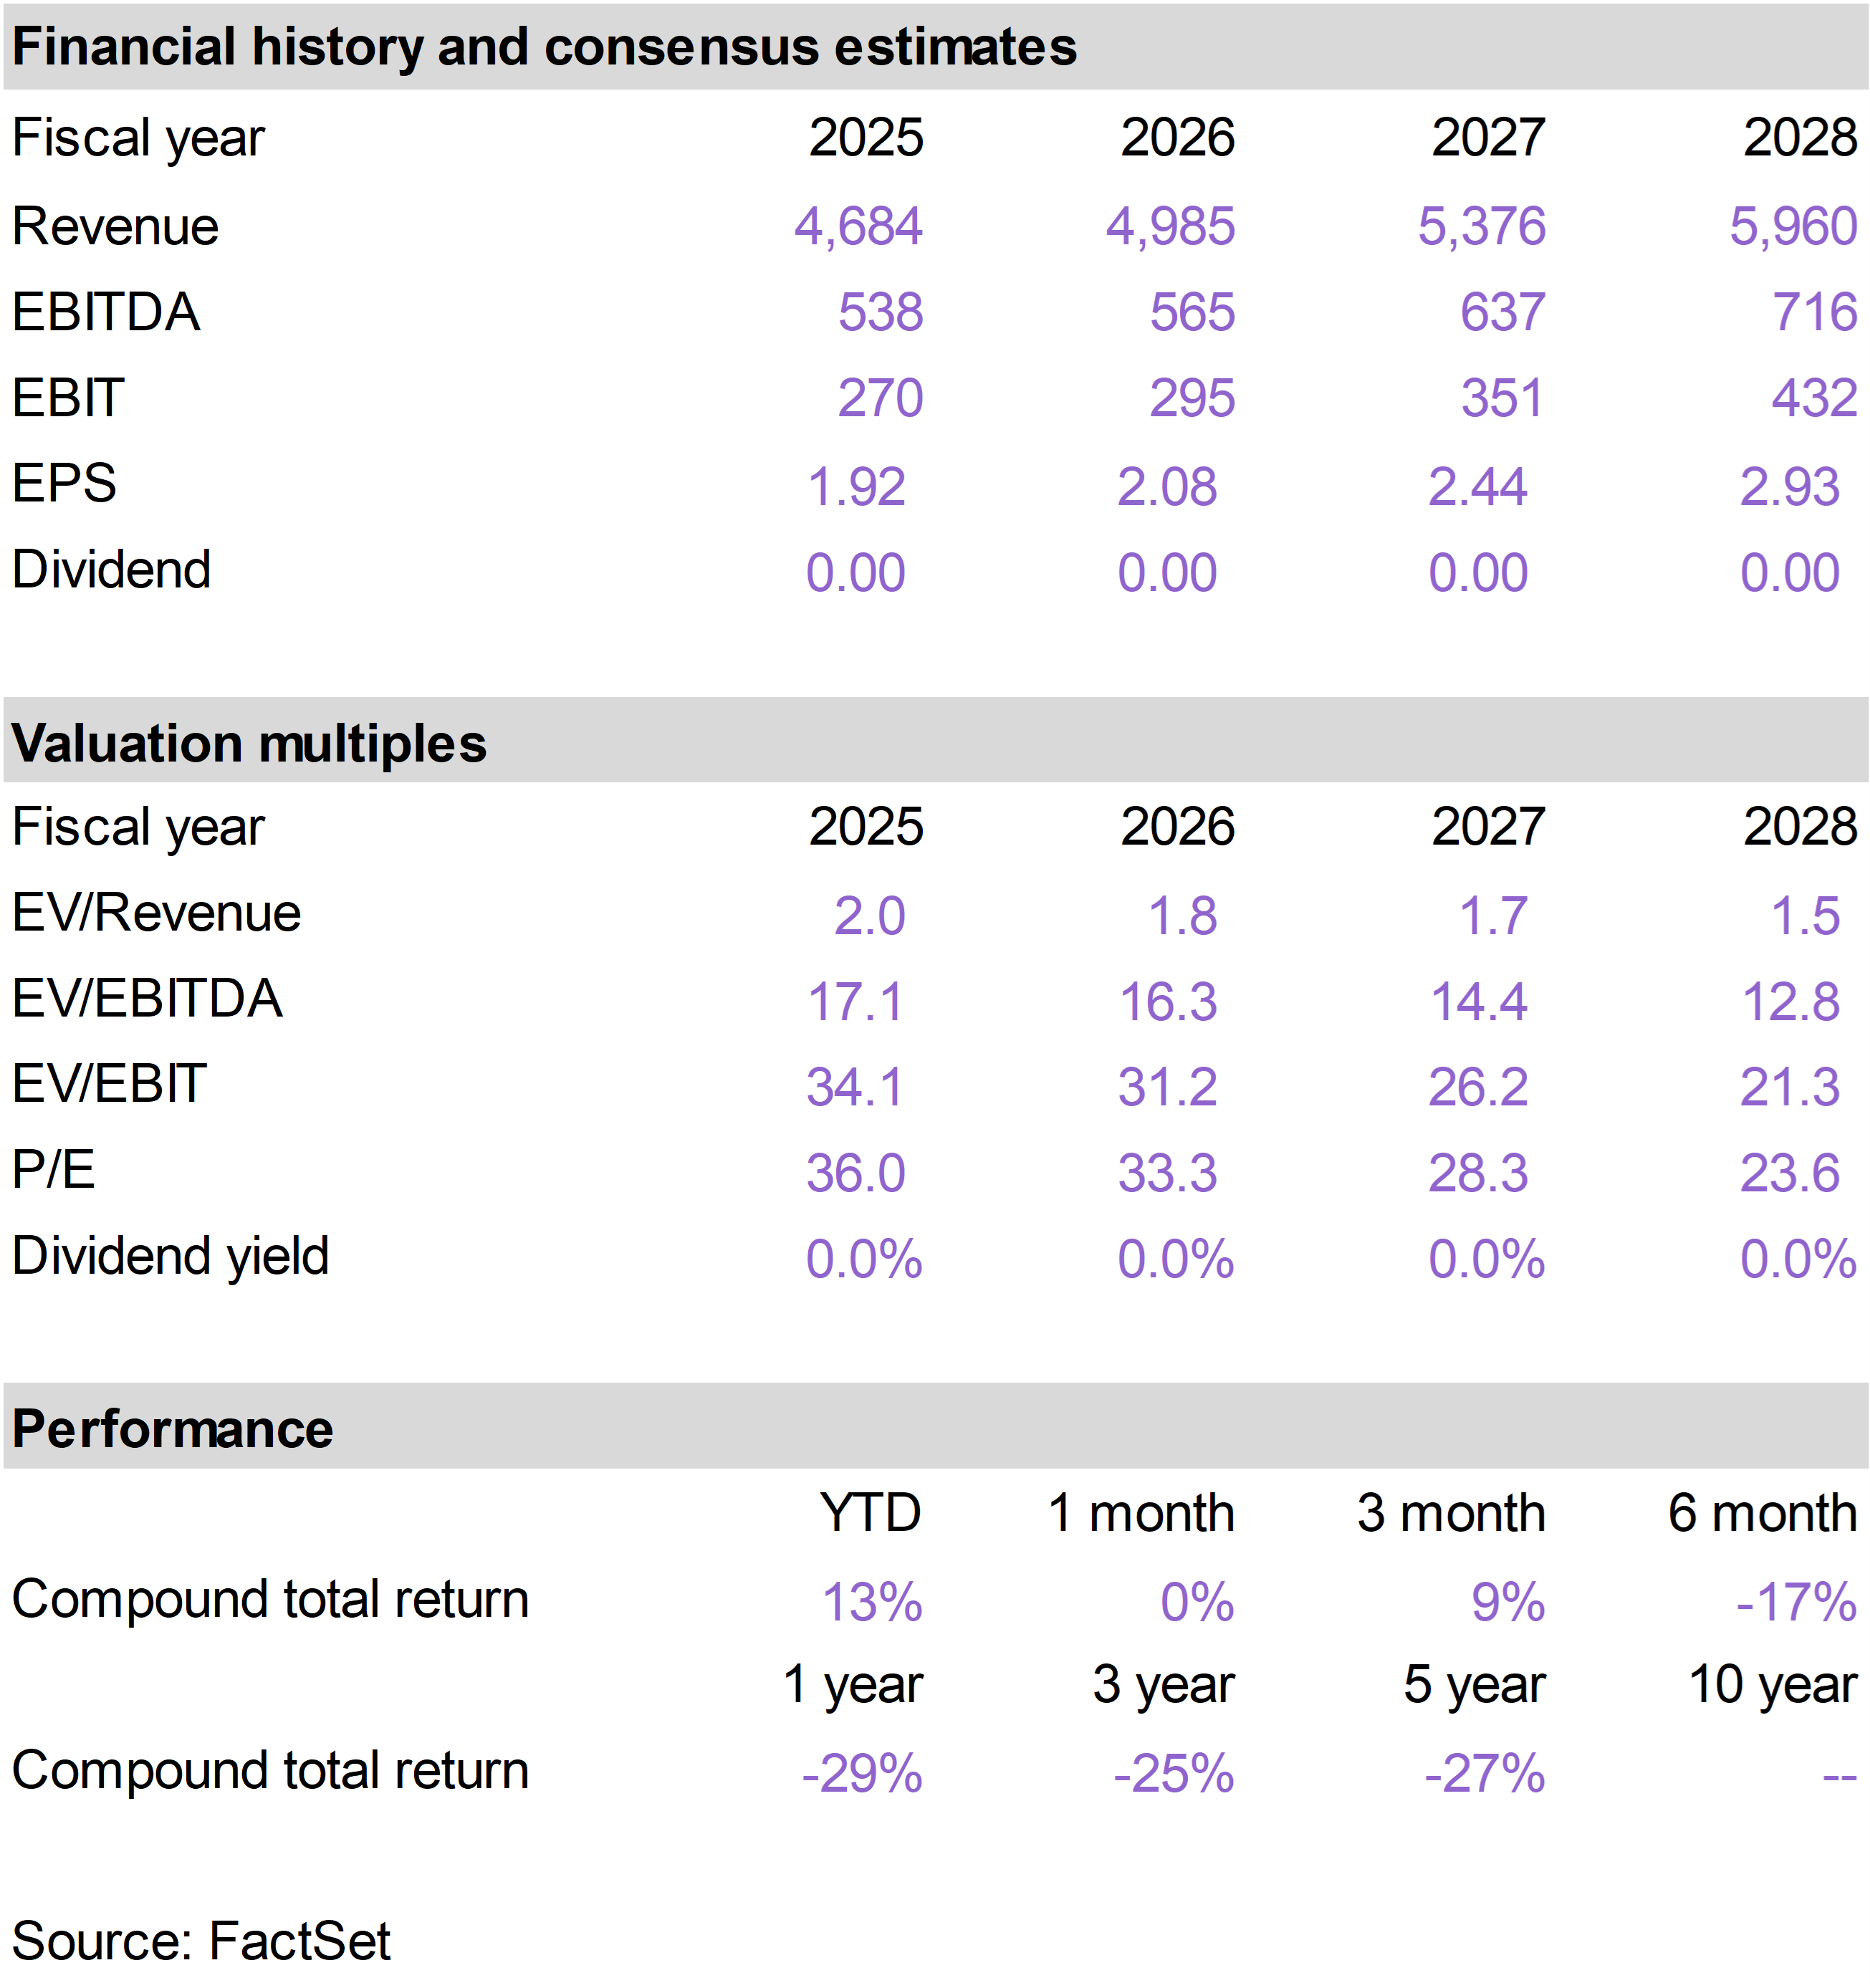
| | Floor & Decor Holdings (FND) |
|
|
|
| | |
|
| | |
|
| | |
|
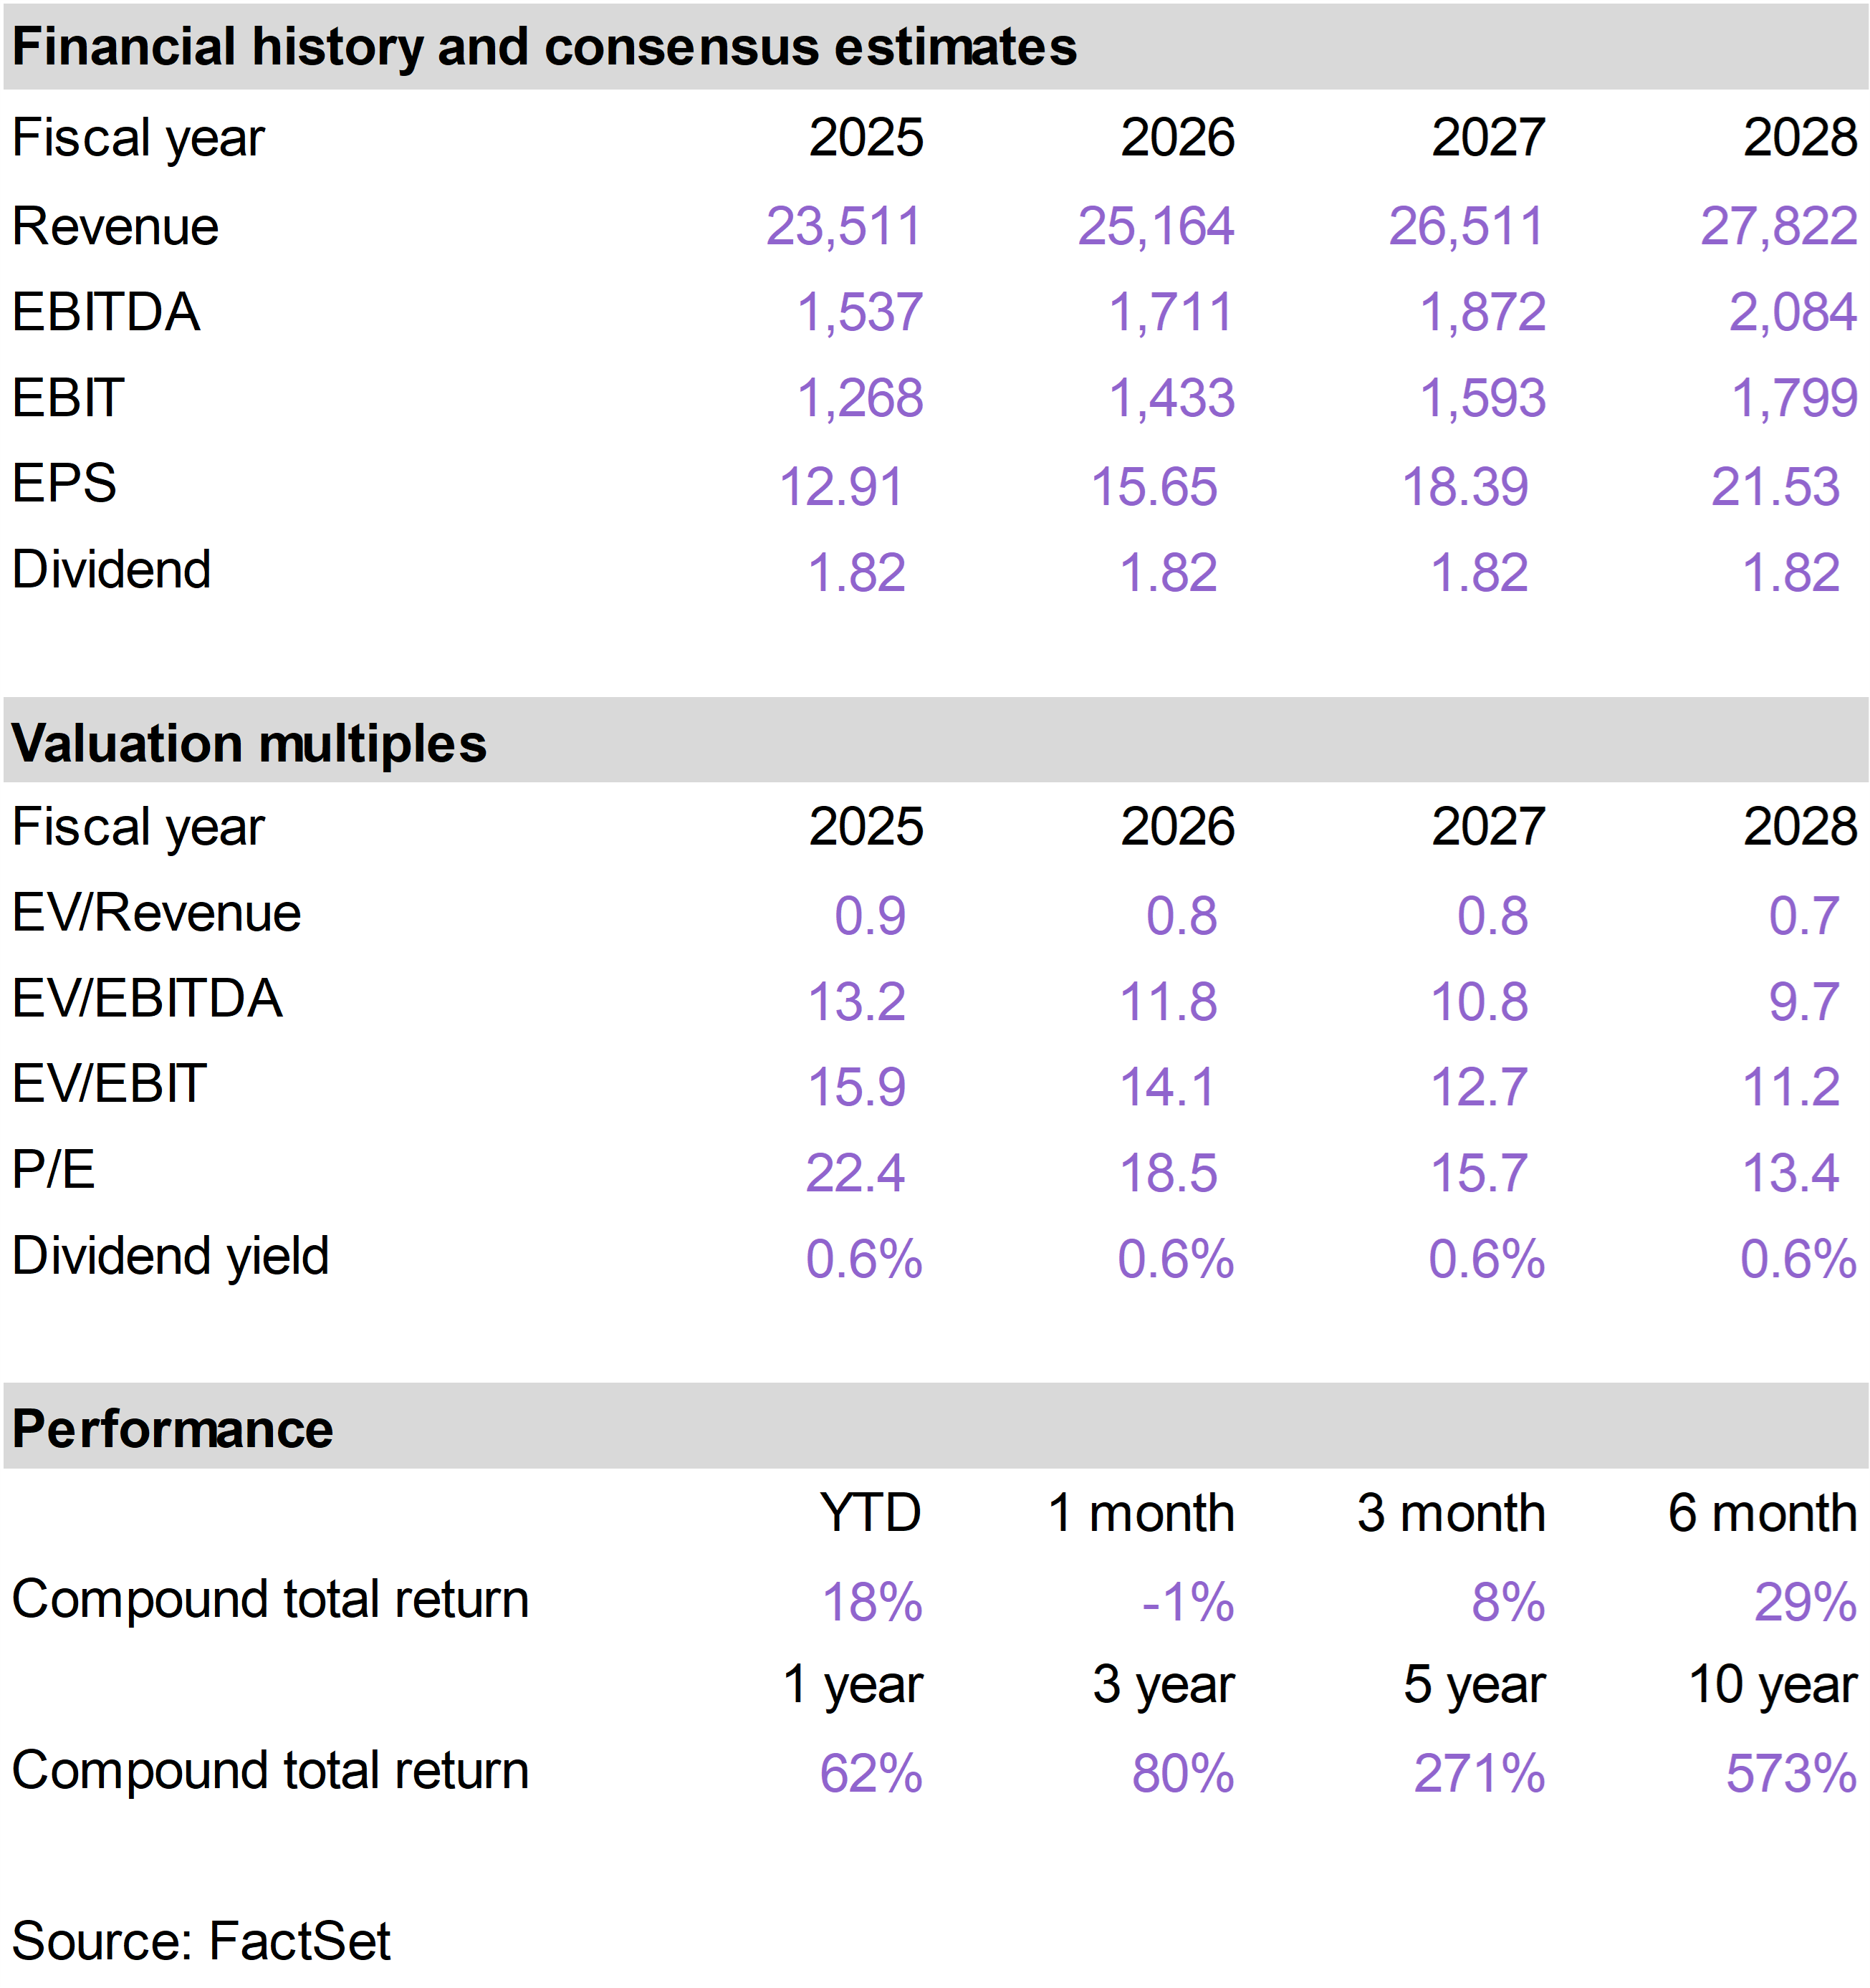
| | WESCO International (WCC) |
|
|
|
| | Wheaton Precious Metals (WPM) |
|
|
|
| | The 76research Inflation Protection Model Portfolio emphasizes business models that benefit from inflationary pressure. Holdings are typically selected from industries based on supply constrained real assets, including commodity and energy businesses, or companies that otherwise demonstrate superior pricing power. Drawing from an investable universe of expected inflation beneficiaries, specific holdings are chosen based on valuation and general business quality, growth and risk considerations. |
|
| | FOR SUBSCRIBER USE ONLY. DO NOT FORWARD OR SHARE. |
|
| | | |
|
|
|
|
|