| Inflation Protection Model Portfolio |
|
| Monthly Portfolio Review: July 2026Publication date: August 3, 2026 |
|
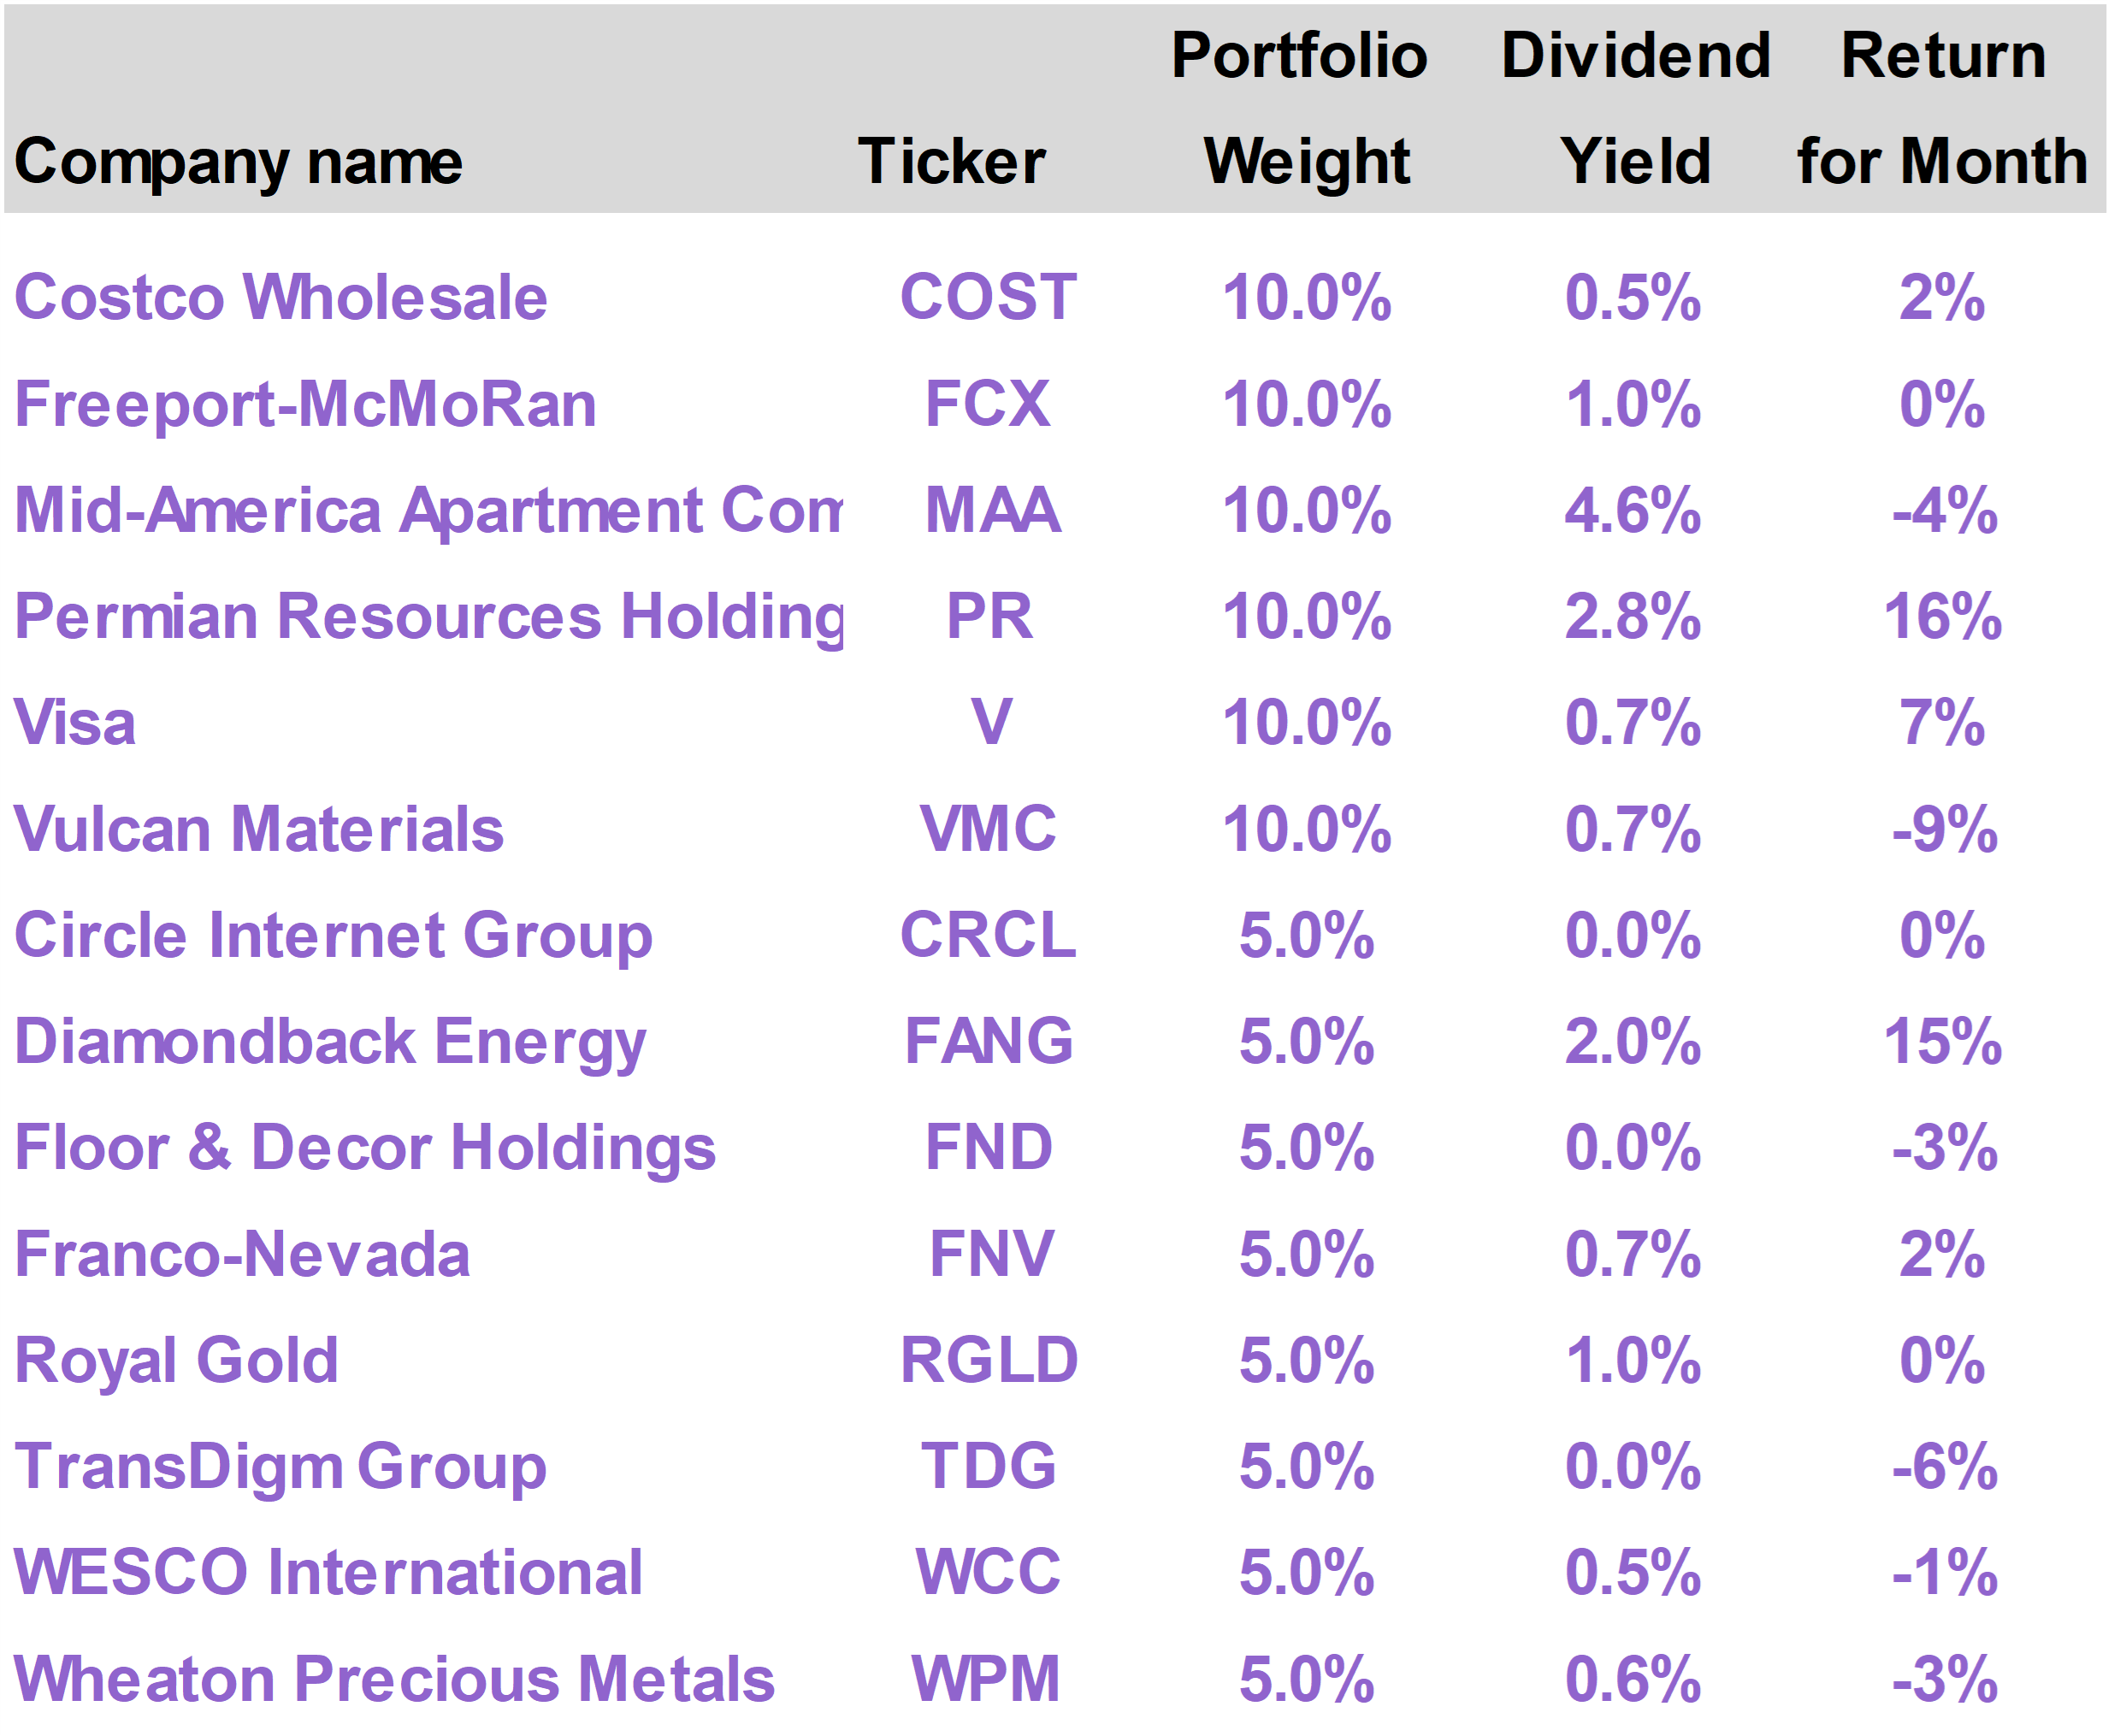
| | | Current portfolio holdings |
|
|
| | FOR SUBSCRIBER USE ONLY. DO NOT FORWARD OR SHARE. |
|
| | | Renewed fighting in the Middle East, despite the June ceasefire agreement, triggered a reset of market expectations in July. Although the S&P 500 was basically flat, registering a 0.1% decline, Technology stocks underperformed substantially (down 8%), while Energy outperformed (up 12%). Higher oil prices drove up inflation expectations, leading to upward pressure on interest rates. The Inflation Protection portfolio performed relatively well in this environment, generating a total return of 1.4%. On a year to date basis, the portfolio has returned 13.7%, versus 10.1% for the S&P 500. Oil and gas plays Permian Resources (PR) and Diamondback (FANG) led the portfolio, generating mid-teens returns. While the Iran situation may continue as a source of volatility, underlying growth trends remain favorable.
|
|
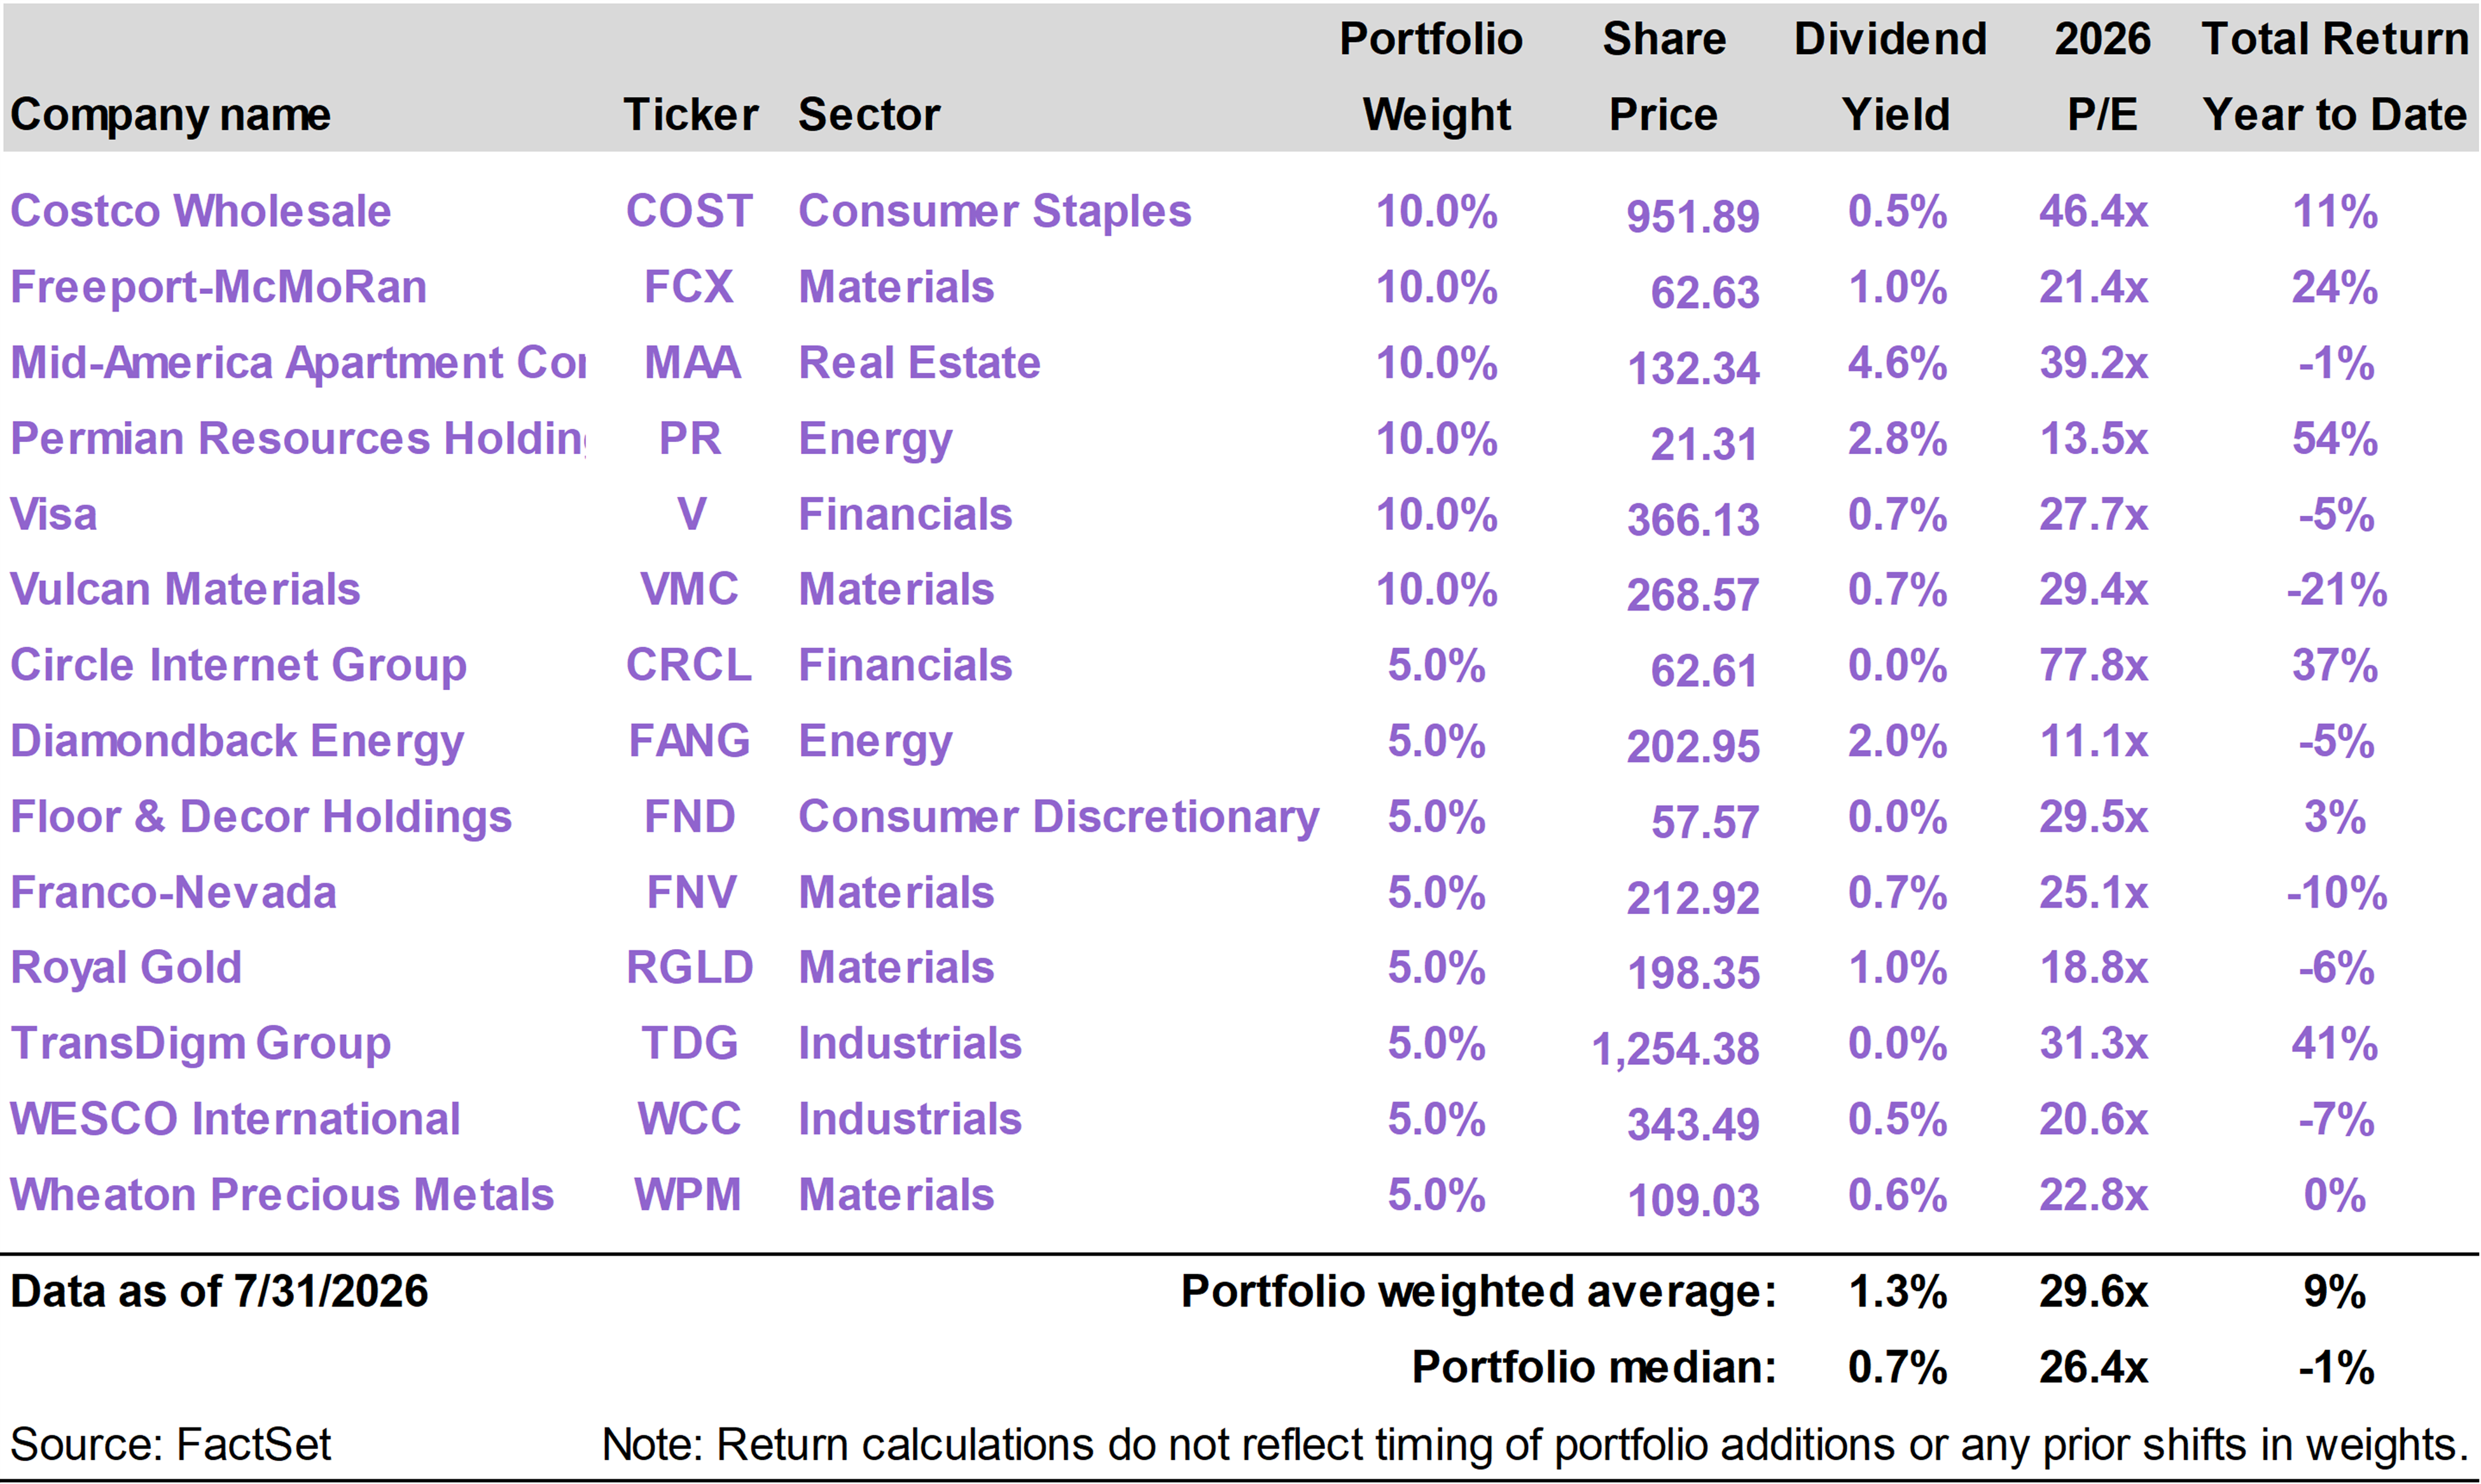
| | | The Inflation Protection portfolio returned 1.4% in July, outpacing the S&P 500 Index return of -0.1%. On a year to date basis through the end of the month, the portfolio has generated a total return of 13.7%, versus the 10.1% return of the S&P 500.
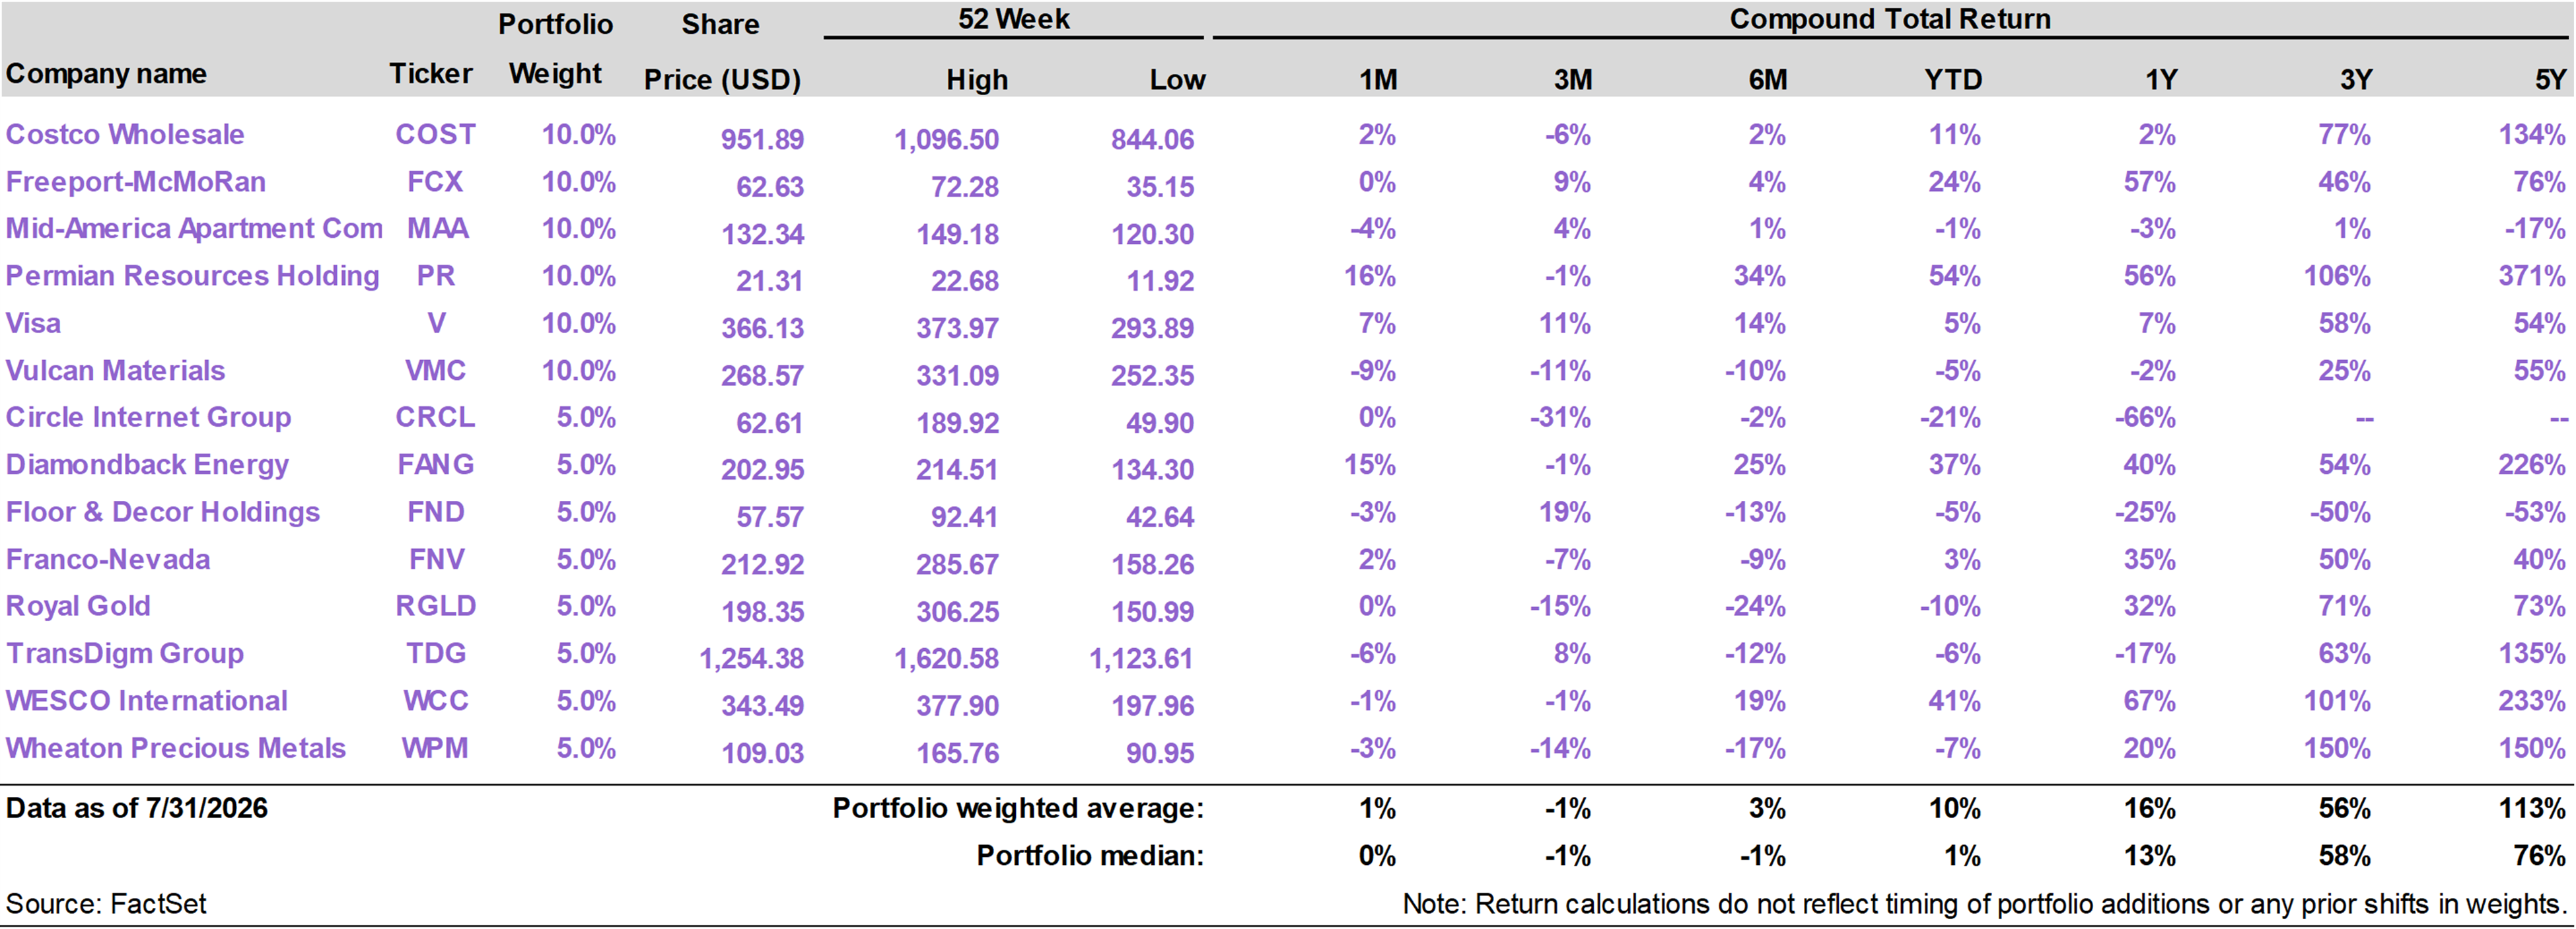
The portfolio’s top performing stocks this month were Permian Resources (PR), which returned 16%; Diamondback Energy (FANG), which returned 15%; and Visa (V), which returned 7%.
The largest portfolio detractors were Vulcan Materials (VMC), which returned -9%; TransDigm (TDG), which returned -6%; and Mid-America Apartments (MAA), which returned -4%. |
|
|
Combat resumes
The most important market development in July was the renewed outbreak of combat between the United States and Iran.
In last month’s report, we discussed the collapse in oil prices that followed the Memorandum of Understanding between the two countries. The agreement reopened the Strait of Hormuz and created hope that a more durable resolution to the conflict was taking shape.
Unfortunately, that optimism proved premature.
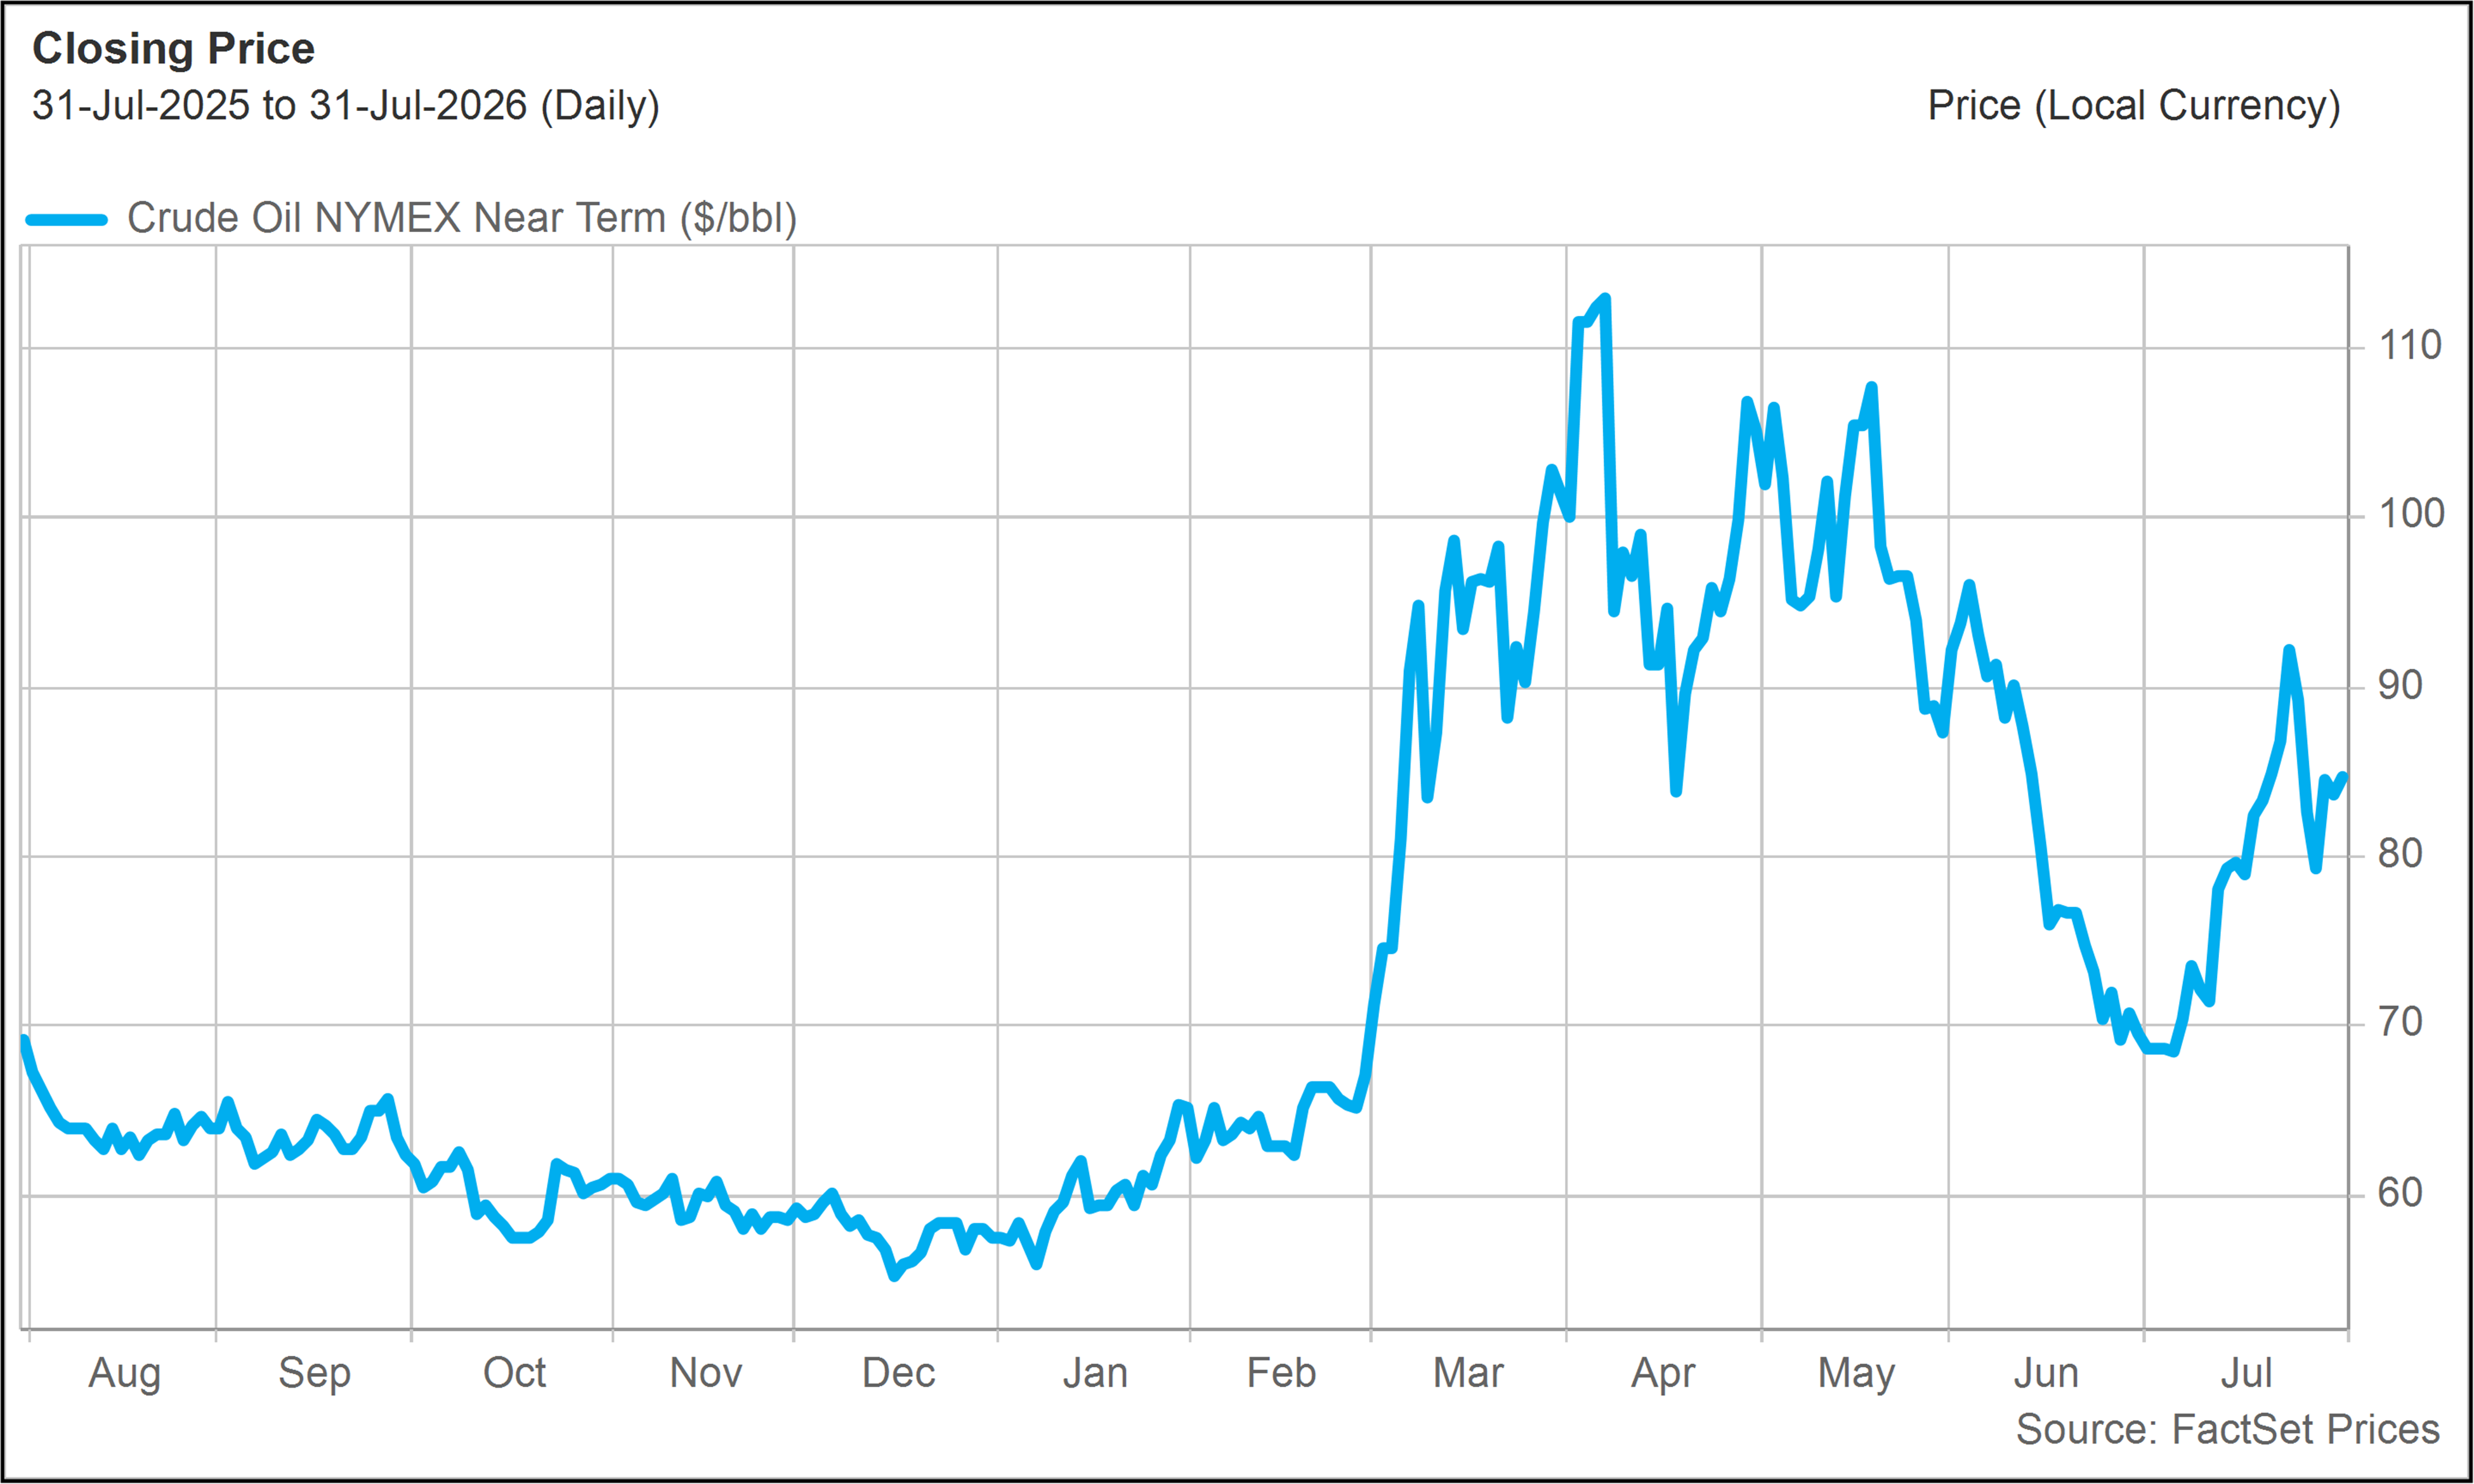
Fighting resumed in July, once again disrupting the movement of energy supplies through the Persian Gulf. Crude oil prices reversed sharply higher as traders rebuilt the geopolitical risk premium that had disappeared following the June agreement.
At the end of June, crude prices had dipped below $70 per barrel, their lowest level since February. By the end of July, crude oil had risen 22% to approximately $85 per barrel. |
|
|
|
Crude Oil($/barrel - Last 12 Months) |
|
|
Energy stocks responded accordingly. The Energy sector advanced 12% in July, making it the best-performing part of the S&P 500 by a wide margin.
The speed of the reversal was striking. Energy had been the worst-performing sector in June, falling 5% as the market anticipated a normalization of oil flows. One month later, it was the clear market leader.
As we discussed last week in the 76report (Prepare, Don’t Predict: Investing Amid Renewed Middle East Turmoil), the whipsaw in energy serves as a good reminder of the inherent uncertainty surrounding geopolitical events.
It also illustrates why maintaining exposure to Energy can be valuable even when the immediate geopolitical outlook appears to be improving.
A more complicated inflation picture
The increase in oil prices came just as the inflation outlook appeared to be improving substantially.
The June inflation reports, published in July, showed a meaningful decline in headline inflation, largely reflecting the earlier collapse in energy prices. Core inflation also appeared increasingly contained, with shelter and several service categories showing signs of moderation.
These reports provided evidence that the restrictive monetary policy of the past several years was finally having its intended effect.
But inflation data is backward-looking. The June reports captured the decline in oil prices that followed the temporary peace agreement. They did not reflect the renewed fighting or the sharp rebound in energy prices during July.
This does not mean the inflation improvement has been completely reversed. A rise in oil prices does not automatically translate into persistent inflation, particularly if the increase proves temporary.
But higher oil prices do affect the economy indirectly through various channels, lifting transportation and other operating costs across sectors.
Impact on interest rates
Interest rates moved higher in July as rising oil prices led to diminished expectations for a shift toward easier monetary policy.
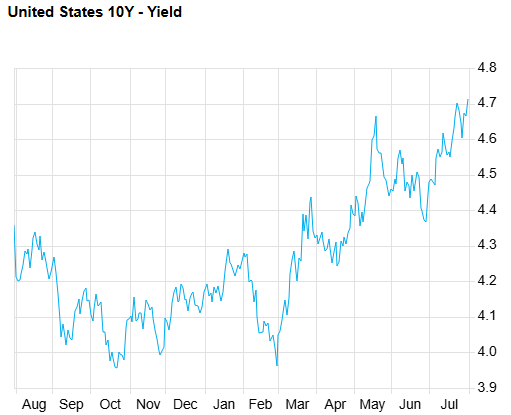
The 10-Year Treasury yield increased more than a quarter-point, from 4.44% at the end of June to 4.71% at the end of July. |
|
|
|
10-Year Treasury Yields—Last 12 Months(Source: FactSet) |
|
|
At its mid-July meeting, the Federal Reserve left the short-term fed funds rate unchanged at the 3.5% to 3.75% target range.
But with three voting members of the Federal Open Market Committee (FOMC) dissenting in favor of higher rates, the debate has moved away from when the Fed might cut rates and toward whether further tightening may become necessary.
That represents an important change in market psychology. Only a few months ago, many investors expected declining energy prices and moderating inflation to create a relatively straightforward path toward lower rates.
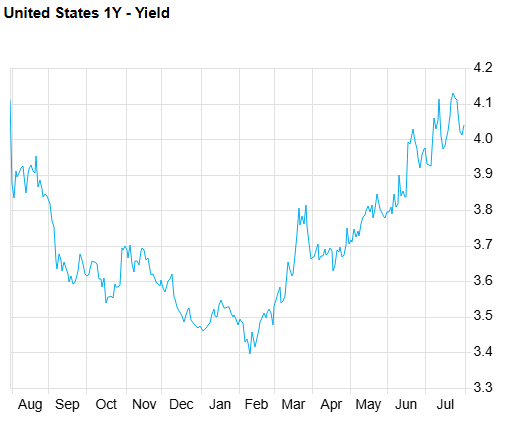
Now, with One-Year Treasury yields slightly higher than 4%, at least one quarter-point interest rate hike within the next 12 months is priced into Treasuries. |
|
|
|
1-Year Treasury Yields—Last 12 Months(Source: FactSet) |
|
|
Economic resilience
The economic data published during July also gave the Fed little reason to move aggressively toward lower rates.
The preliminary second quarter GDP report suggested that underlying domestic demand remained healthier than the headline growth rate initially implied. Consumer spending continued to expand, while business investment remained solid.
Investment in equipment and technology infrastructure was an especially important source of support.
The enormous spending associated with data centers, semiconductors, electrical infrastructure and the broader AI buildout is not just a stock market narrative. It is having a measurable impact on capital investment throughout the economy.
The continued strength of consumer spending and business investment means the economy is not sending the Fed an urgent signal that lower rates are needed.
That is encouraging from an earnings and recession-risk perspective. But it also means interest rates may remain elevated for longer than investors had hoped, with the Fed likely less nervous about triggering an economic contraction.
A flat market masks a major rotation
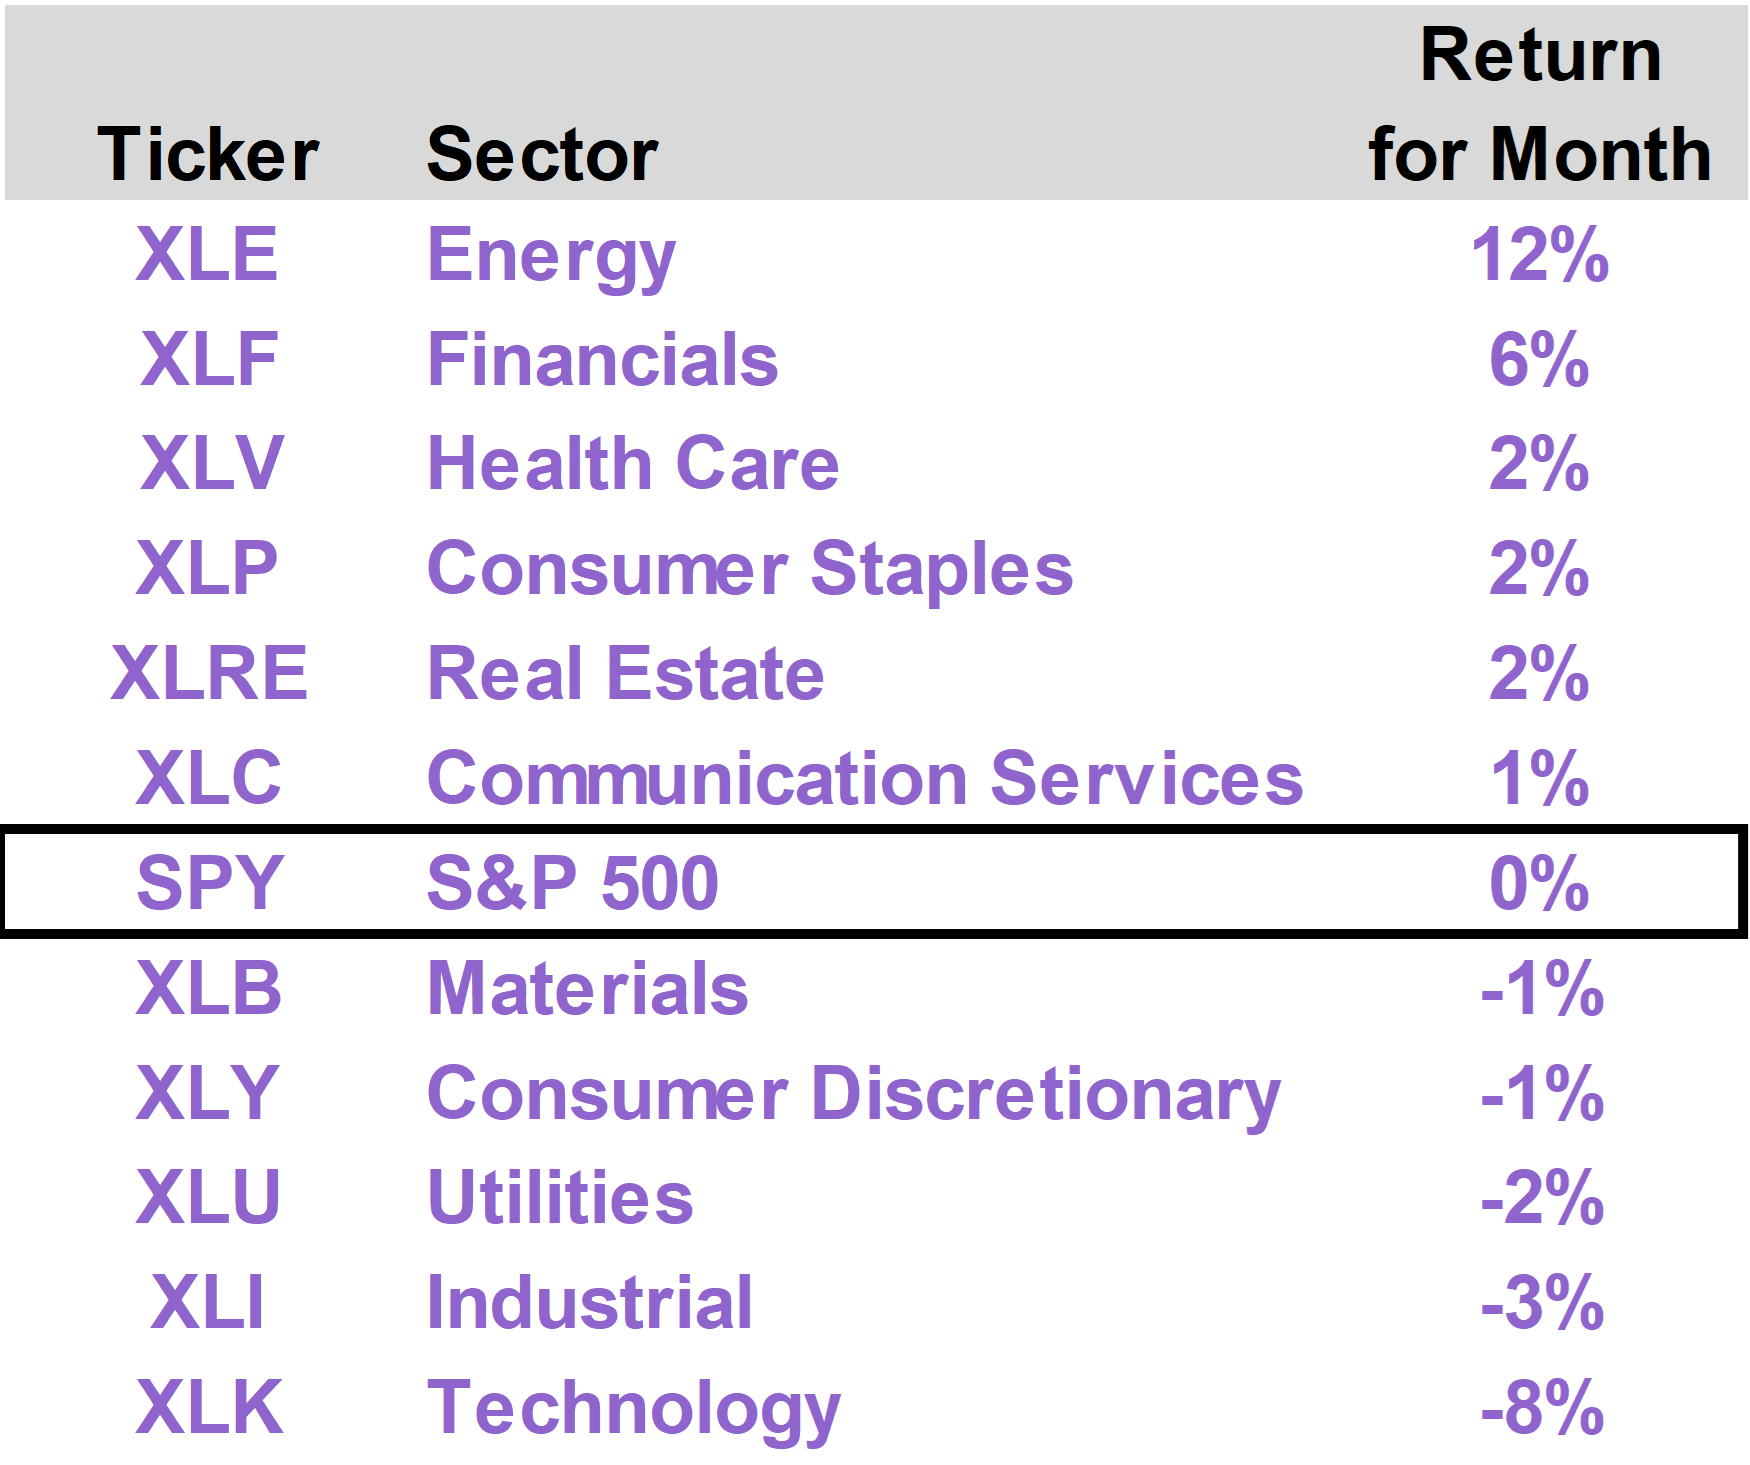
Against this backdrop, the S&P 500 generated an approximately flat return in July. That seemingly uneventful result obscures a dramatic rotation beneath the surface.
The Energy sector, as noted, advanced 12%, followed by a 6% return from Financials. Meanwhile, Technology declined 8% and was the most significant detractor to returns. |
|
|
|
From a sector perspective, the most notable aspect of the month was that the S&P 500 remained approximately flat despite severe weakness in tech, even though tech now represents nearly 40% of the index.
Investors did not abandon the market altogether. They moved capital from one part of the market to another.
This arguably represents healthier market breadth than an environment in which nearly all returns depend on a small group of mega-cap companies.
But the forces driving the rotation were not entirely favorable.
Energy benefited from geopolitical instability. Financials benefited in part from higher interest rates and a steeper yield curve. Defensive sectors benefited as investors became more cautious.
The market became more diversified, but it did so largely because the macroeconomic backdrop became less comfortable.
AI shakeout
Technology was the clear casualty of the July market environment. The sector declined 8%, with some semiconductor, hardware and AI-infrastructure stocks falling substantially more than the sector average.
There were two interconnected sources of pressure.
The first was interest rates.
Higher long-term bond yields reduce the present value of earnings expected far in the future. This effect is especially significant for high-growth companies whose valuations depend on many years of future expansion.
The second was growing scrutiny of AI capital spending.
The largest Technology companies continue to commit extraordinary sums to data centers, processors, networking equipment and electrical infrastructure. The scale of this spending demonstrates management teams’ confidence that AI will become a major source of future growth.
But investors are increasingly interested in proof that the spending will generate an adequate return. This focus became especially important during July’s earnings season.
Companies that demonstrated strong cloud demand and visible AI monetization were treated more favorably. Companies that increased capital spending without providing equally compelling evidence of near-term financial returns came under pressure.
The path forward
The short-term trajectory of markets will likely continue to depend heavily on the Iranian conflict.
A credible and lasting agreement that restores normal shipping through the Strait of Hormuz could cause oil prices to retreat, improve the inflation outlook and give the Fed greater flexibility. That scenario could provide meaningful relief to Technology and other interest rate sensitive assets.
Without such an agreement, energy prices may remain volatile, interest rate relief could be delayed, and investors may continue to favor businesses offering immediate cash flow over those whose valuations depend primarily on distant growth.
But while uncertainty around Iran, oil and interest rates represents a major headwind, investors should not lose sight of the broader backdrop of healthy economic growth and sustained technology-related investment.
The strong results recently reported by both Microsoft (MSFT) and Amazon (AMZN) provide important evidence that the AI infrastructure buildout is being supported by genuine customer demand.
MSFT reported quarterly revenue of approximately $90 billion, up 18% year-over-year. Cloud services revenue, which increasingly represents demand for AI compute capacity, grew 43%.
AMZN’s cloud business delivered even sharper acceleration. Amazon Web Services (AWS) revenue increased 37% to $42 billion—its fastest growth in more than four years.
Management indicated that much of its available computing capacity for 2027 has already been reserved by customers, with significant commitments extending into 2028.
These are not the results of an infrastructure buildout searching for customers. They suggest that new capacity is being absorbed rapidly and that businesses remain willing to spend heavily to gain access to advanced computing and AI capabilities.
The strong growth posted by these AI industry leaders suggest that July’s pressure on Technology stocks was more likely a reassessment of valuations, financing costs and the timing of returns—not a collapse in the underlying growth opportunity.
Markets may remain volatile as investors respond to developments in Iran, oil prices and interest rates. Yet beneath these short-term pressures, the economy continues to expand and demand for computing infrastructure remains exceptionally strong.
A resolution of the Iranian conflict could therefore produce a powerful combination: lower energy prices and interest rates alongside continued growth in AI-related investment and earnings. Even without an immediate resolution, the long-term technology and productivity story remains intact. |
|
| | |
The top performing stocks in the Inflation Protection portfolio this month were Permian Resources (PR), which returned 16%; Diamondback Energy (FANG), which returned 15%; and Visa (V), which returned 7%.
The worst performing stocks in the portfolio in July were Vulcan Materials (VMC), which returned -9%; TransDigm (TDG), which returned -6%; and Mid-America Apartments (MAA), which returned -4%. |
|
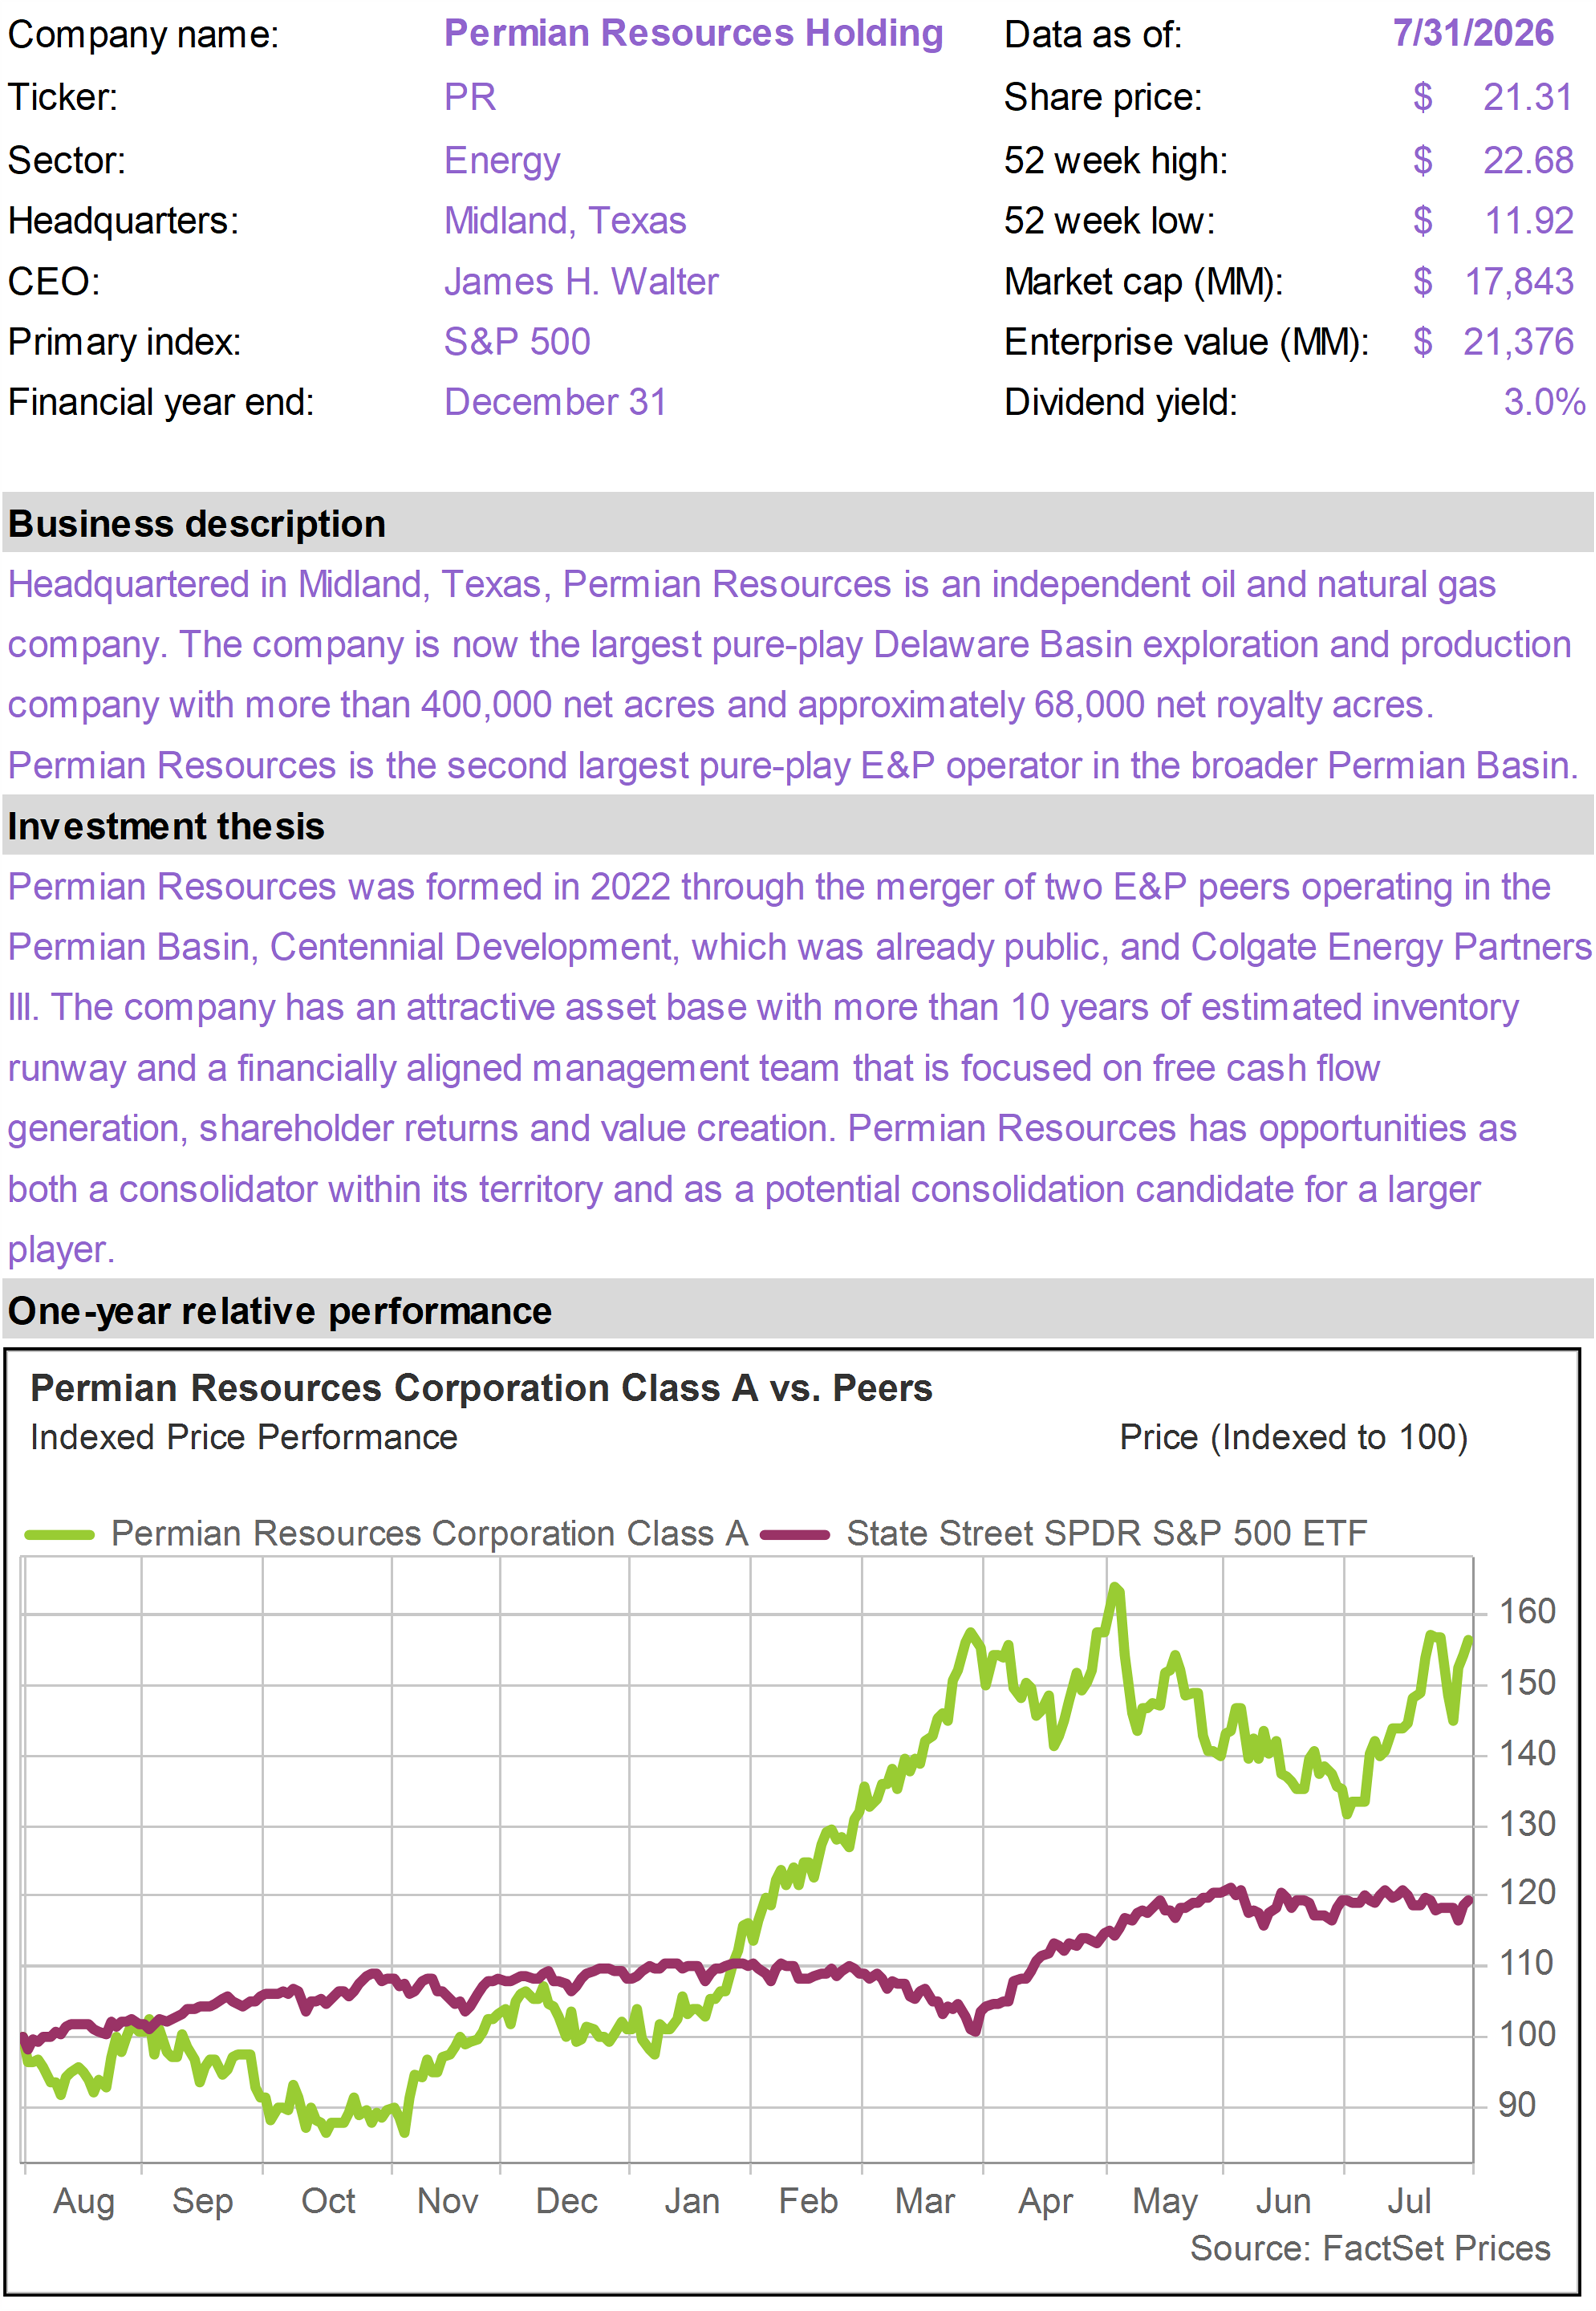
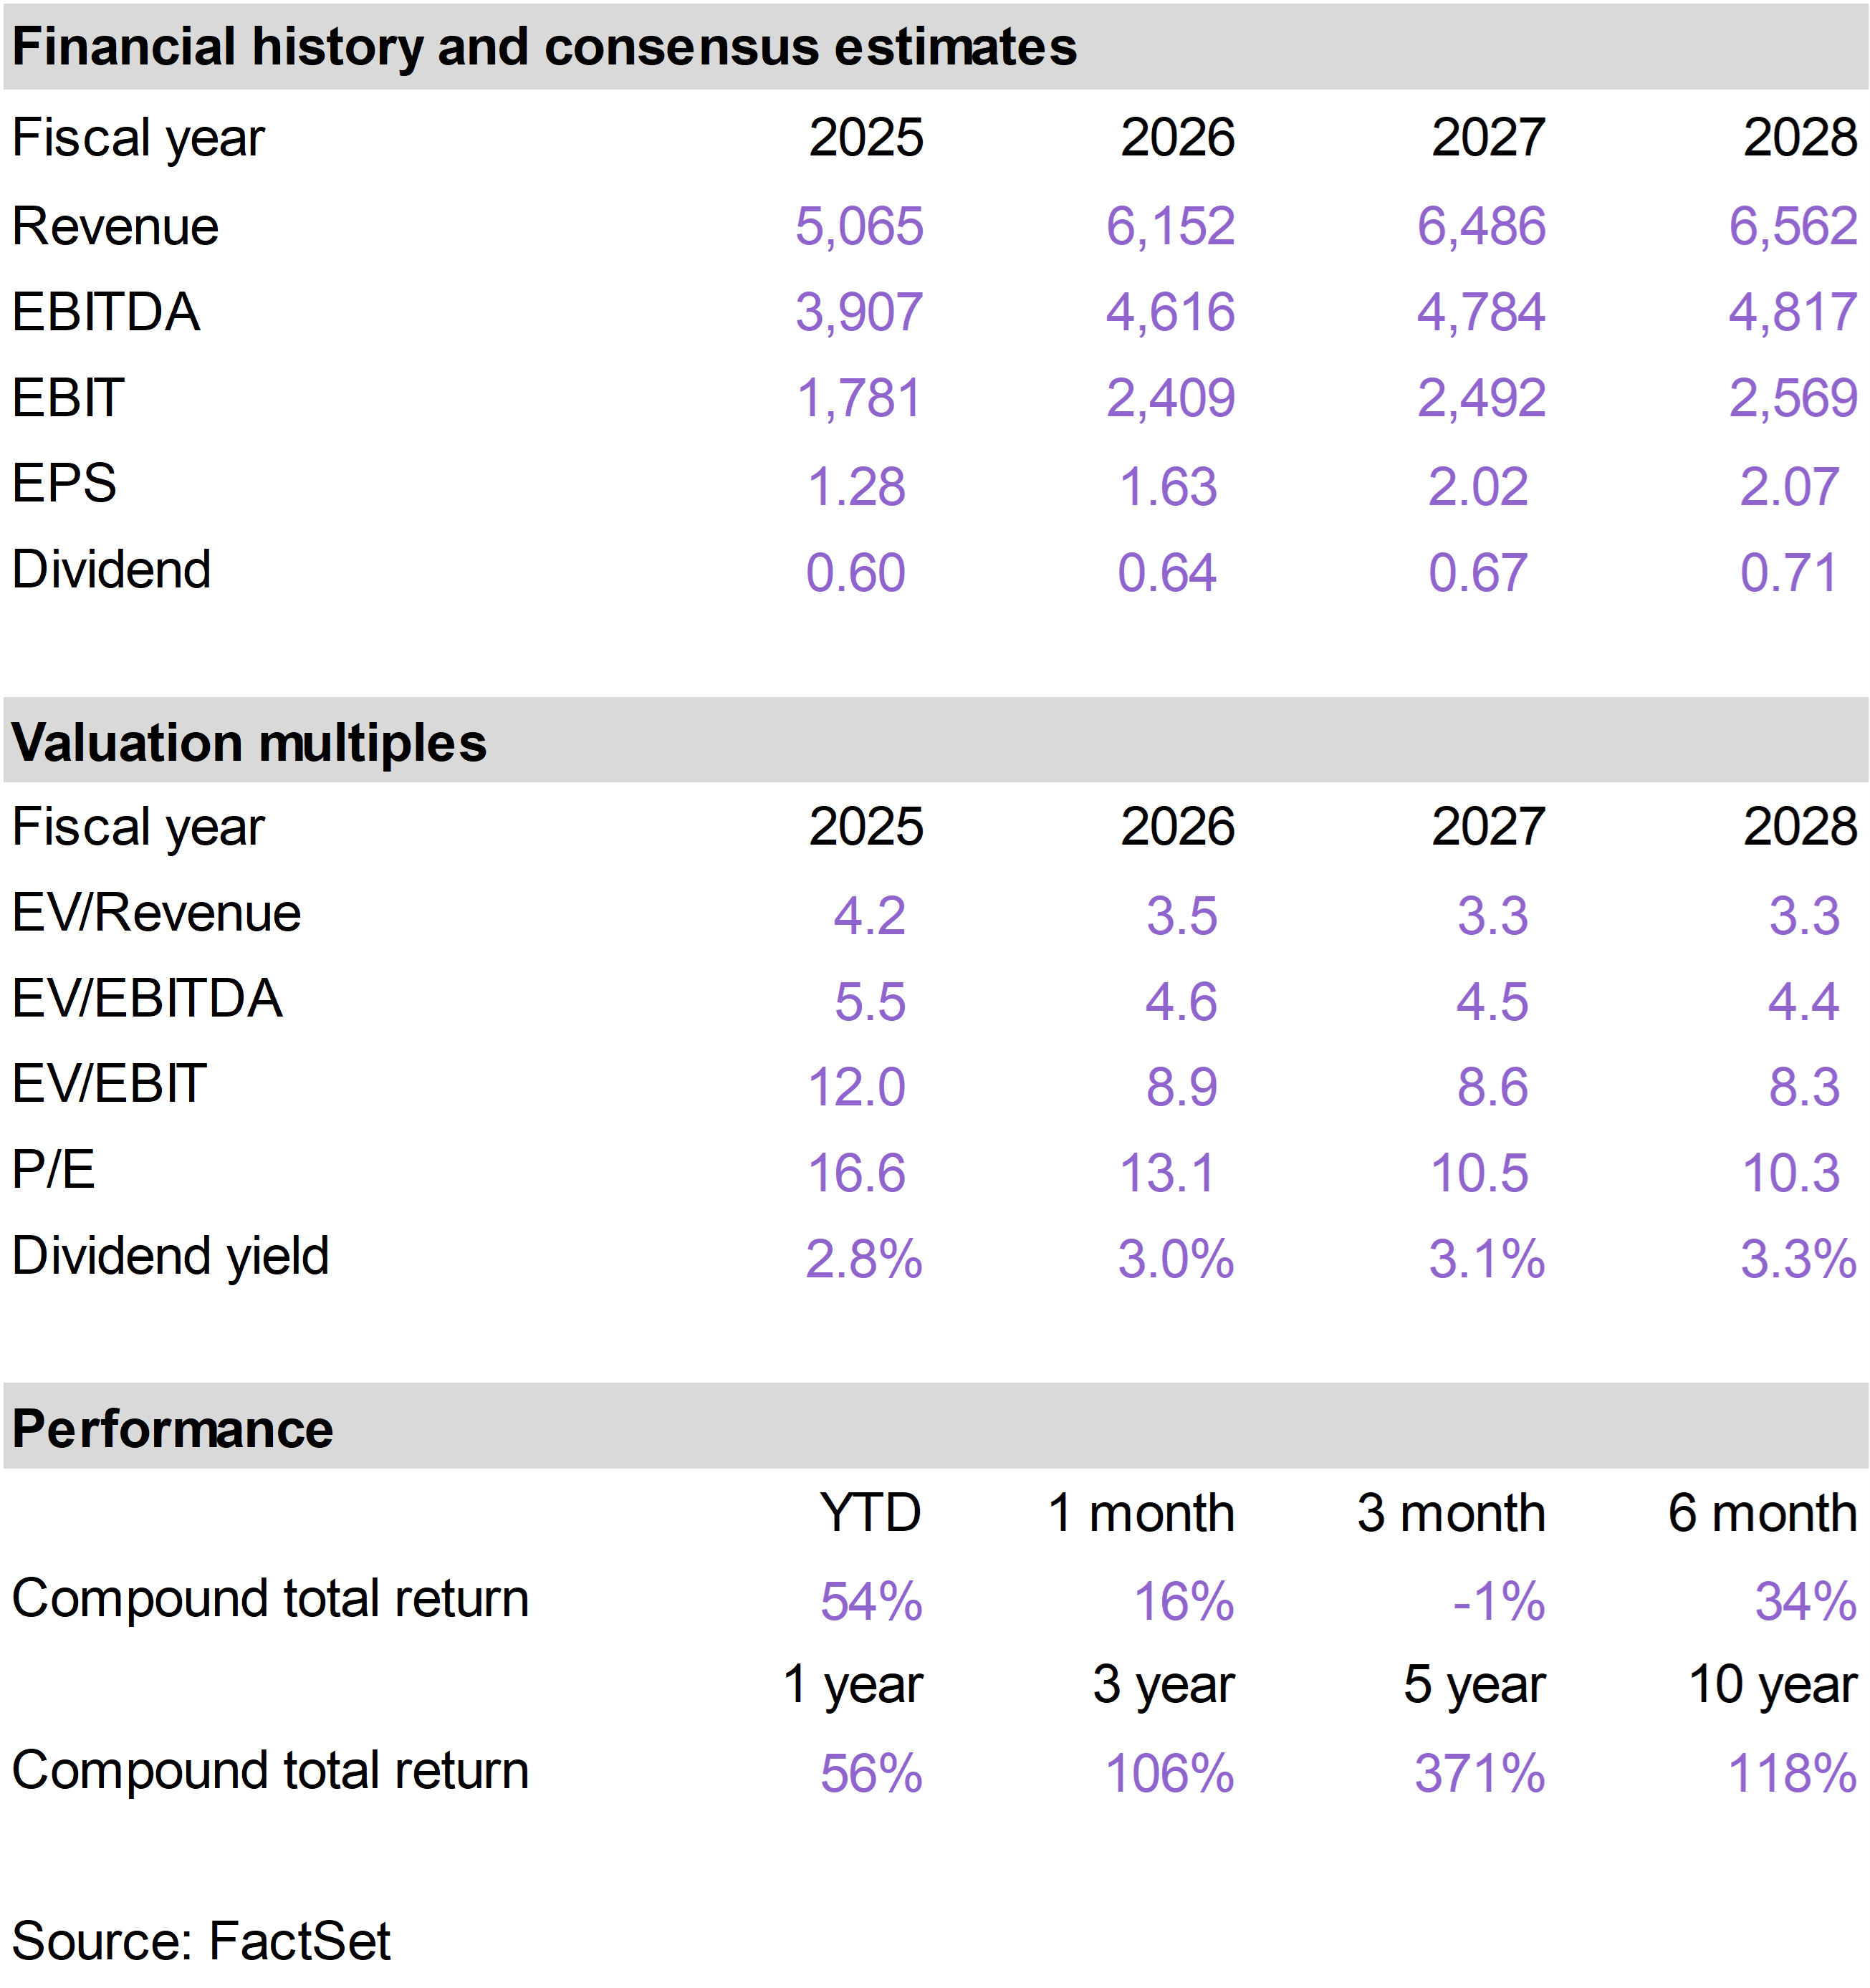
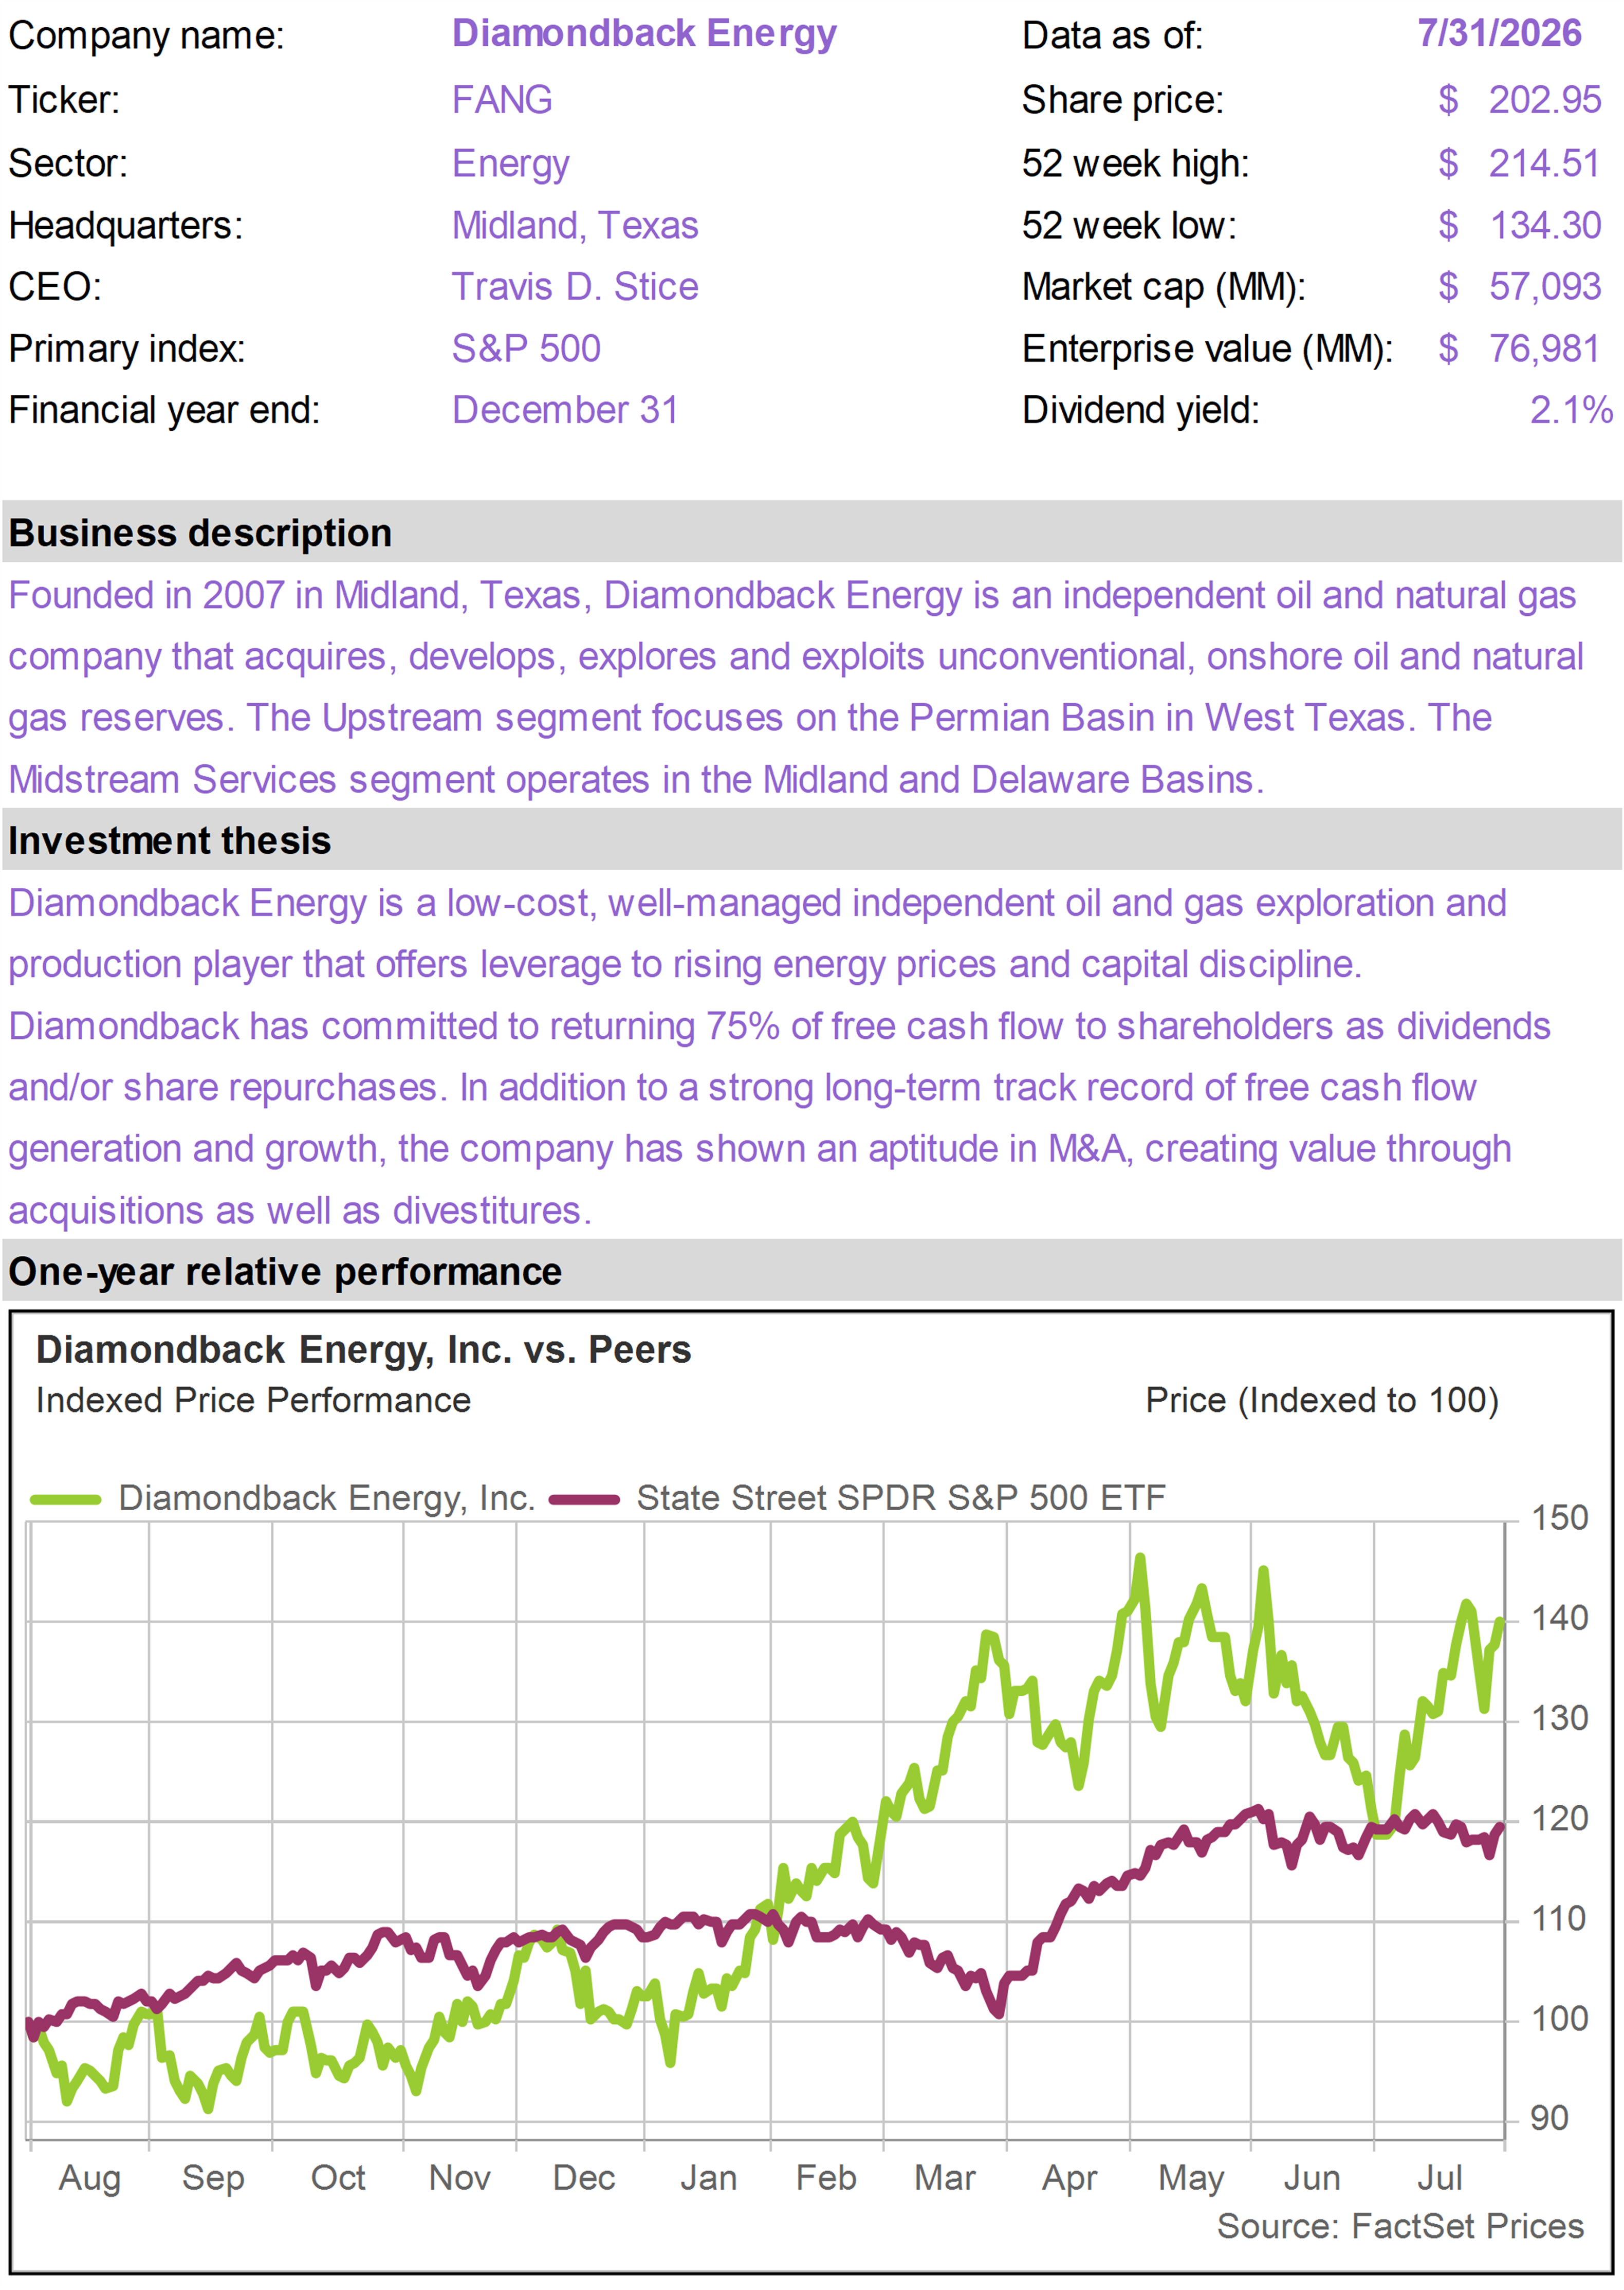
| | PR and FANG both benefited in July from the sharp increase in oil prices.
The two companies have similar investment profiles: large, low-cost Permian Basin inventories, strong operating execution and an emphasis on converting production into free cash flow rather than pursuing growth at any cost.
Both companies are also expected to report strong second quarter earnings this week, reflecting the higher commodity prices that prevailed throughout the quarter.
PR is expected to generate adjusted earnings of approximately $0.57 to $0.60 per share and cash flow per share of roughly $1.39. Oil production is expected to average approximately 195,000 barrels per day, toward the upper end of management’s full-year guidance.
PR’s total production will likely decline sequentially because the company deliberately curtailed natural gas and natural gas liquids output due to weaker pricing in prior quarters. This was a rational economic decision rather than an indication of operational weakness.
The outlook for those volumes should improve during the second half. New pipeline capacity and marketing agreements are expected to provide access to stronger Gulf Coast pricing, turning natural gas from a second quarter headwind into a potential cash-flow tailwind through 2027.
PR also continues to strengthen its balance sheet. The company repaid $550 million of senior notes during the quarter and may retire additional debt during the second half. Its low drilling and completion costs also provide room to pursue smaller Permian acquisitions that can be integrated into the existing portfolio.
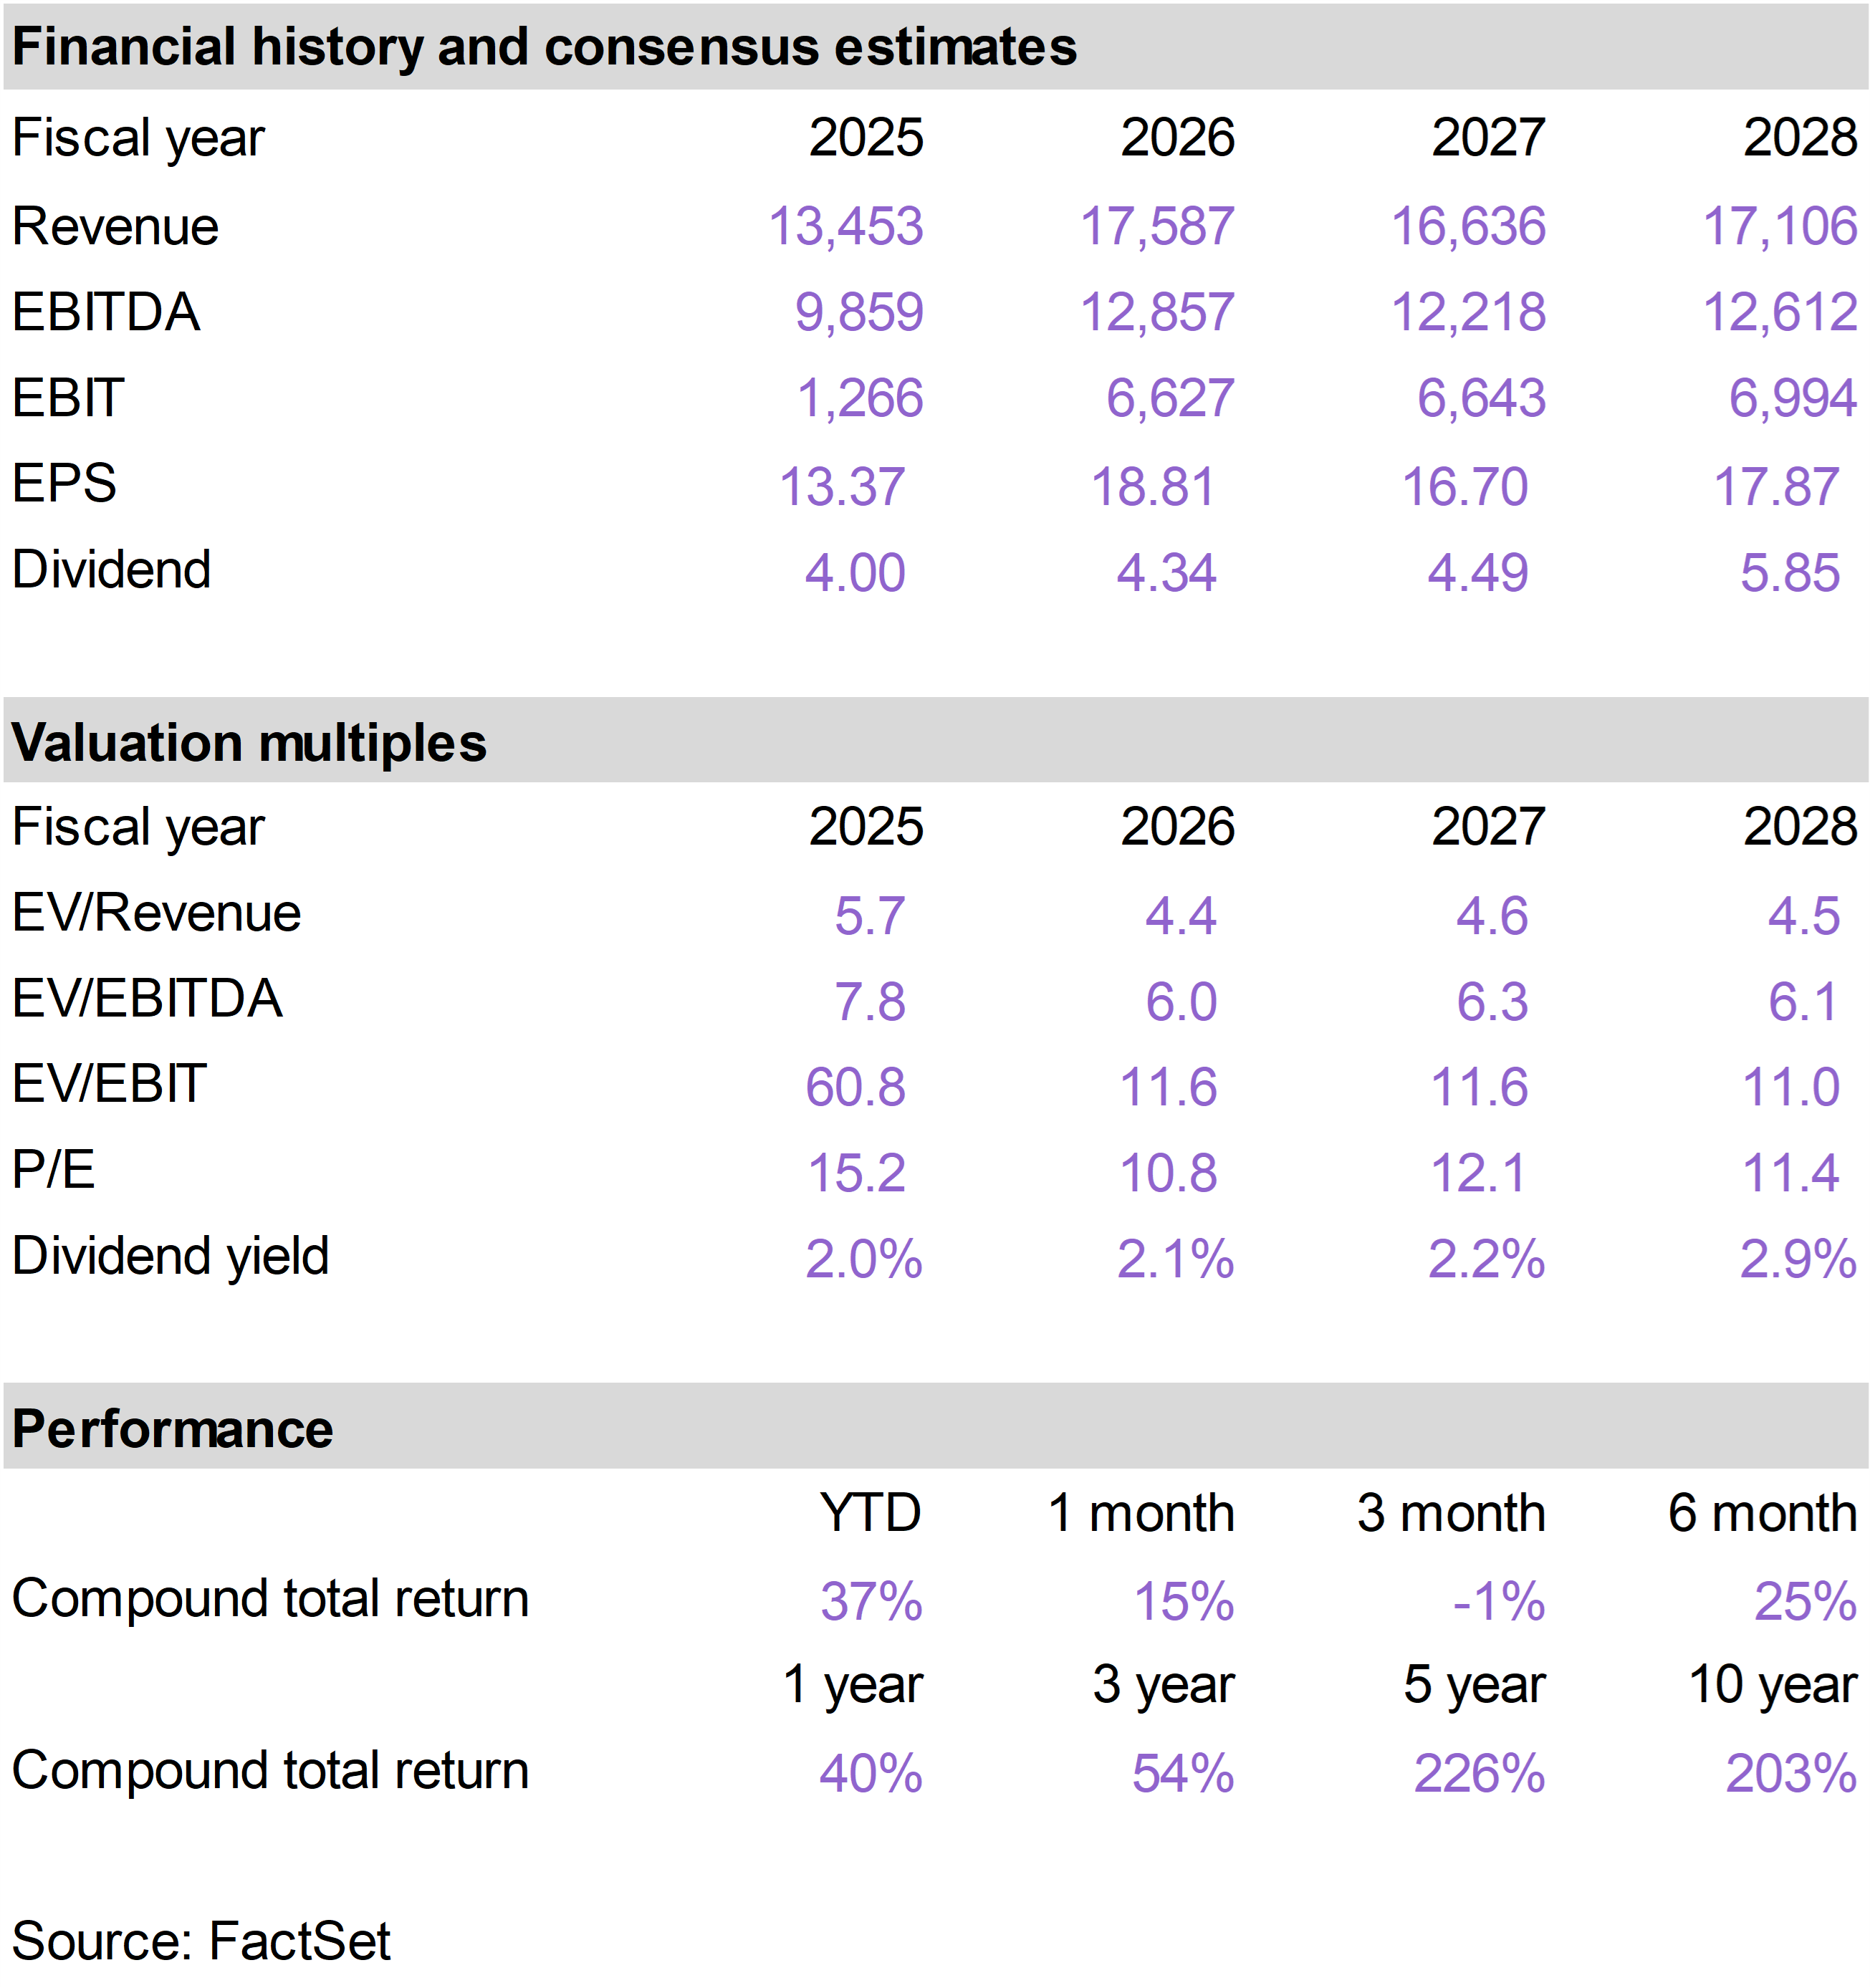
For FANG, consensus estimates now point to adjusted earnings of approximately $5 to $6 per share and record quarterly free cash flow of roughly $2.2 billion.
Oil production is expected to reach approximately 524,000 barrels per day, near the high end of management’s guidance, with total production close to 980,000 barrels of oil equivalent per day.
The expected strength reflects higher oil prices, solid production and continued cost discipline. Importantly, FANG appears capable of increasing output without materially exceeding its capital-spending plan, allowing much of the benefit from stronger oil prices to flow through to earnings and cash generation.
Management is accelerating development of the Barnett acreage, which has the potential to become a more meaningful source of growth. FANG is also expected to reach its $10 billion net debt target during the third quarter, creating greater flexibility for debt reduction, dividends and opportunistic share repurchases.
The investment cases are therefore closely aligned. Higher oil prices should produce strong near-term earnings, while efficient operations and disciplined capital spending allow both companies to convert a substantial portion of those earnings into free cash flow.
PR offers particularly low operating costs, attractive bolt-on acquisition opportunities and meaningful upside as regional natural-gas pricing improves. FANG offers greater scale, a rapidly improving balance sheet and emerging growth from the Barnett.
Both remain well positioned, especially if oil prices remain elevated. |
|
| |
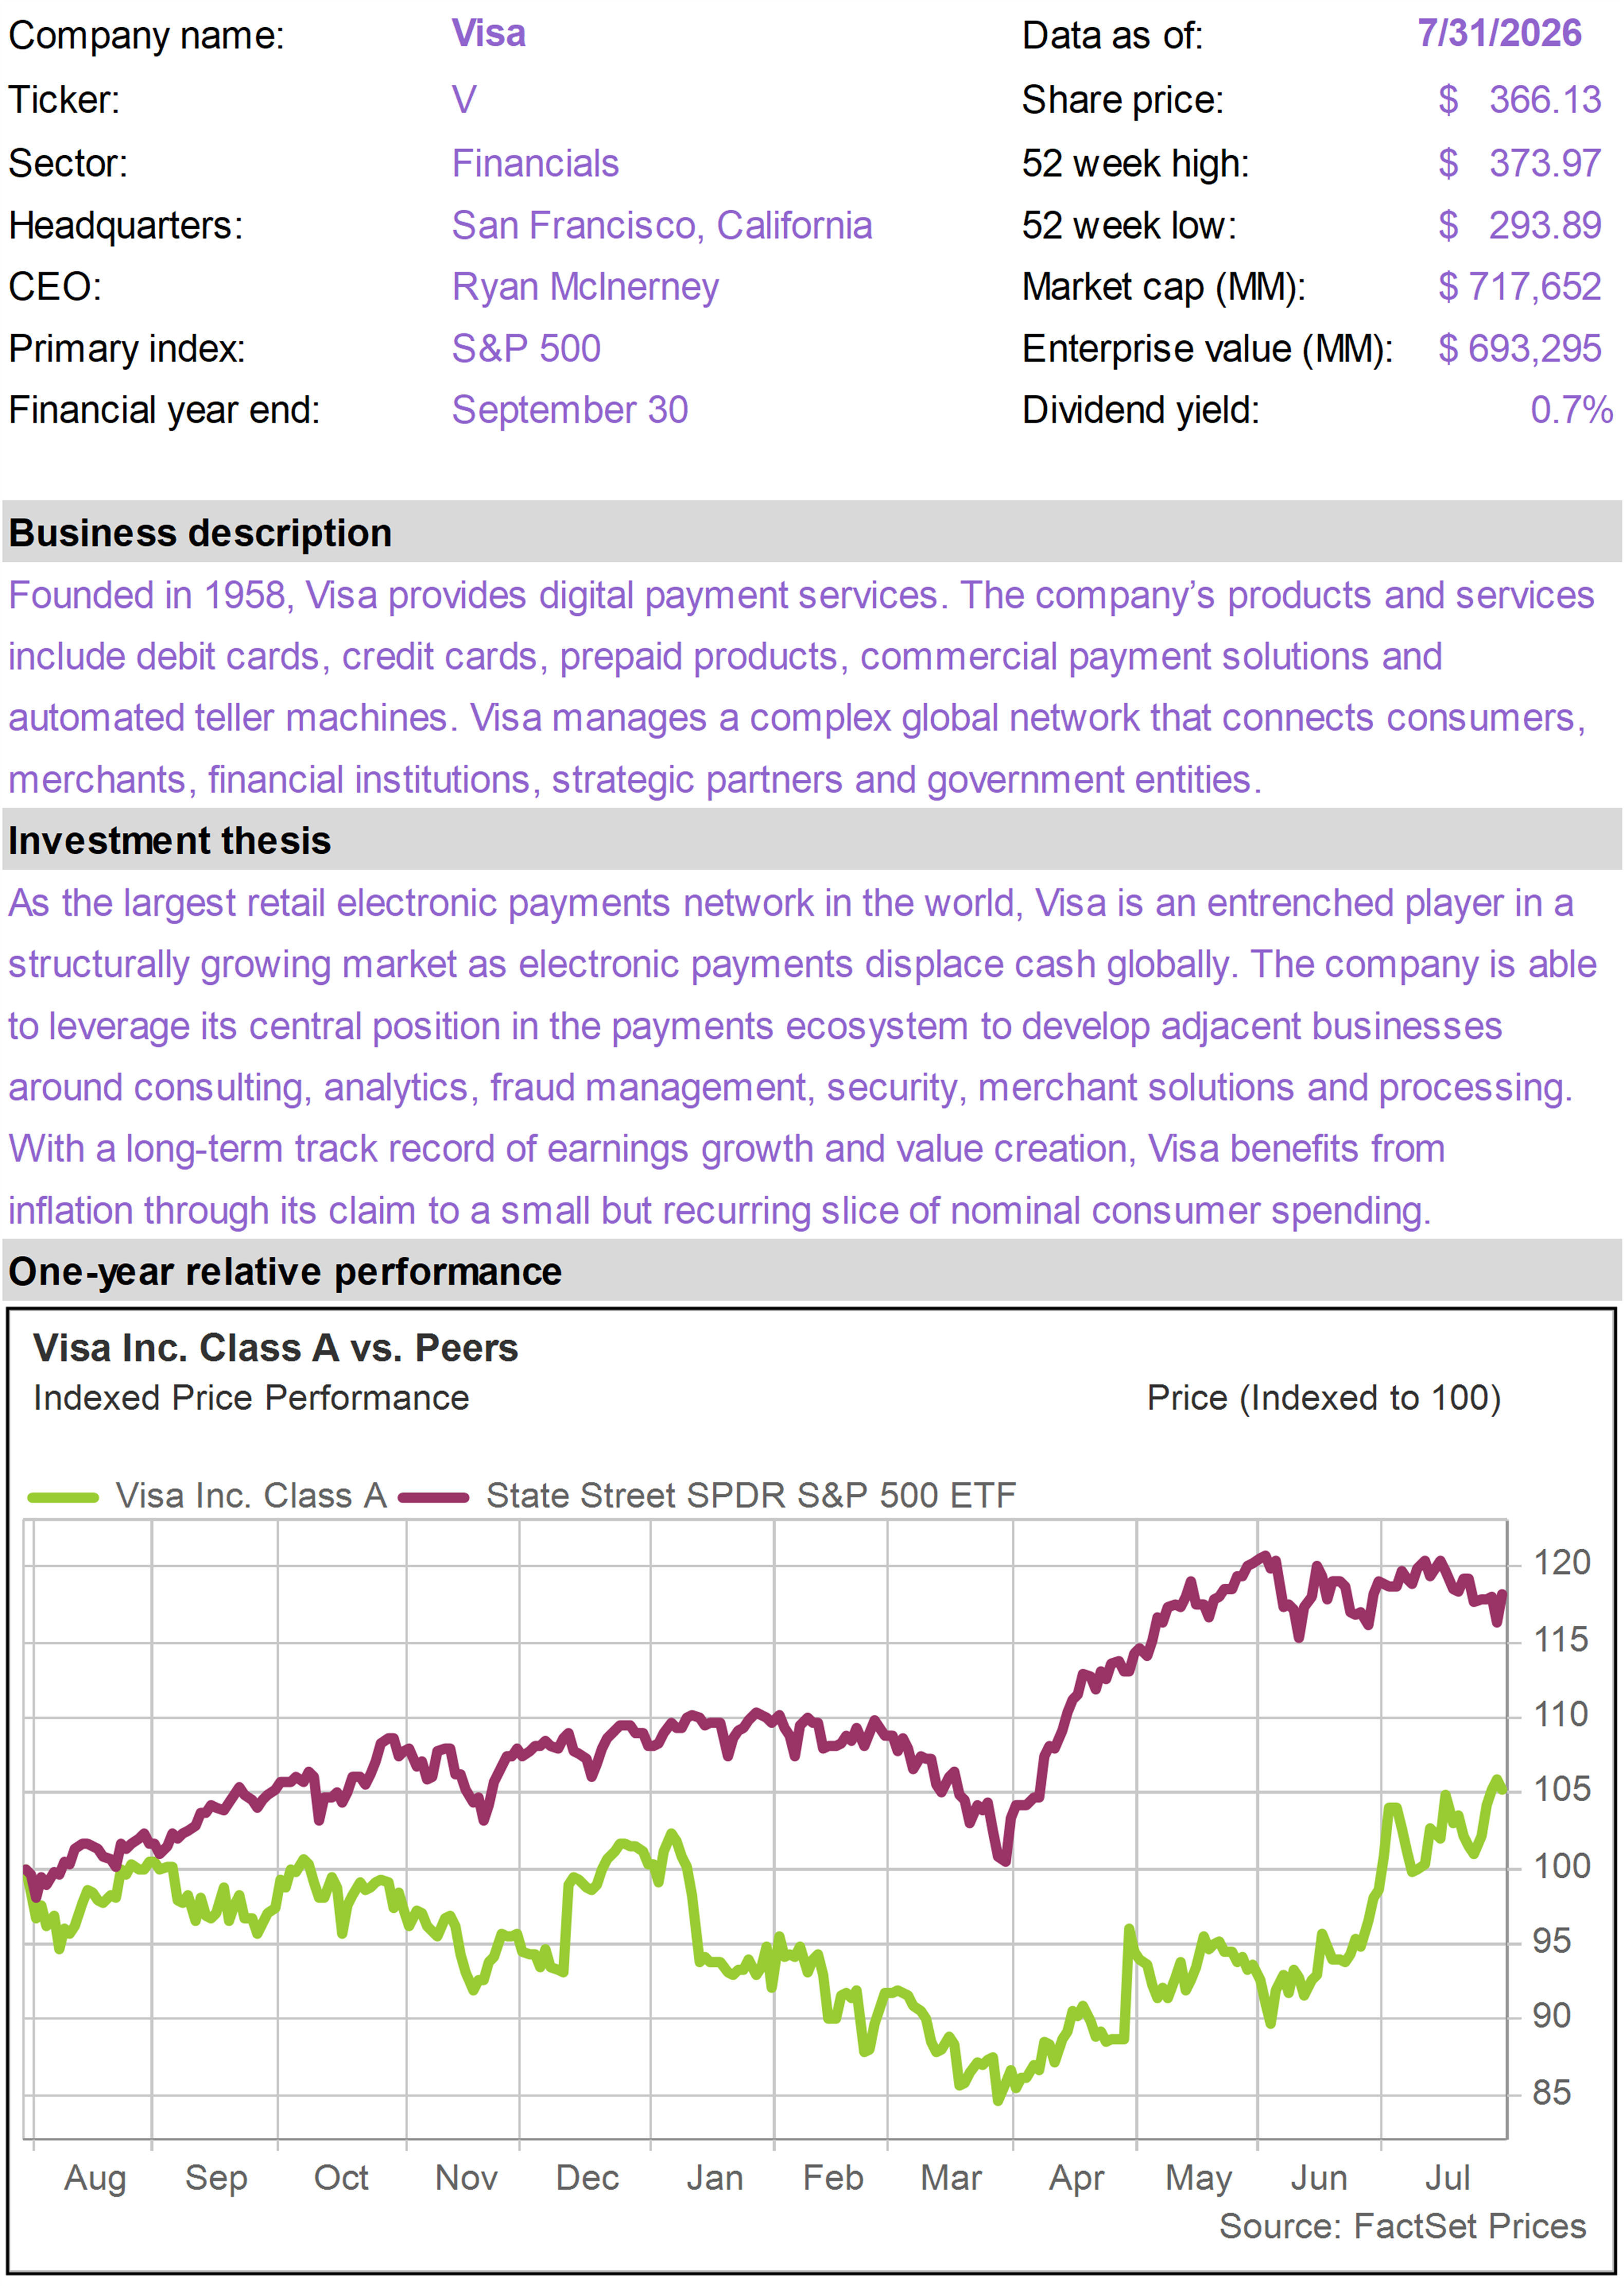
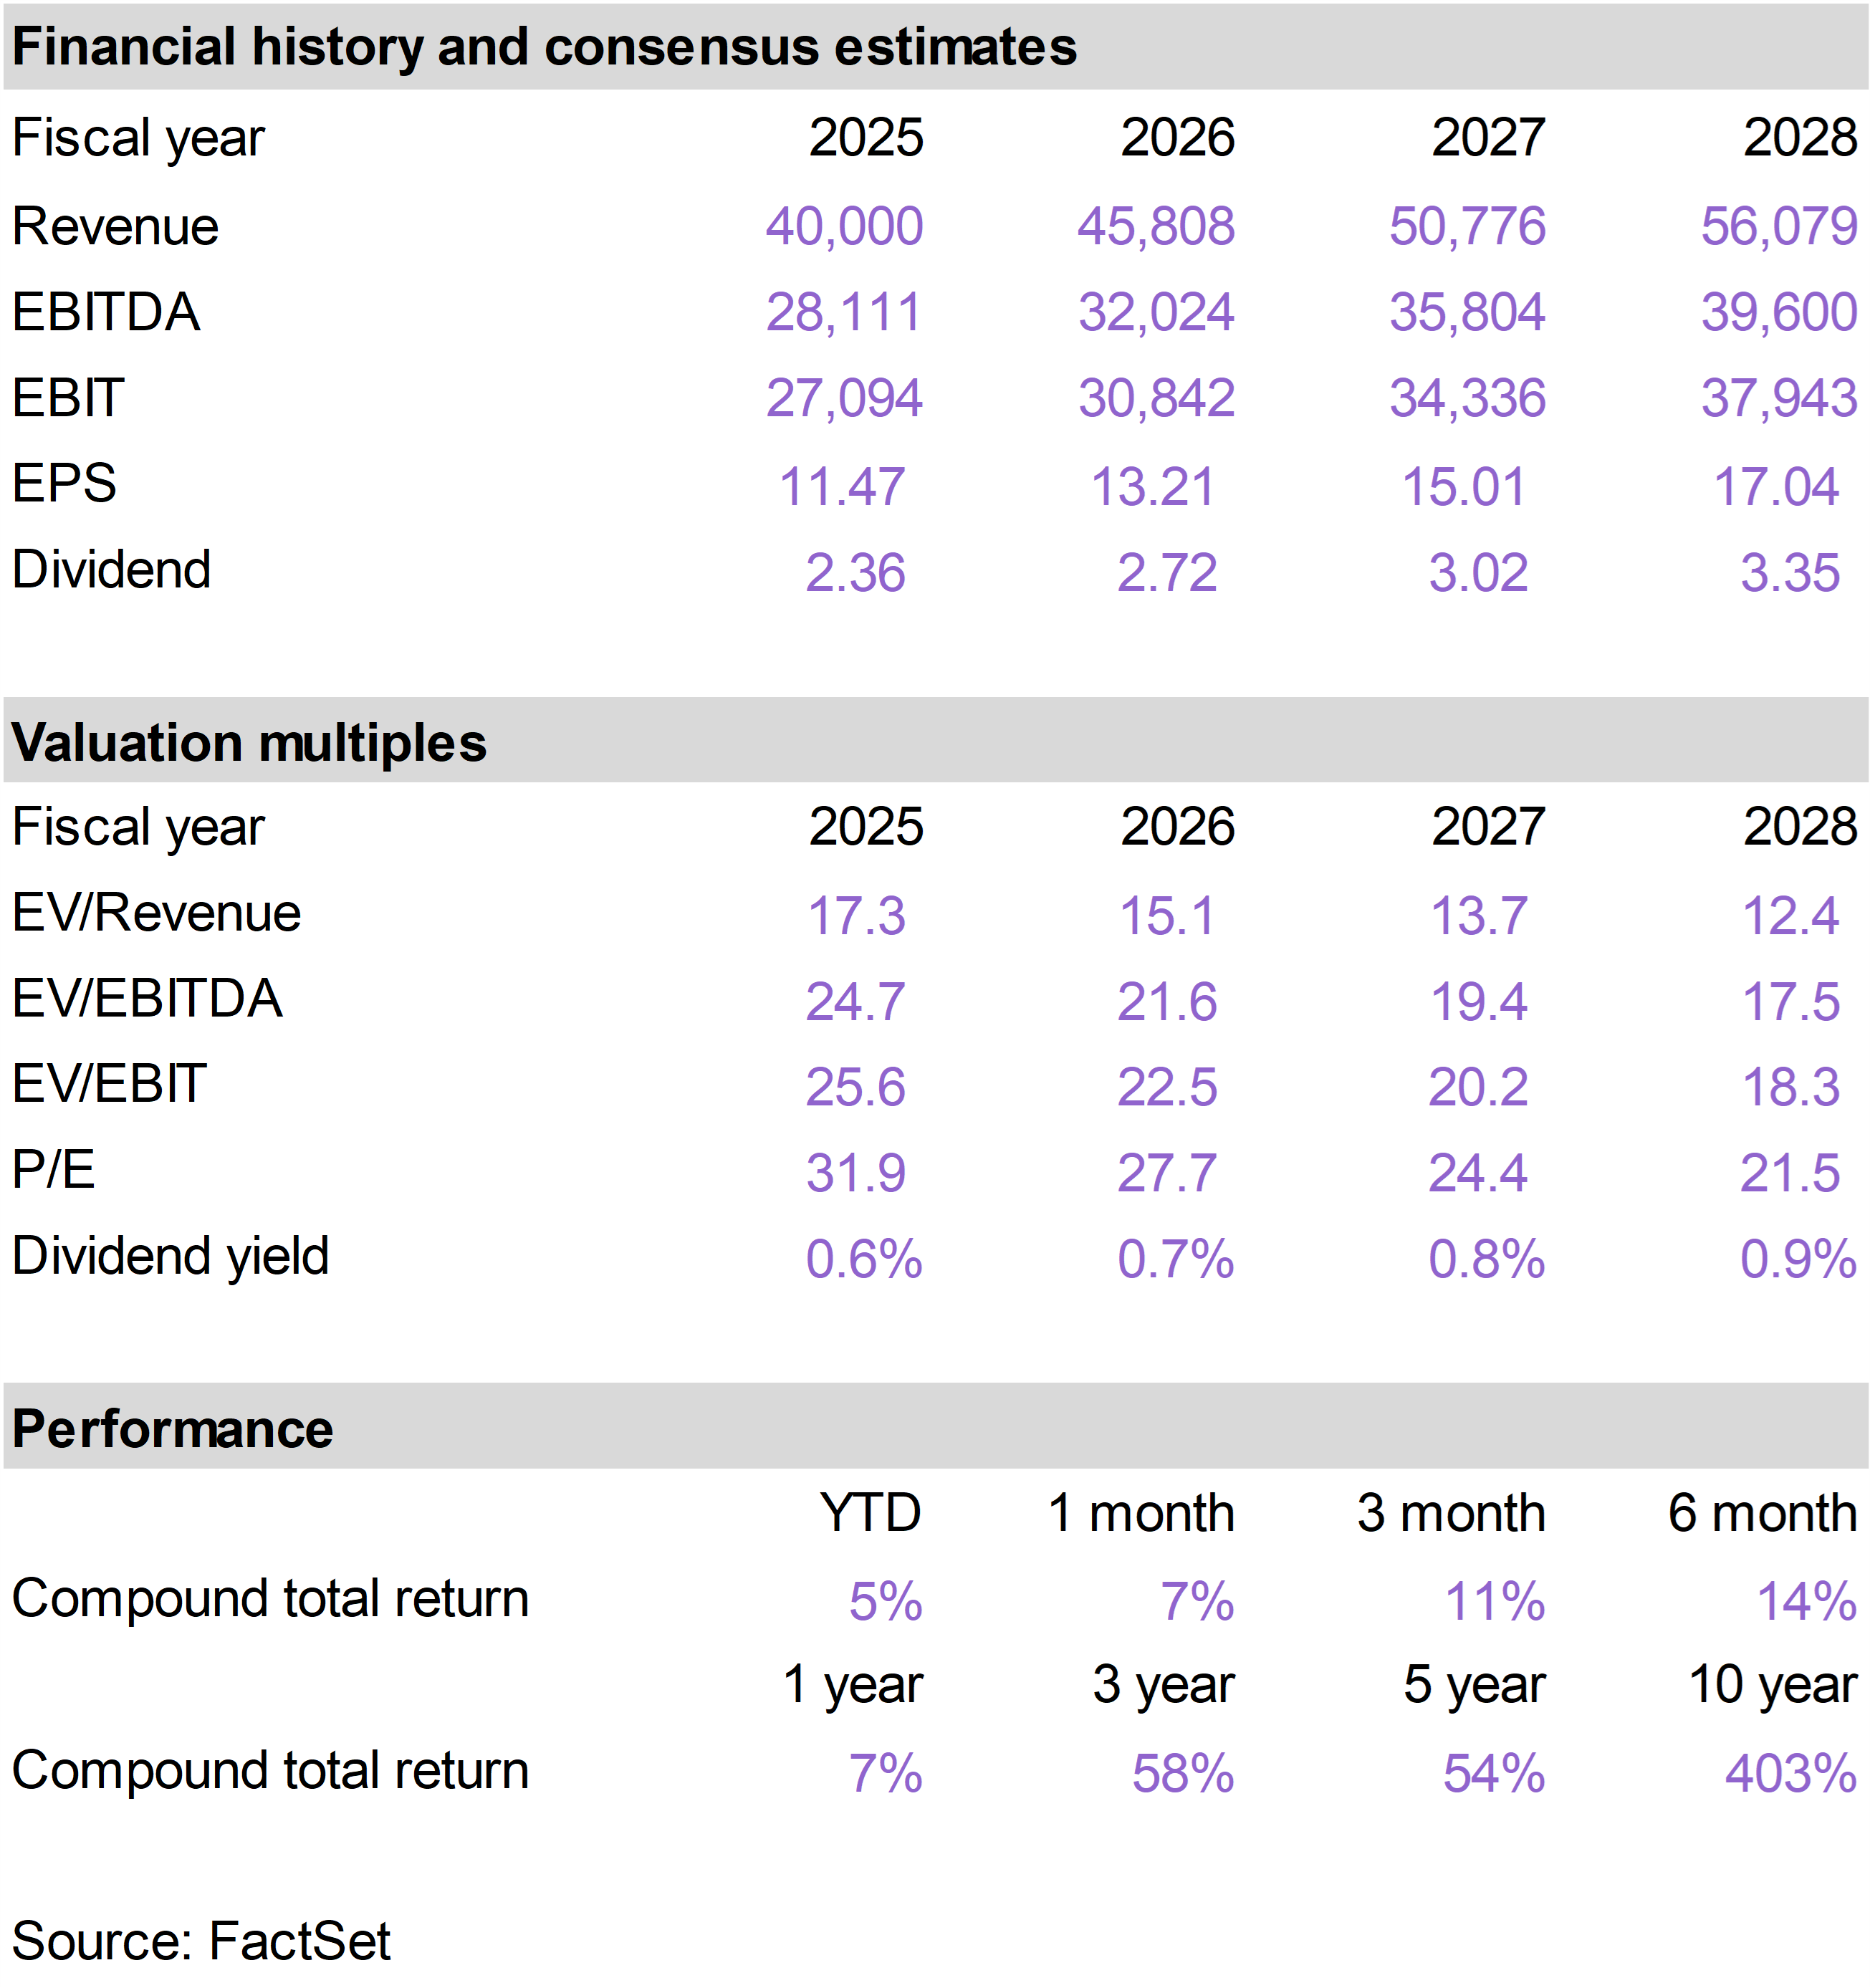
Shares of V performed well in July after the company reported strong fiscal third-quarter results that reinforced the durability of consumer spending and the long-term growth outlook.
Revenue increased approximately 13% on a constant-currency basis, while adjusted earnings per share rose 11% to $3.32 and exceeded expectations. The company also raised its full-year revenue outlook and slightly increased its expectation for organic, constant-currency earnings growth.
Consumer activity remained healthy despite elevated interest rates and geopolitical uncertainty.
U.S. payment volume increased approximately 10%, while cross-border volume excluding transactions within Europe rose roughly 12%. Notably, management reported no meaningful deterioration among lower-income consumers.
The Value-Added Services business was the quarter’s standout with revenue growth of 34%. Issuing, acceptance, and risk and security products have each generated growth above 20% for four consecutive quarters.
The results were especially encouraging given investor concerns about stablecoins, account-to-account payment systems and AI-enabled commerce.
We continue to believe these developments are more likely to expand V’s opportunity than undermine it. Most consumer transactions initiated by AI agents will still require secure payment credentials, fraud protection and global acceptance. V is also building infrastructure to participate in stablecoin settlement and cross-border business payments.
Alternative payment networks may gain share in certain markets, but they generally lack V’s global reach, transaction data and sophisticated risk-management capabilities. These advantages become more valuable—not less—as payments become increasingly automated.
V also announced a workforce reduction concentrated largely in technology and product roles. While the decision produced a sizable severance charge, it reflects an effort to improve efficiency and redirect investment toward the company’s highest-growth opportunities.
V continues to benefit from the global migration from cash to electronic payments, resilient consumer spending, cross-border travel and rapid growth in value-added services.
Strong payment volumes, accelerating service revenue and higher guidance demonstrated that the company remains capable of generating double-digit revenue growth and mid-teens earnings growth despite an uncertain macroeconomic environment. |
|
| |
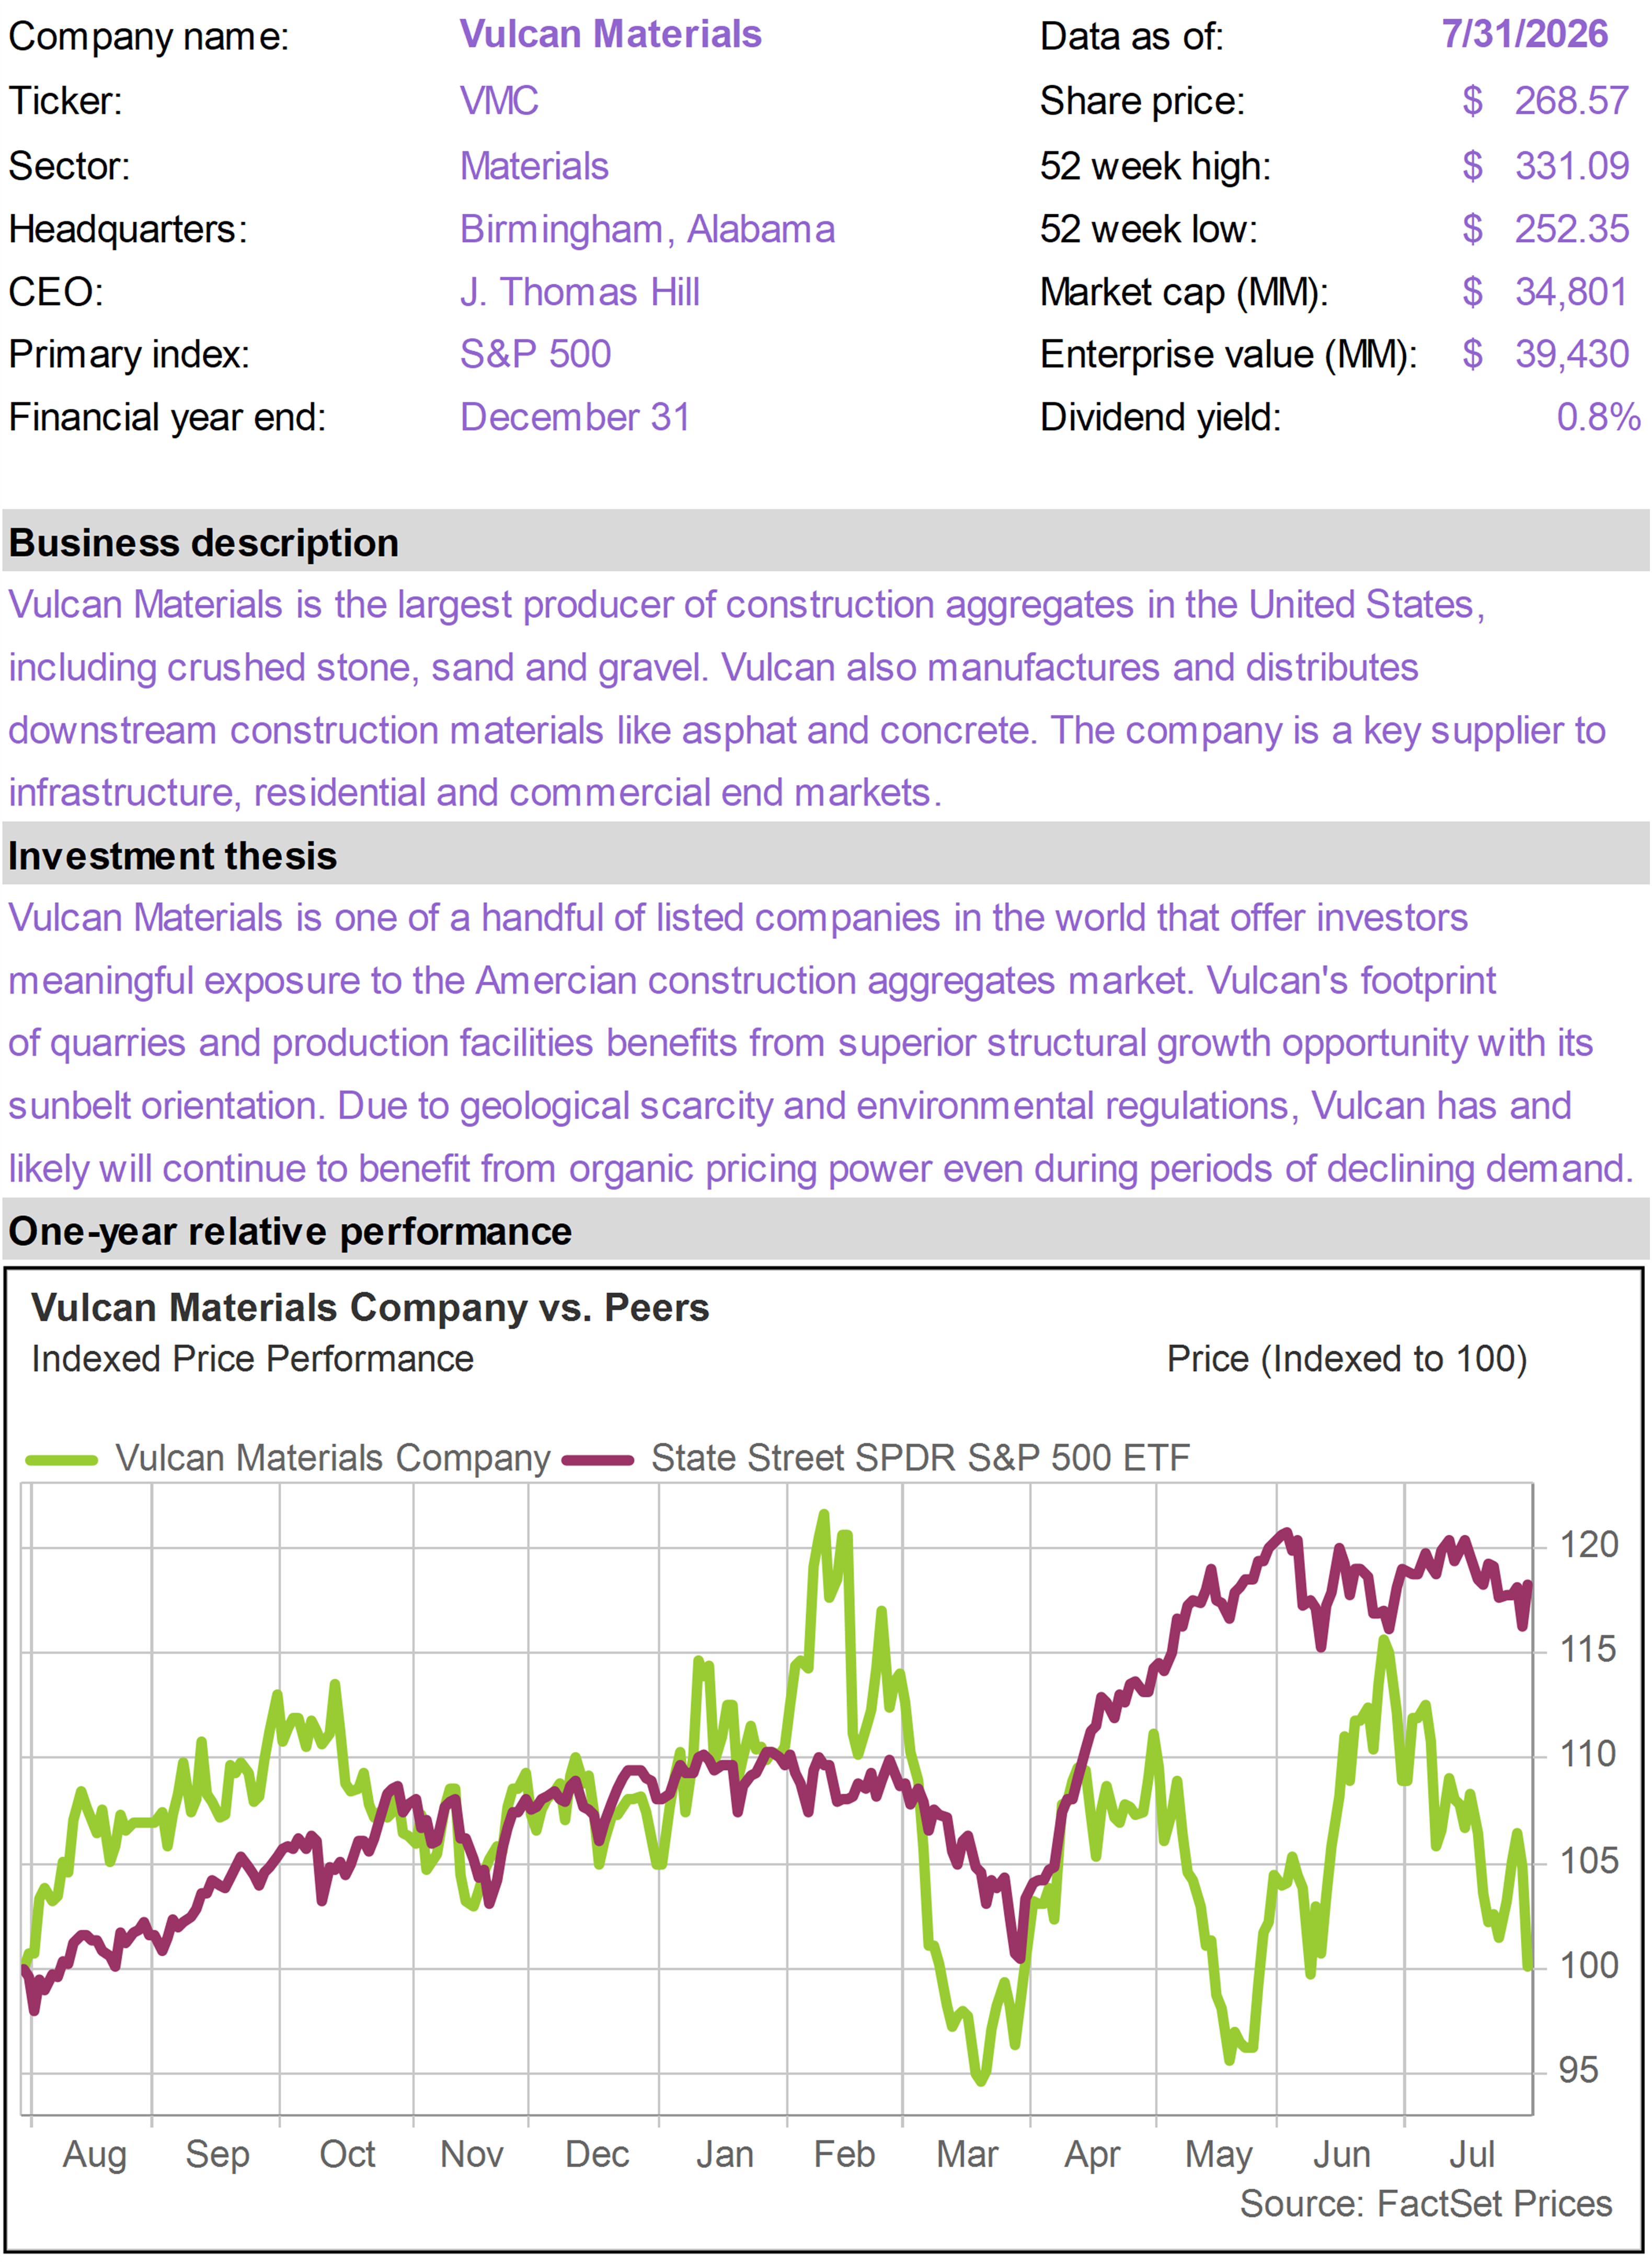
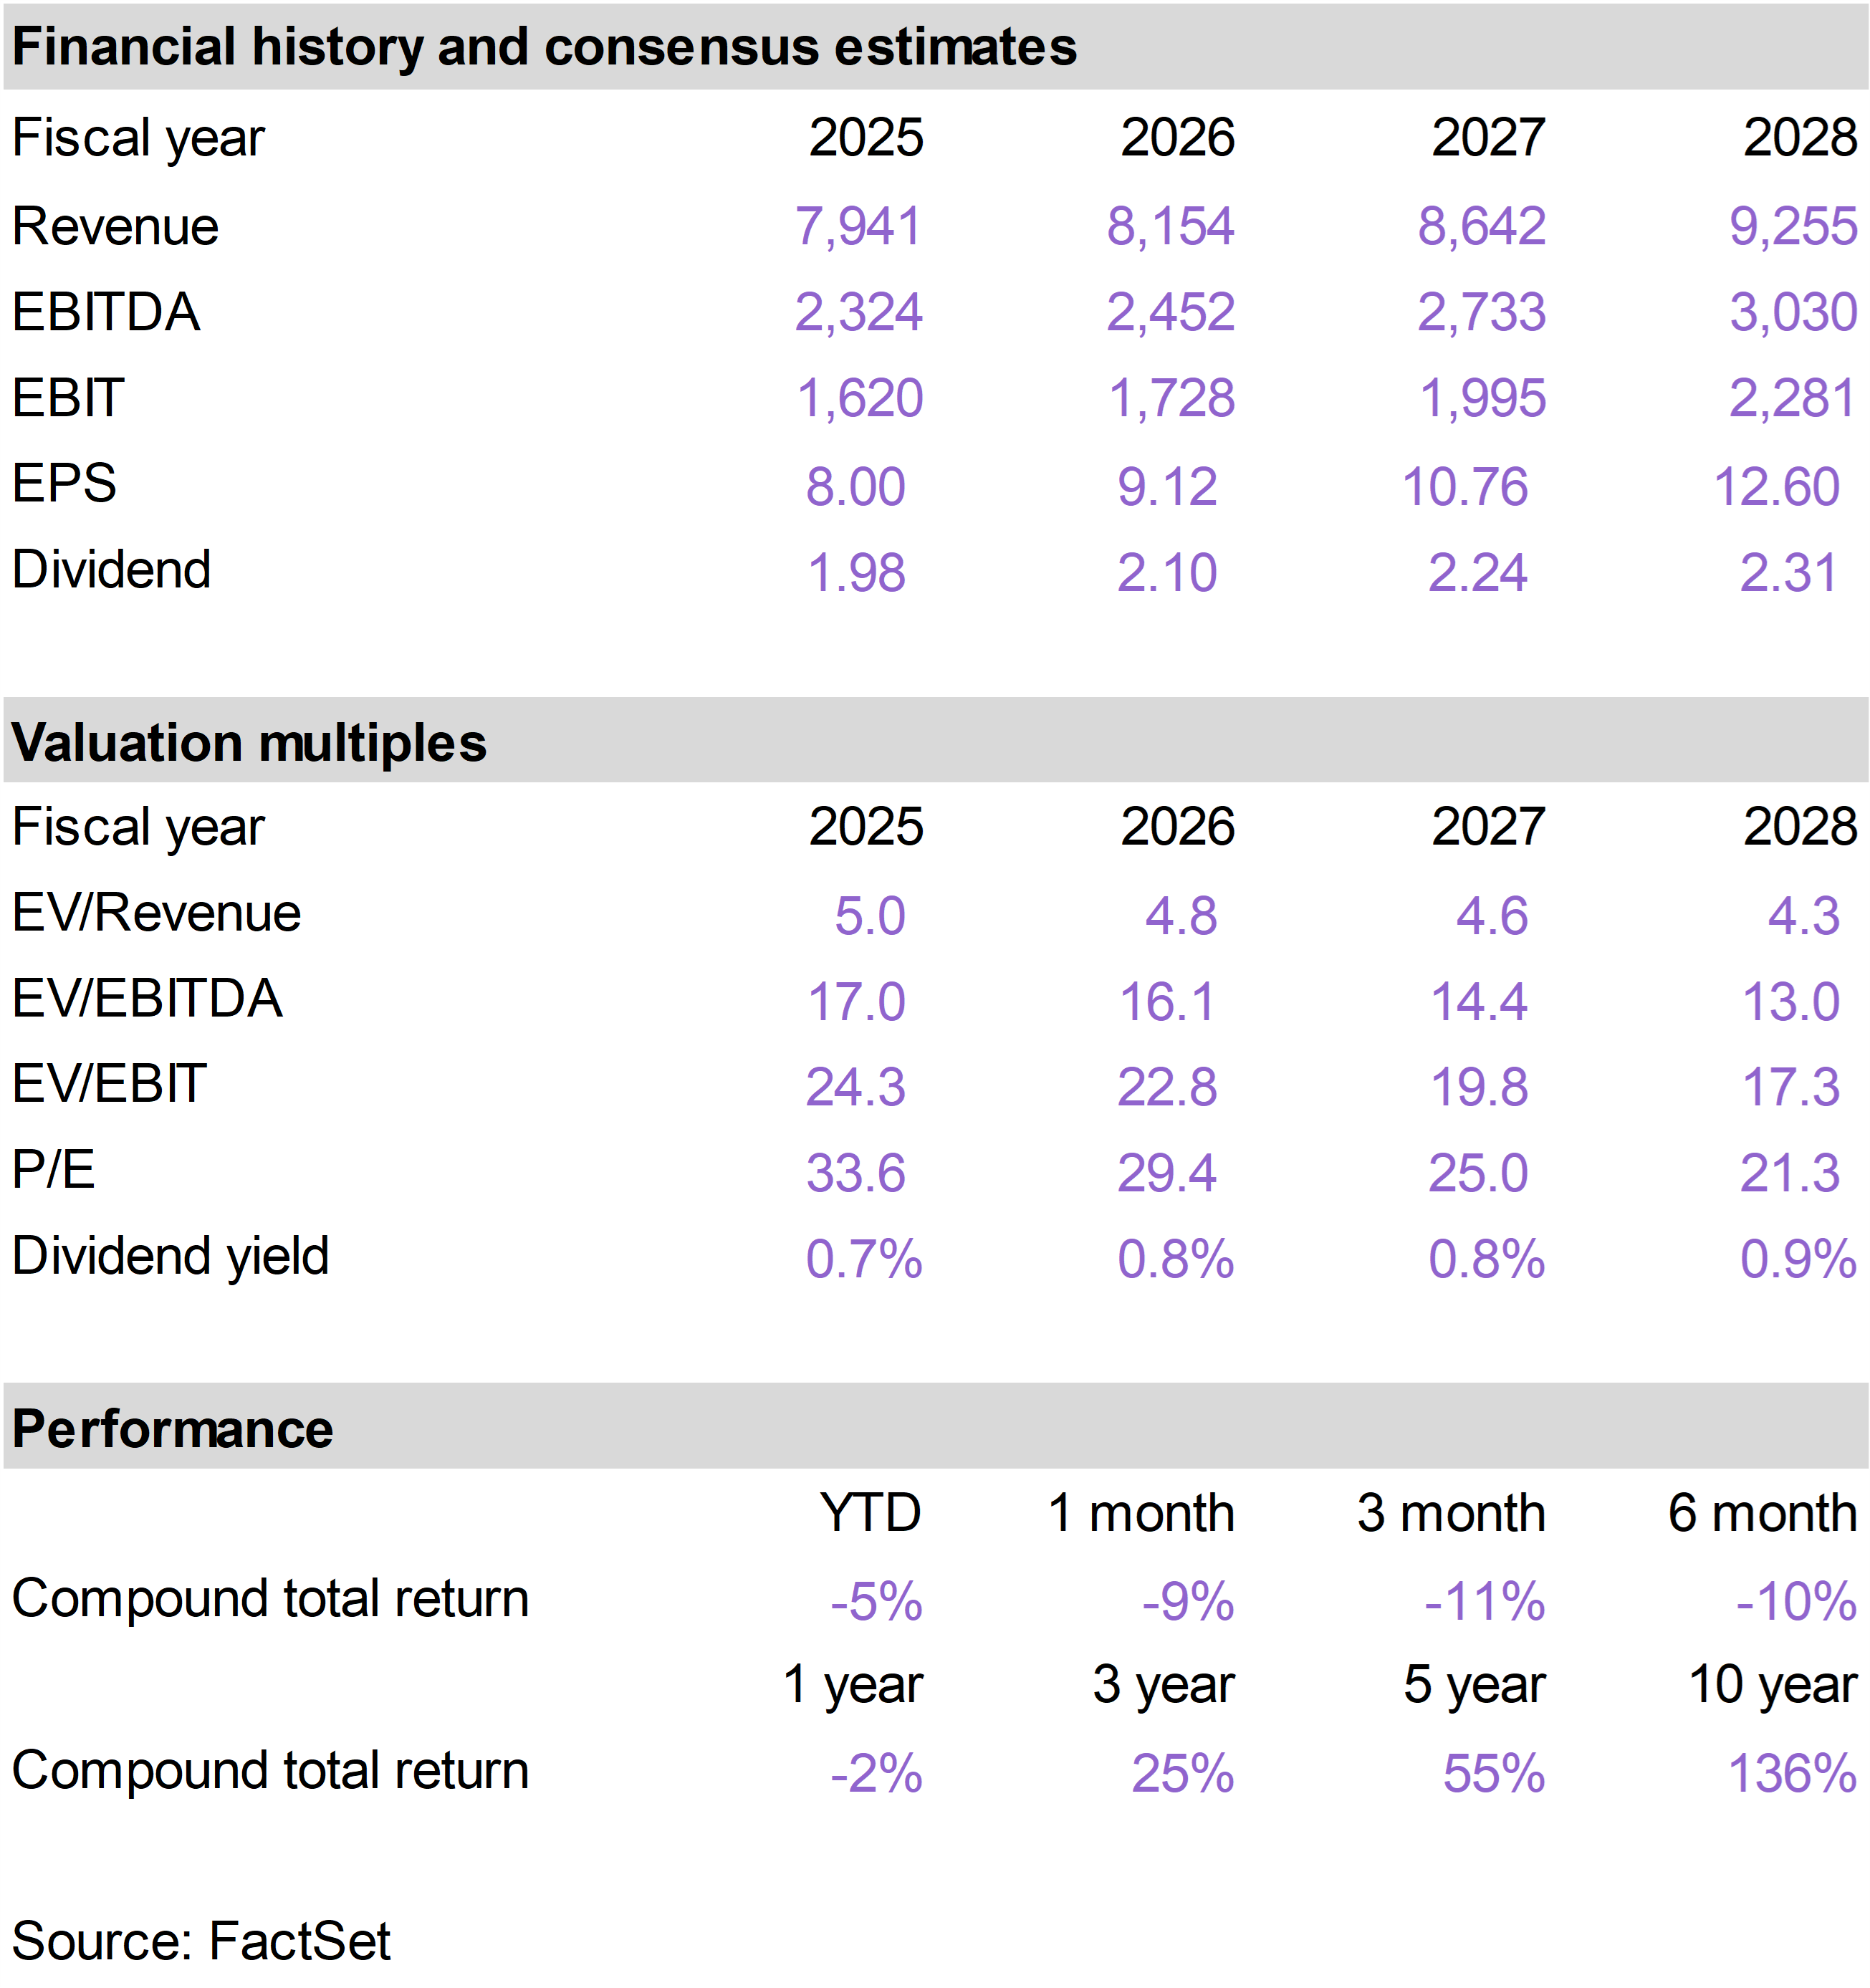
VMC declined in July, with much of the weakness occurring around its second quarter earnings report and the resolution of its long-running dispute with Mexico.
Second quarter revenue increased approximately 3% to $2.16 billion, exceeding expectations, while adjusted earnings rose to $2.59 per share. Aggregates shipments increased 1%, despite heavy rainfall in Texas and several southeastern markets.
Pricing remained the most important strength. Mix-adjusted aggregates prices increased 5%, while cash gross profit per ton exceeded $12 and improved from the prior year.
Adjusted EBITDA was approximately unchanged at $654 million despite nearly $40 million of energy-related headwinds. Management reiterated its full-year adjusted EBITDA guidance of $2.4 billion to $2.6 billion.
The negative market reaction likely reflected the absence of an upward guidance revision, along with continued concern about elevated diesel costs, weak residential construction and the timing of shipment growth.
The results were solid, but investors appeared to want clearer evidence that pricing and improving demand would produce stronger second-half earnings.
The disappointing outcome of VMC’s arbitration against Mexico also weighed on sentiment. The tribunal found that Mexico had violated NAFTA in several respects but awarded only negligible damages, eliminating a potential recovery that some investors had viewed as a source of upside.
The underlying outlook remains constructive. Public infrastructure awards in the company’s markets are up approximately 20%, while highway awards are growing at a double-digit rate.
Data centers, power infrastructure, LNG facilities and manufacturing projects are also creating significant aggregates demand.
VMC’s strong pricing power, scarce quarry assets and attractive Sunbelt footprint remain central to the investment thesis. Near-term fuel and weather pressures may create earnings volatility, but the company is well positioned to benefit as infrastructure and large private projects translate into higher shipments. |
|
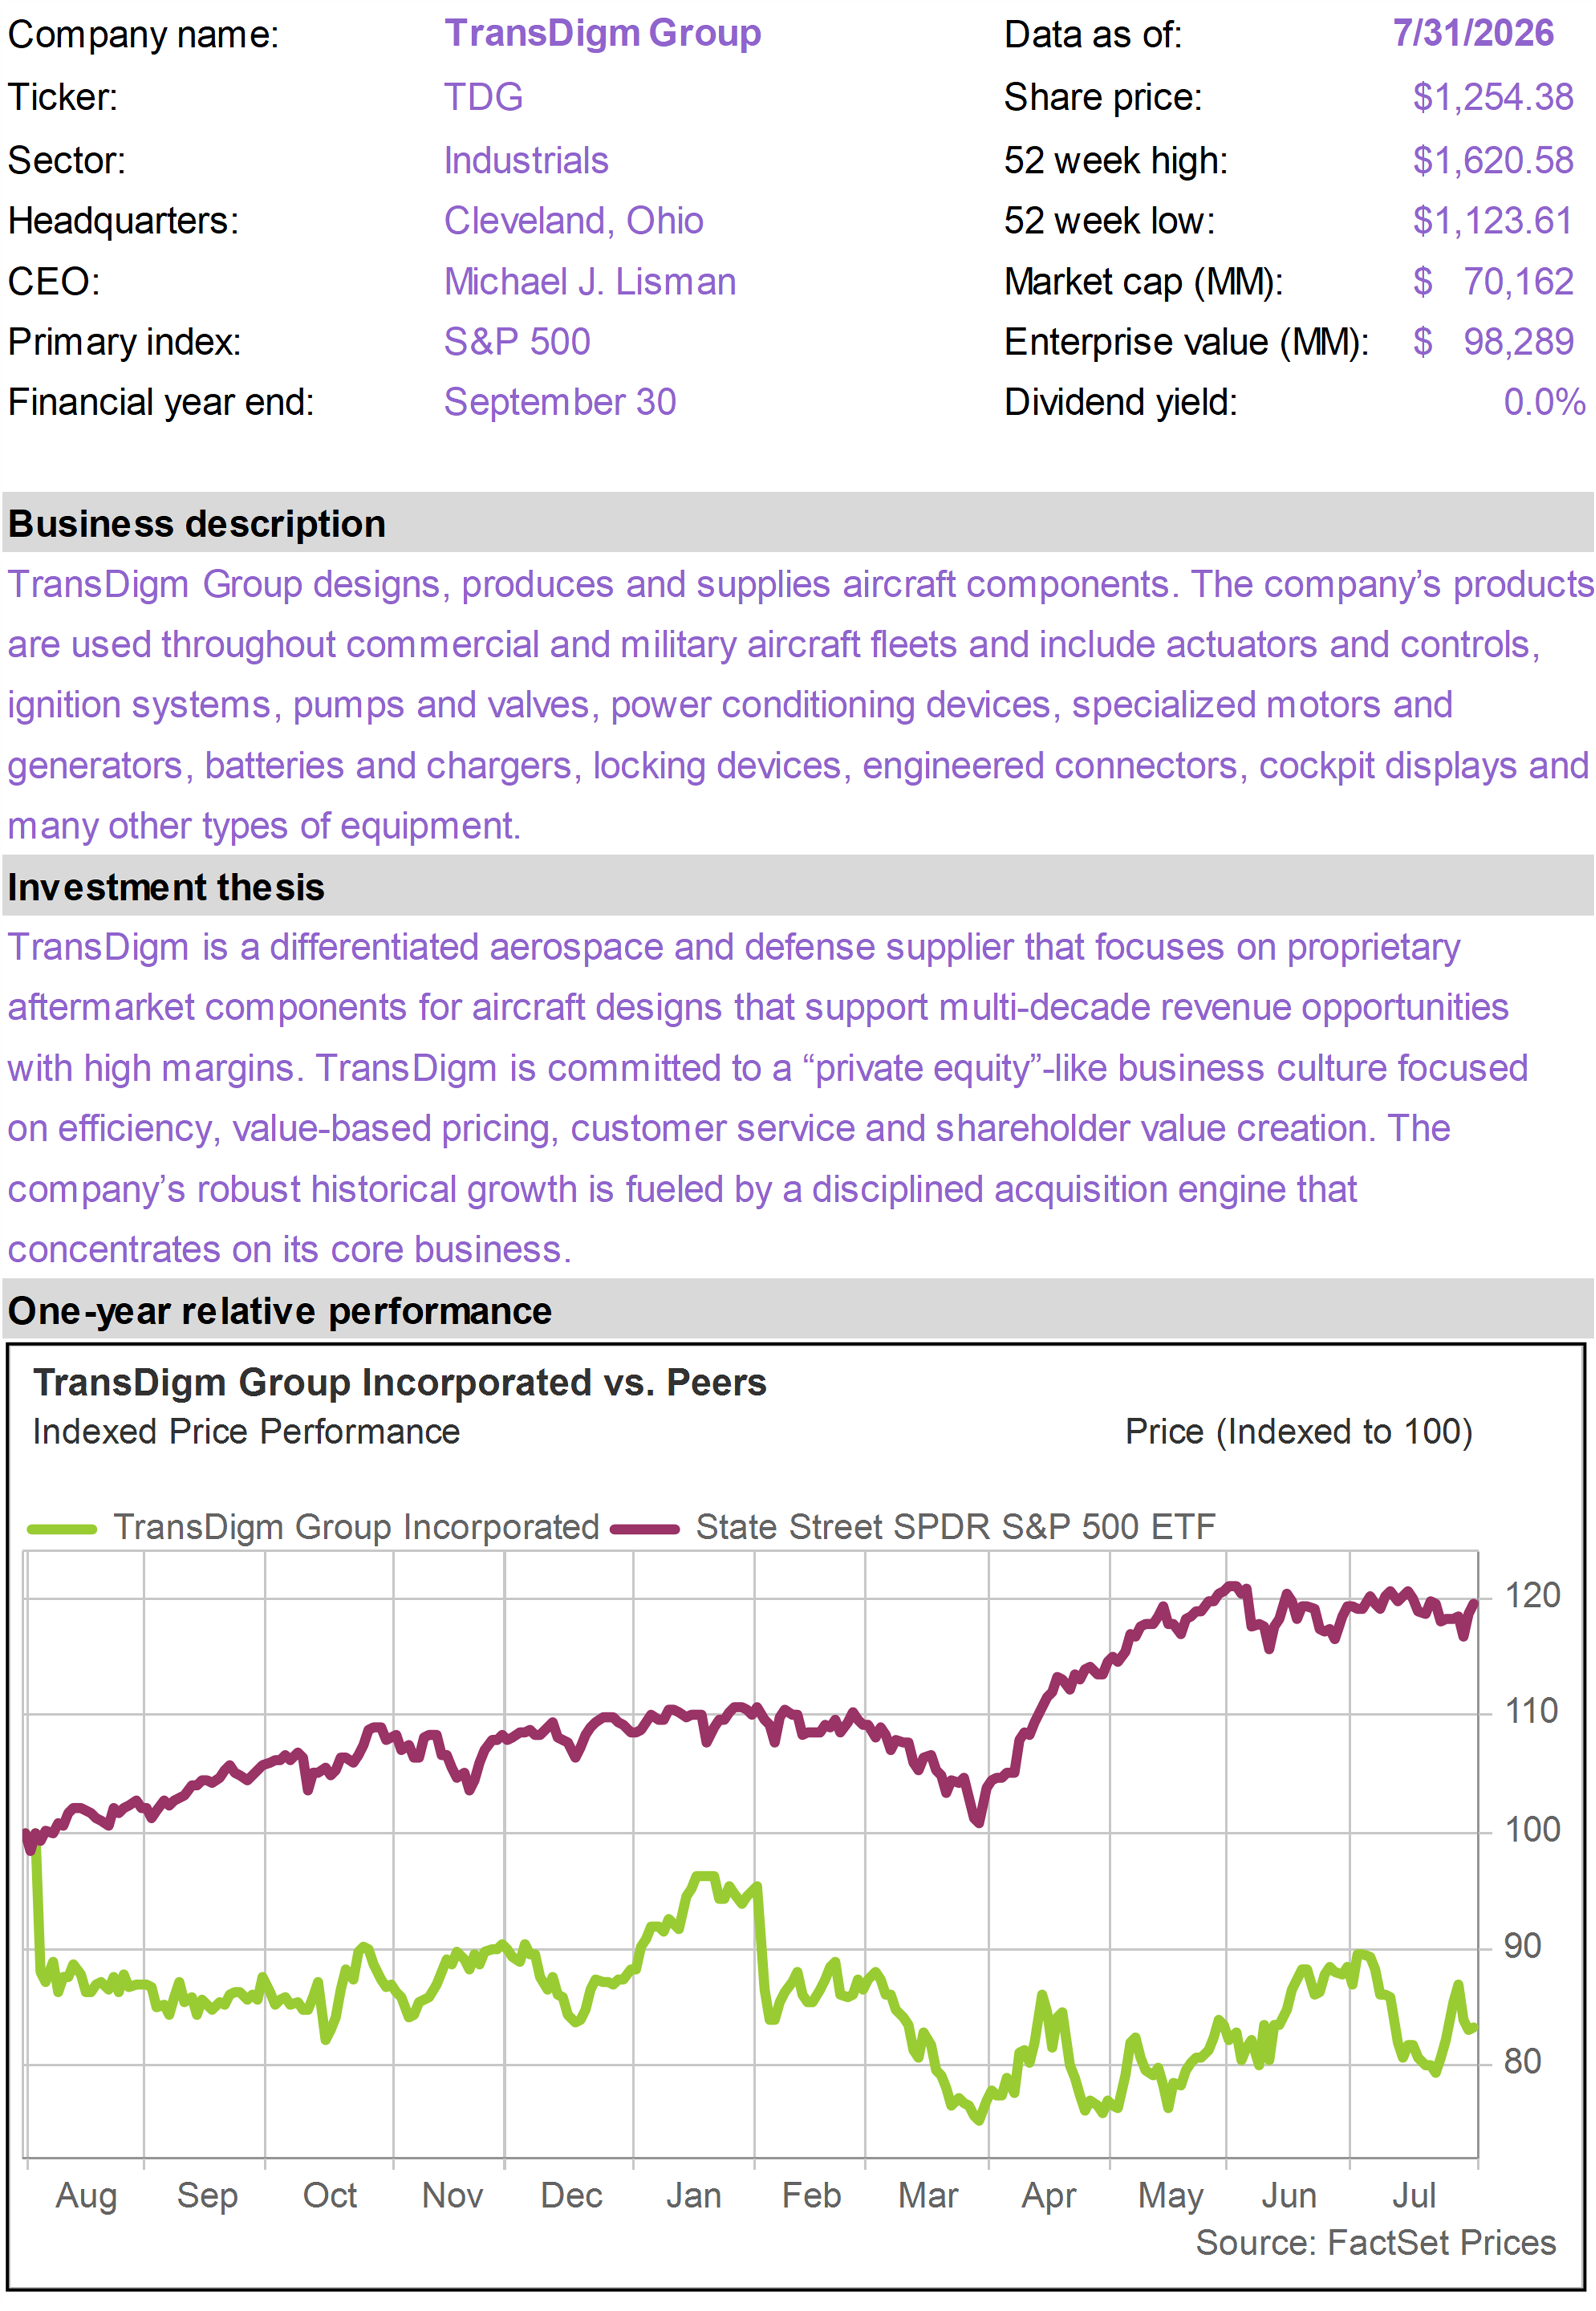
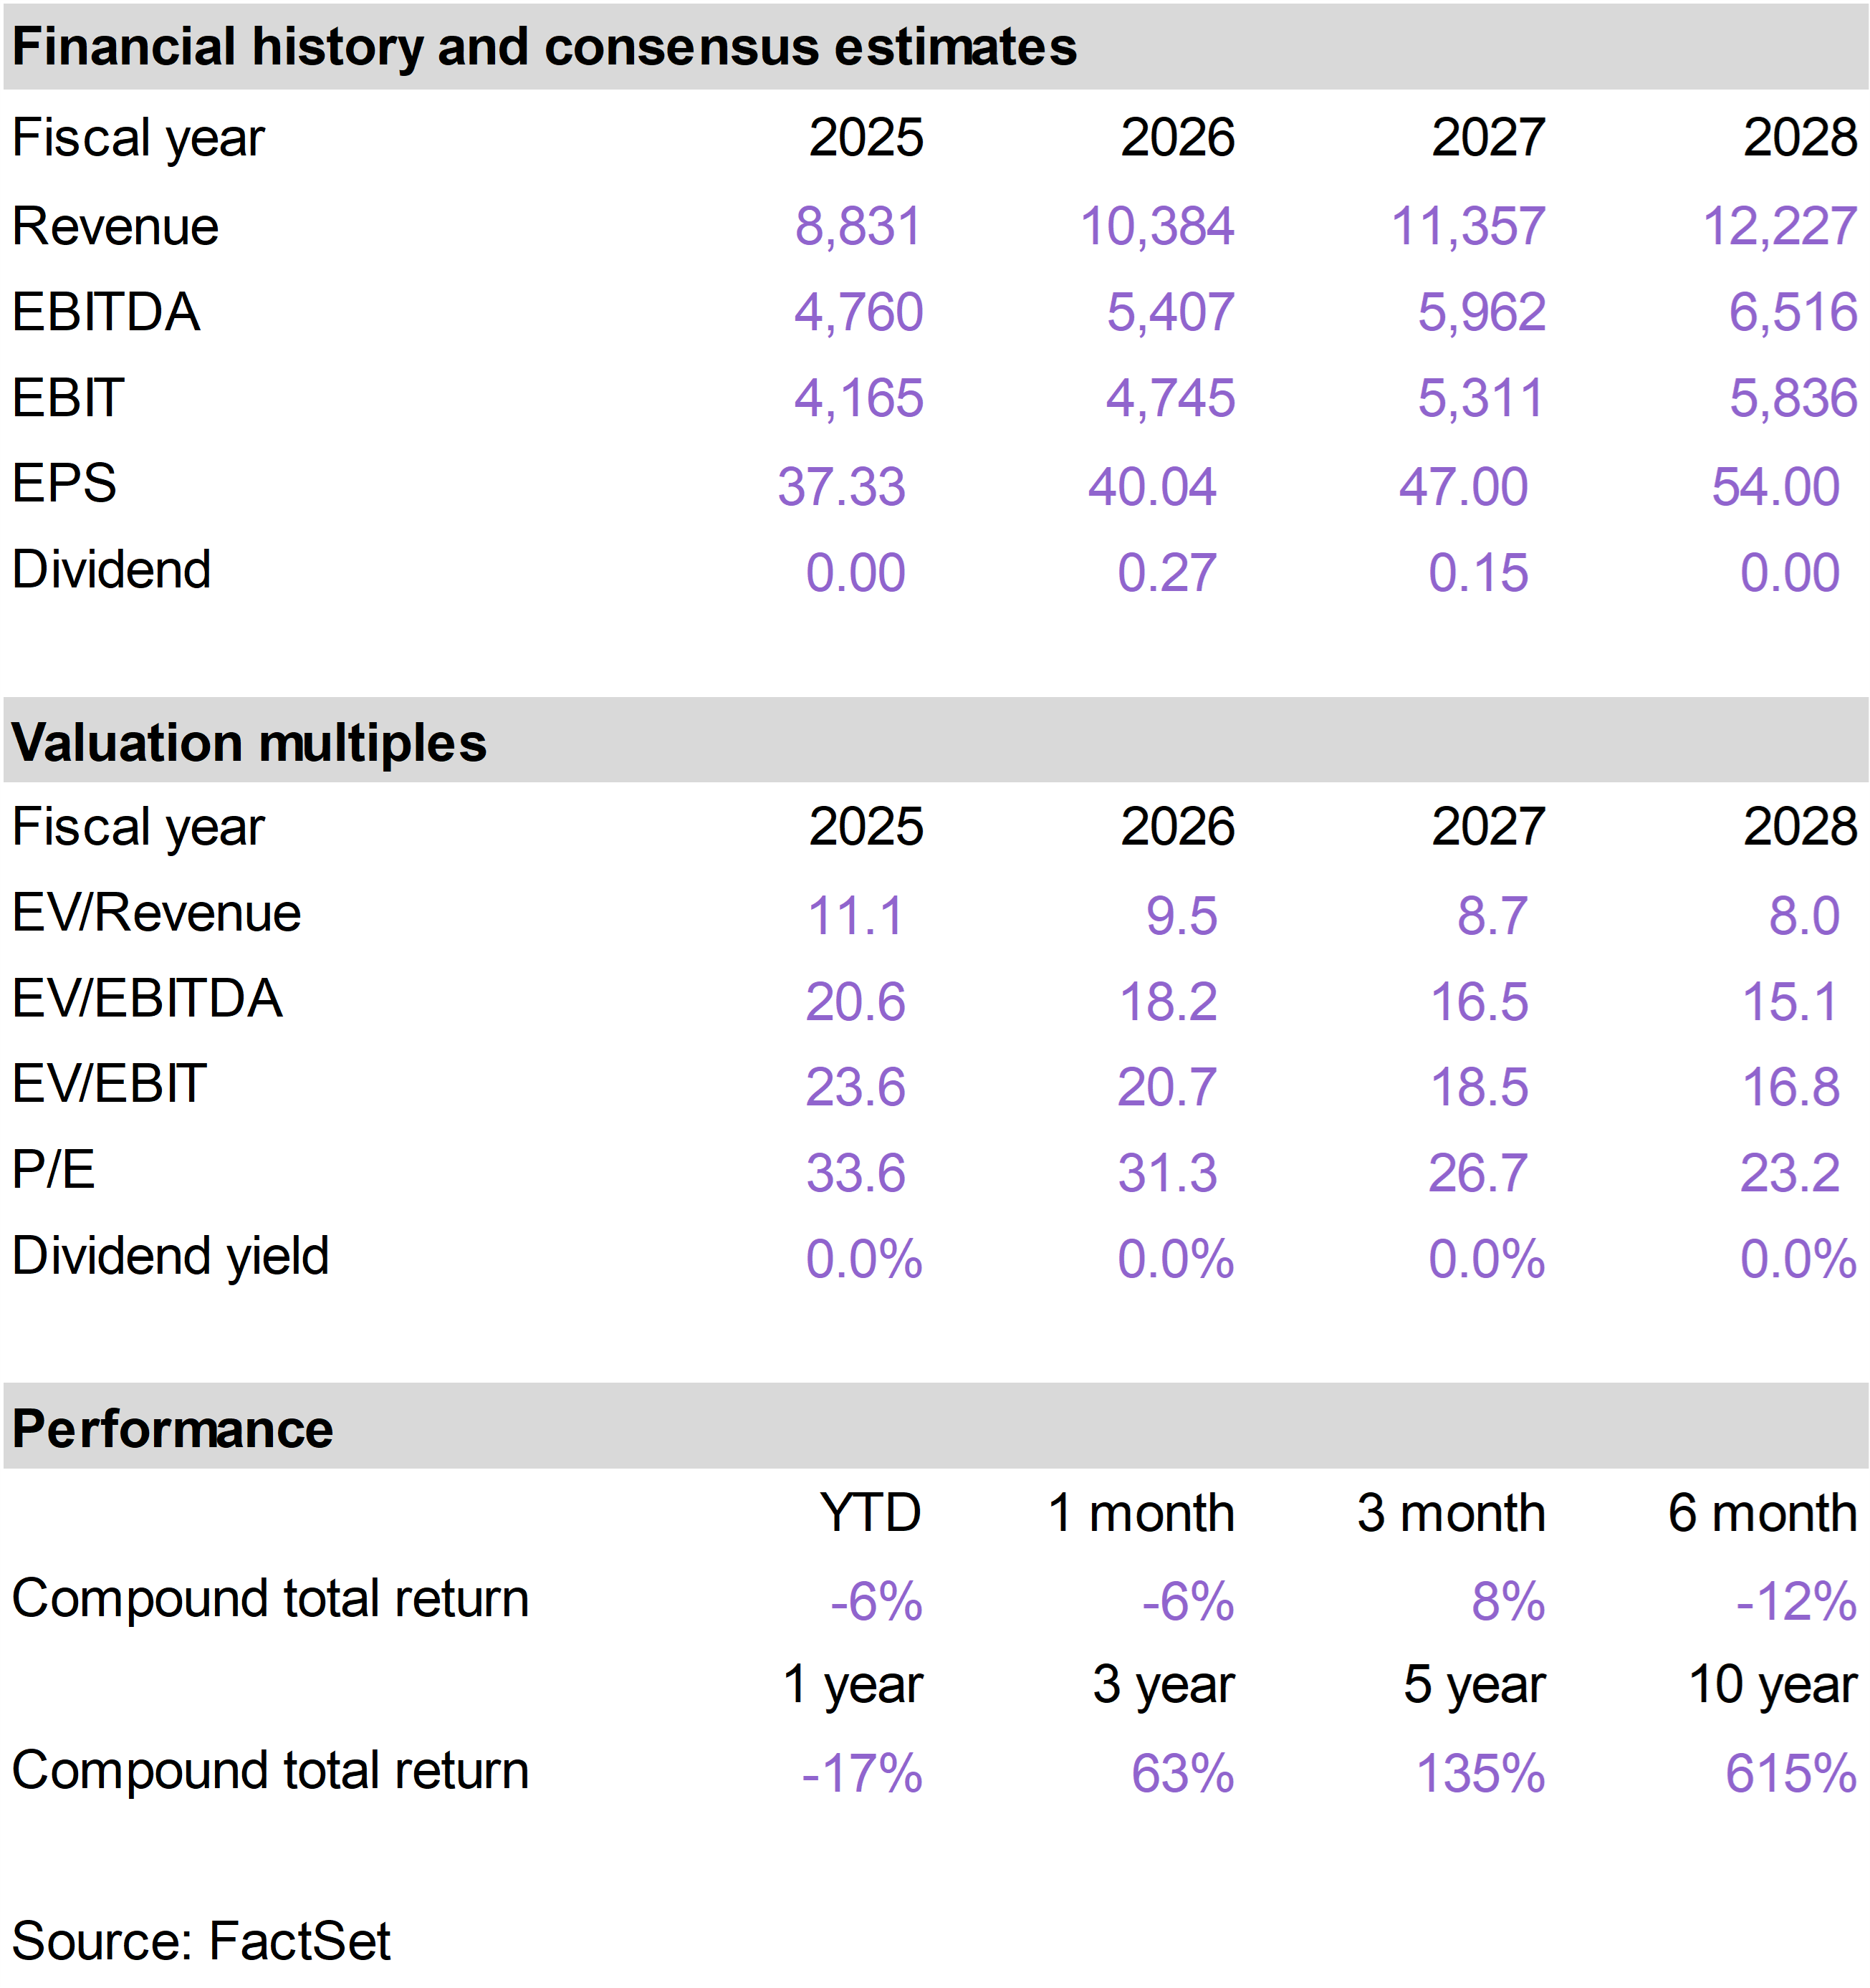
| | TDG faced some pressure in July, along with other Industrial sector stocks, but the underlying outlook remains constructive ahead of its fiscal third quarter earnings report.
Analysts expect revenue of approximately $2.66 billion, up 19% year-over-year, including about 10% organic growth. Adjusted earnings are expected to reach roughly $10.05 per share, compared with $9.60 a year ago.
Commercial original equipment revenue is projected to rise approximately 18% as aircraft production improves. Commercial Aftermarket revenue is expected to increase 11%, while Defense grows about 6%.
TDG has historically created value by acquiring proprietary aerospace businesses at lower margins and then improving pricing, productivity and operating discipline.
The company continued this strategy in July by agreeing to acquire Prince & Izant for approximately $1.1 billion. The business manufactures specialized alloys and components used in aircraft and rocket engines and generates most of its revenue from the attractive aftermarket.
Prince & Izant’s starting EBITDA margin is estimated near 20%, leaving substantial room for improvement. The acquisition is expected to increase adjusted earnings per share by approximately 3% by fiscal 2027–2028.
Near-term margins may be pressured by integration costs, but strong organic growth, durable aftermarket demand and continued expansion of TDG’s proprietary aerospace portfolio reinforce the long-term investment case. |
|
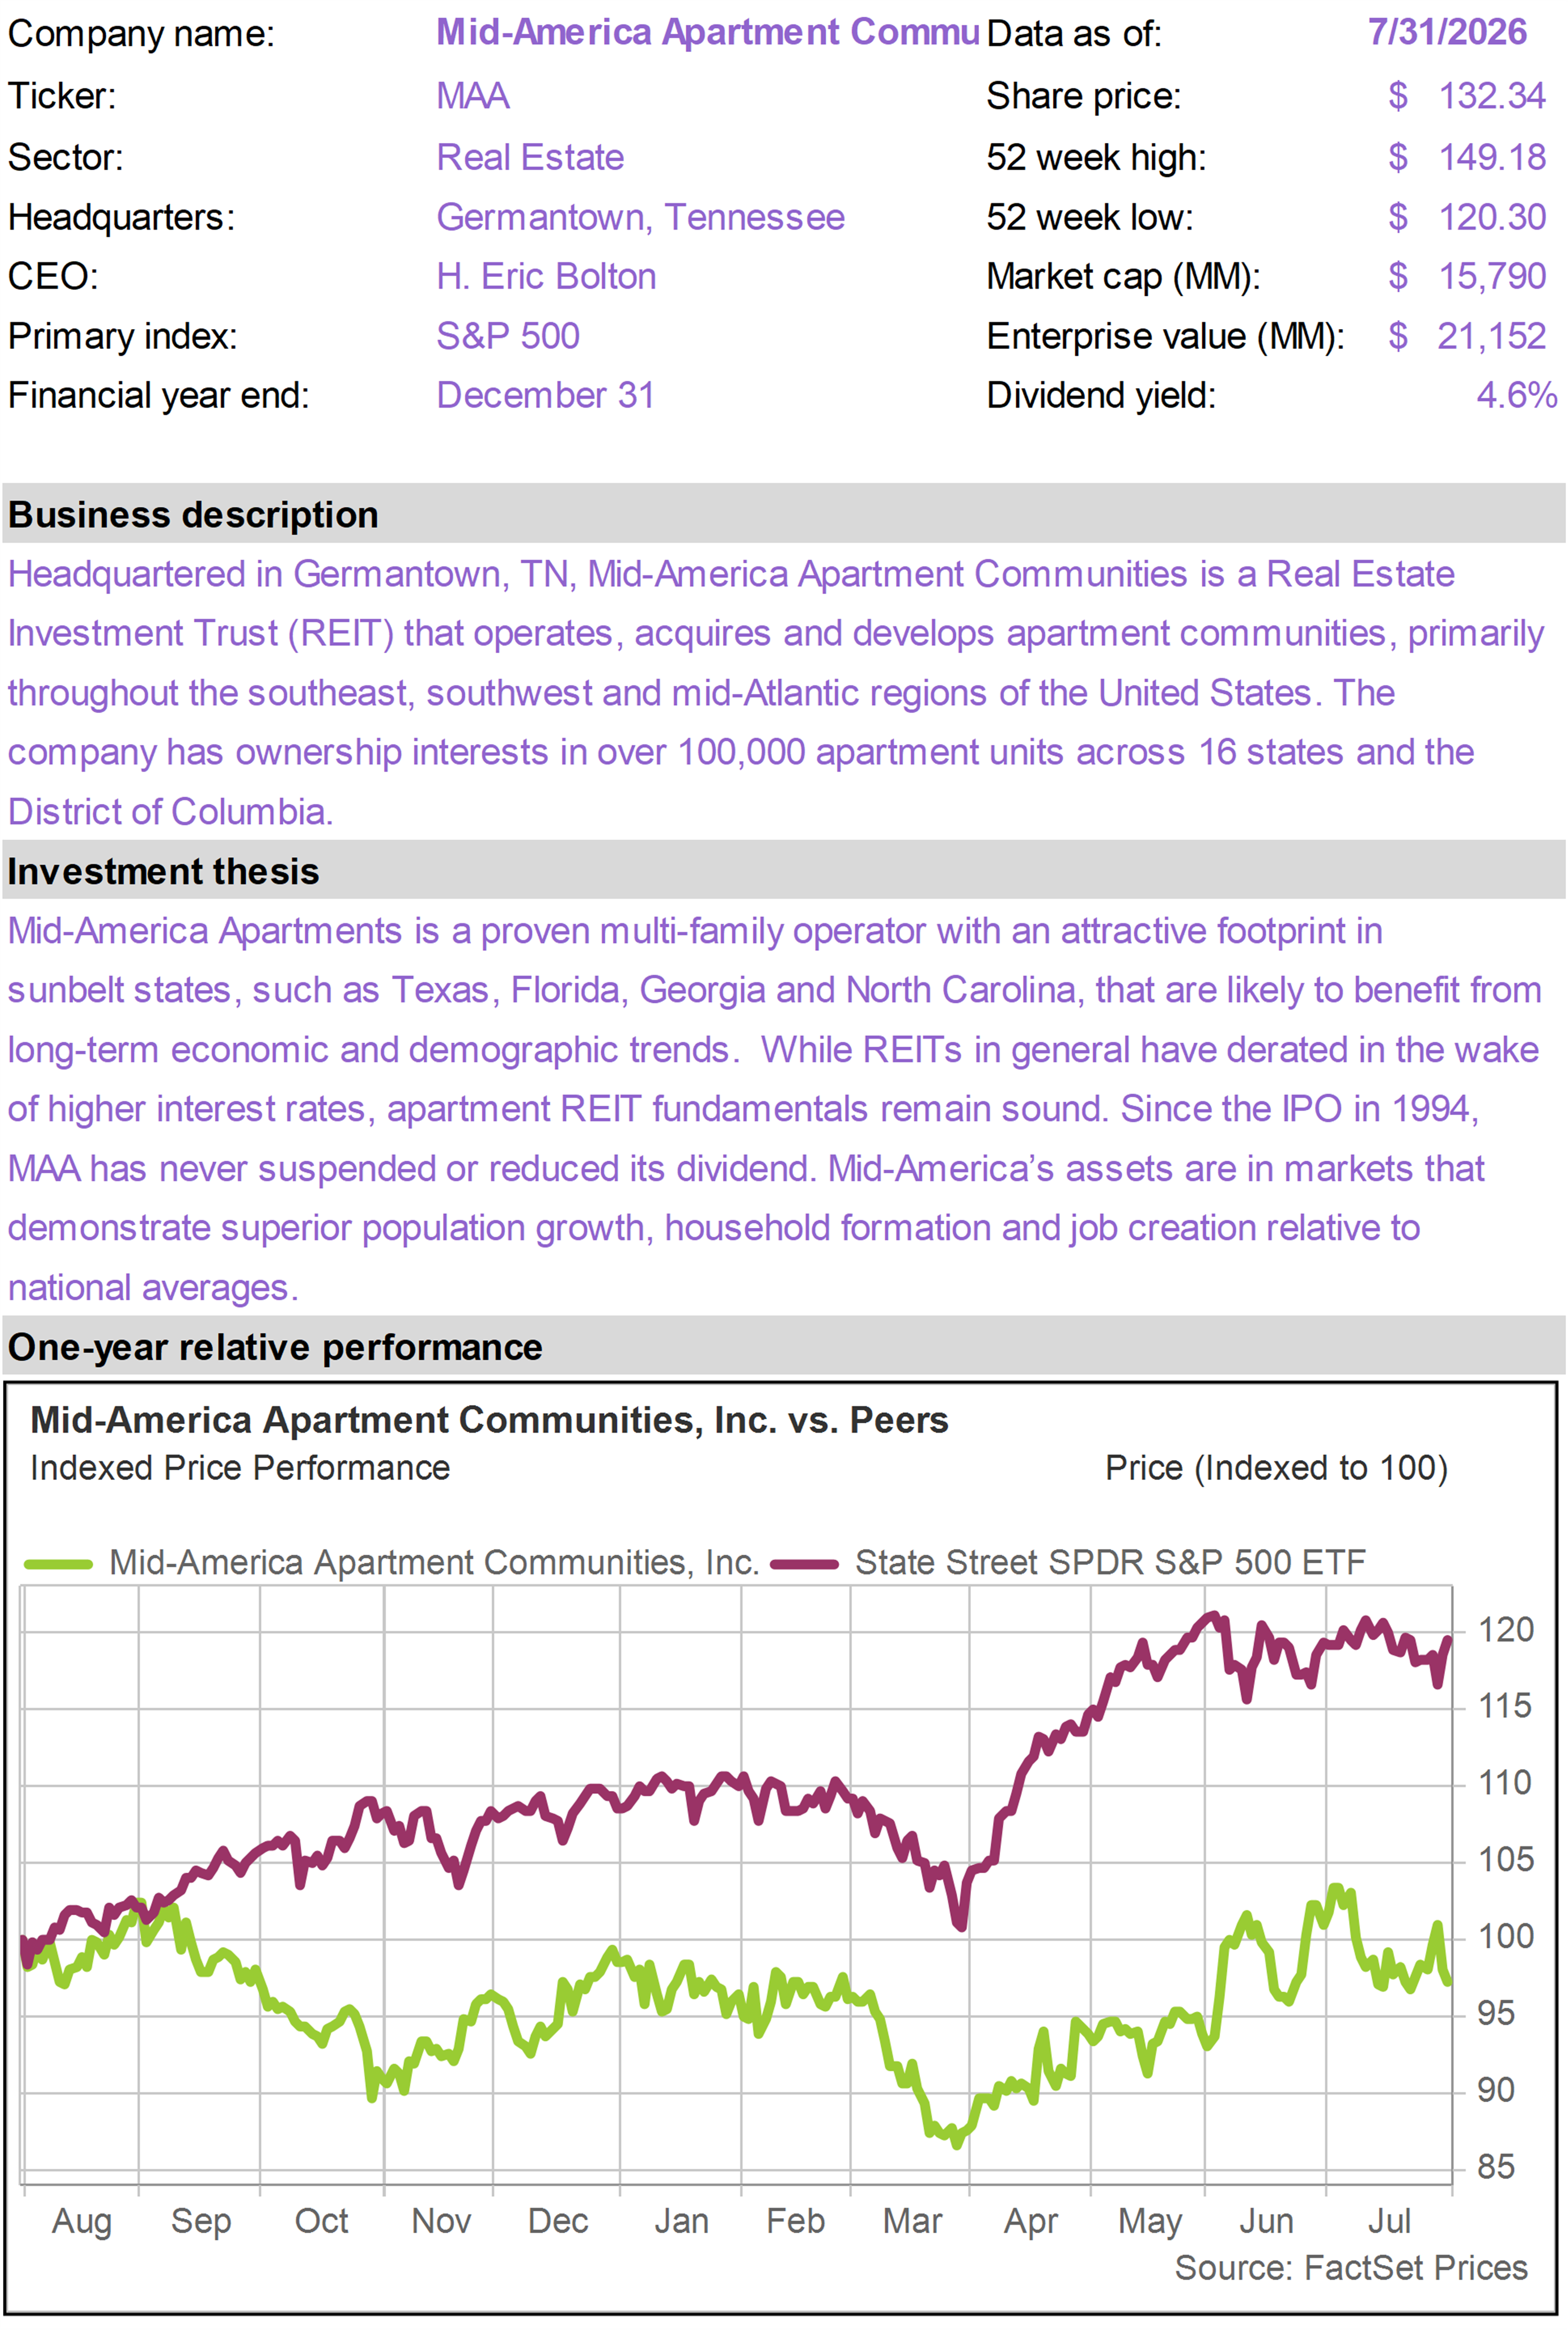
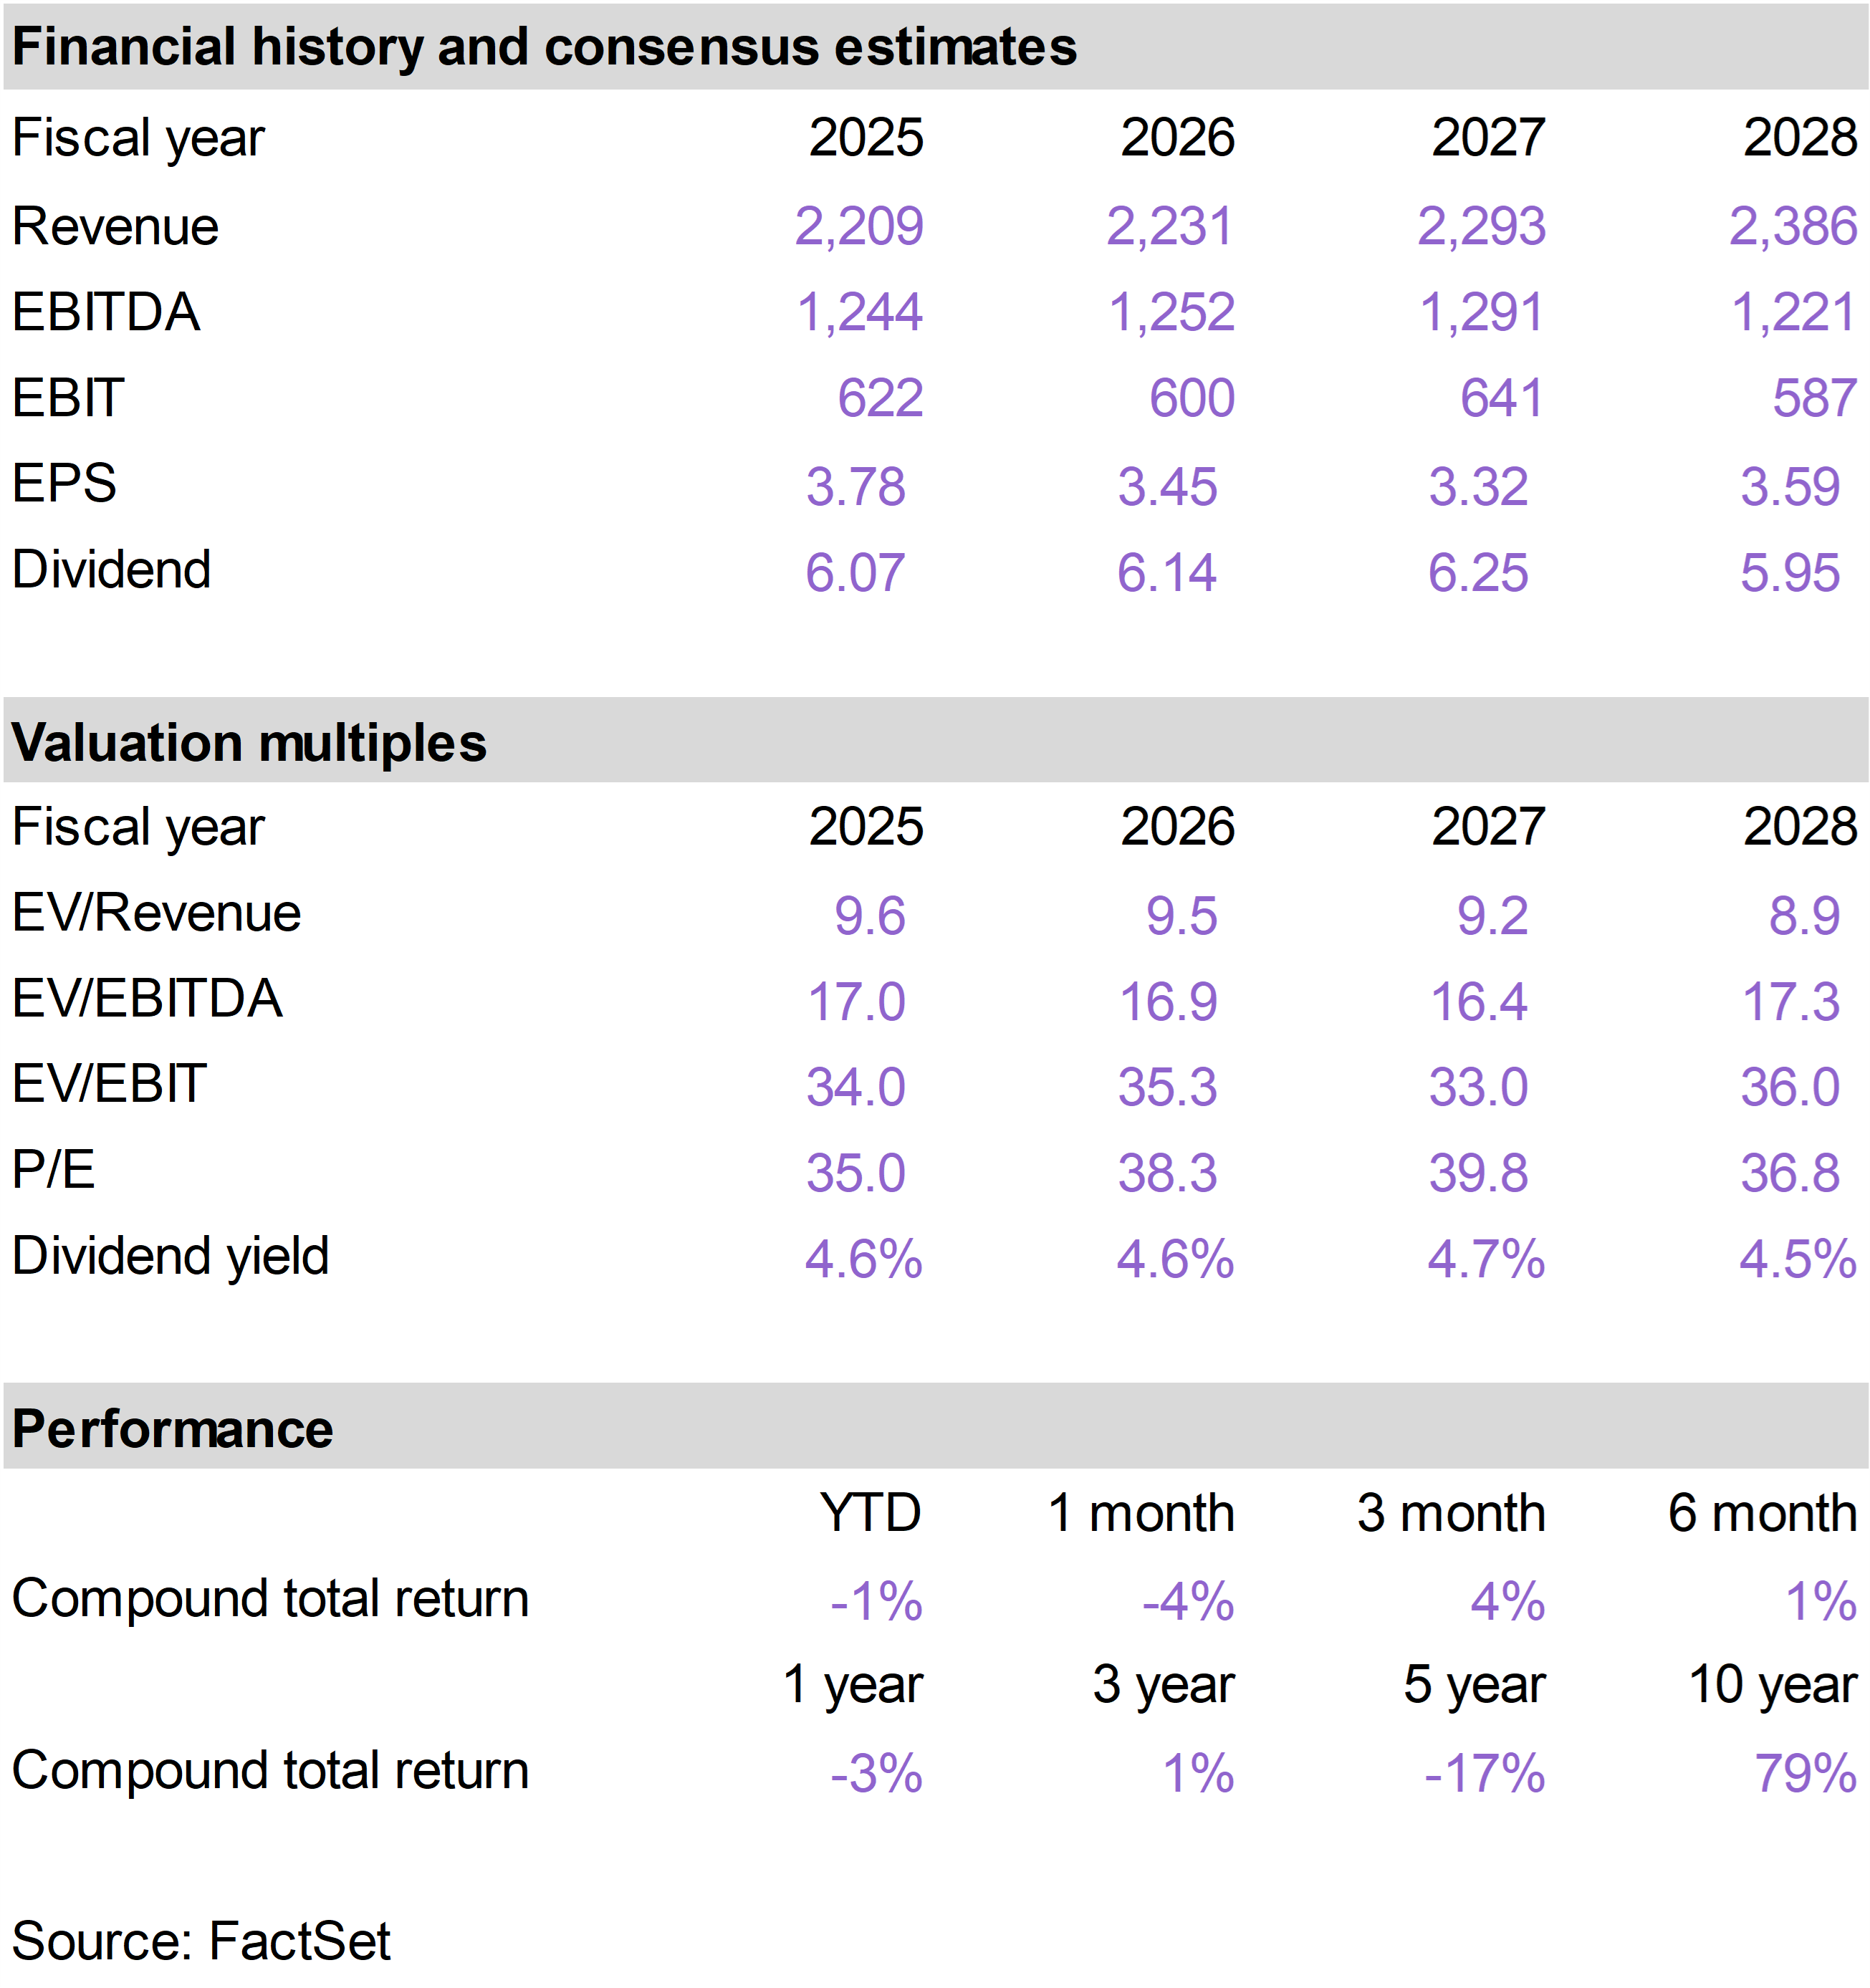
| | MAA declined modestly in July as higher interest rates pressured REITs and investors reacted to a somewhat softer outlook for rent growth.
The quarter itself was solid. Core funds from operations were $2.08 per share, slightly ahead of expectations. Same-store expenses increased only 0.8%, allowing net operating income to outperform despite weaker revenue and occupancy.
Leasing conditions are improving, but more slowly than management anticipated. Blended lease rates increased 0.7%, compared with a 0.3% decline in the first quarter. New-lease pricing improved 170 basis points sequentially, while renewal increases remained strong at 5.2%.
Management reduced its same-store revenue and NOI outlook because prospective residents remain price-sensitive and several markets are still absorbing elevated apartment supply. However, it maintained the midpoint of full-year core FFO guidance at $8.53 per share, supported by expense control and contributions from recently developed properties.
The longer-term supply-and-demand picture continues to improve. Apartment absorption across MAA’s markets exceeded new deliveries during the first half, while construction activity is slowing. Management expects third-quarter blended pricing to improve sequentially—an unusual seasonal pattern that would suggest the recovery is gaining momentum.
MAA is also generating attractive returns from internal investments. Apartment renovations are producing average rent increases of approximately $110 per month on an investment of just over $5,000 per unit, representing a cash return near 25%.
July’s weakness reflected disappointment that the Sunbelt apartment recovery is taking longer than expected, compounded by rising Treasury yields. But demand remains healthy, new supply is declining and MAA’s strong balance sheet supports continued development and share repurchases. |
|
| | |
| | |
| | |
| | | |
|
| | |
|
| | Mid-America Apartment (MAA) |
|
|
|
| | |
|
| | |
|
| | |
|
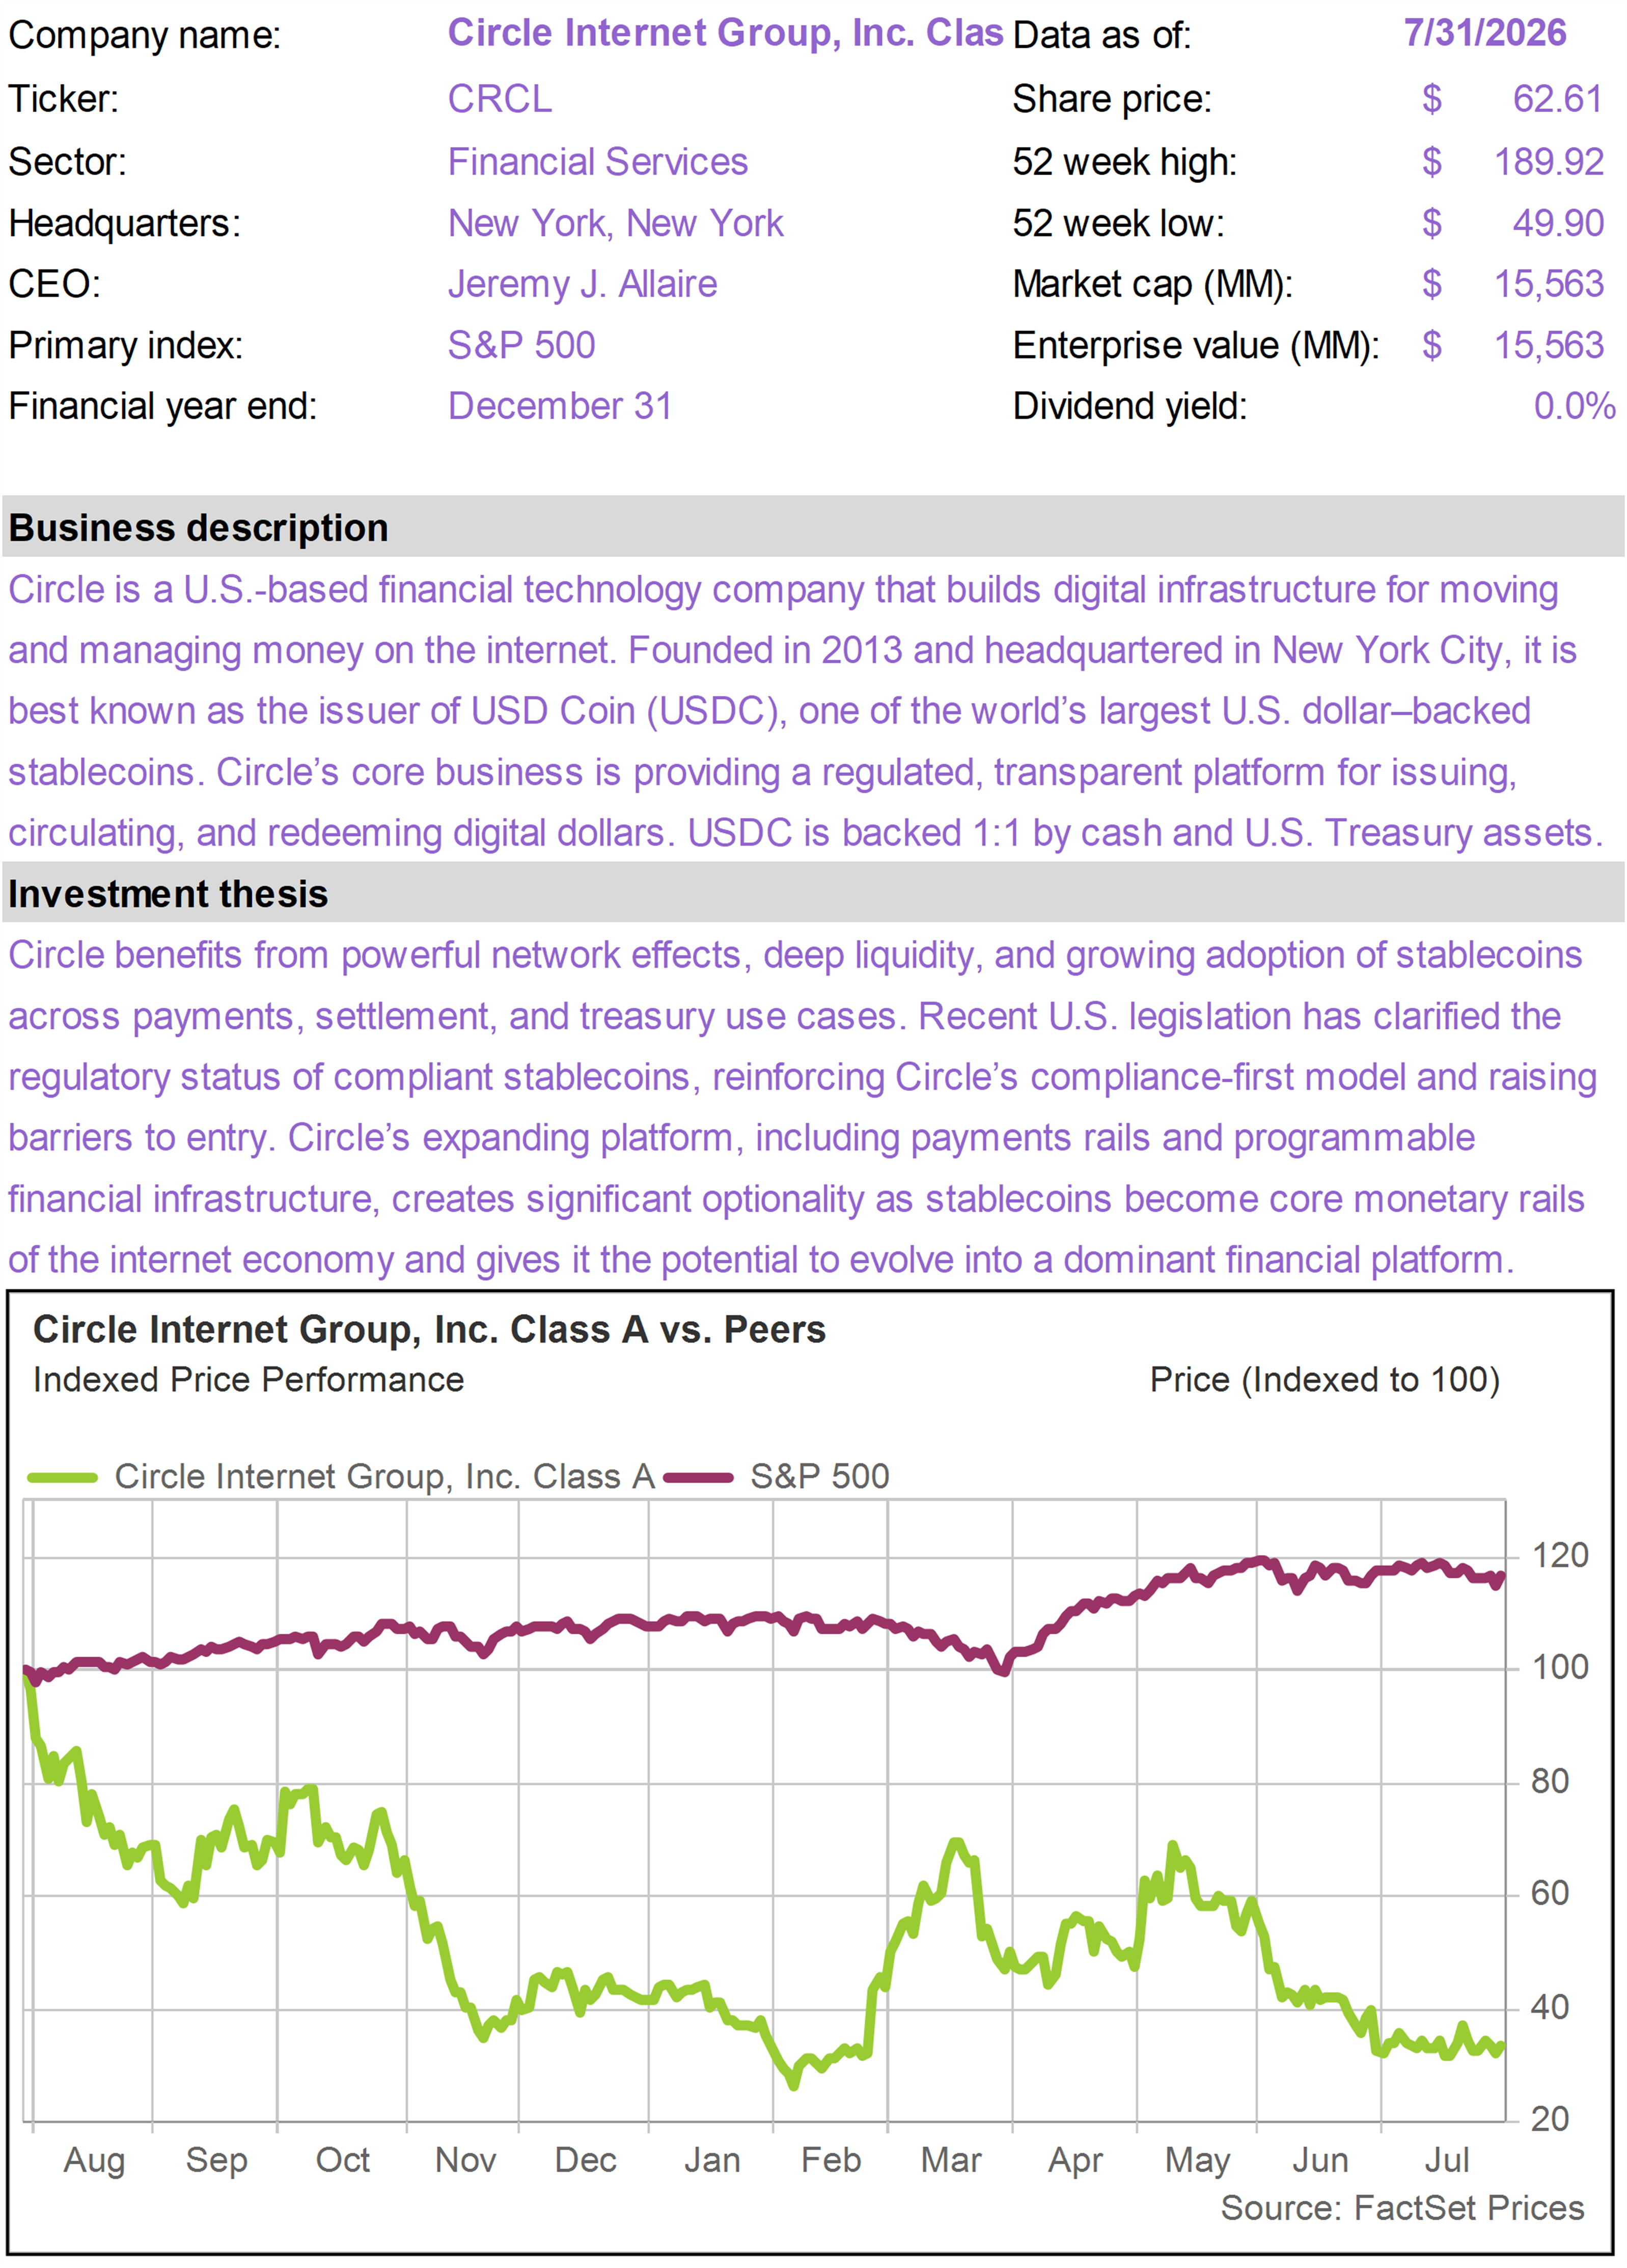
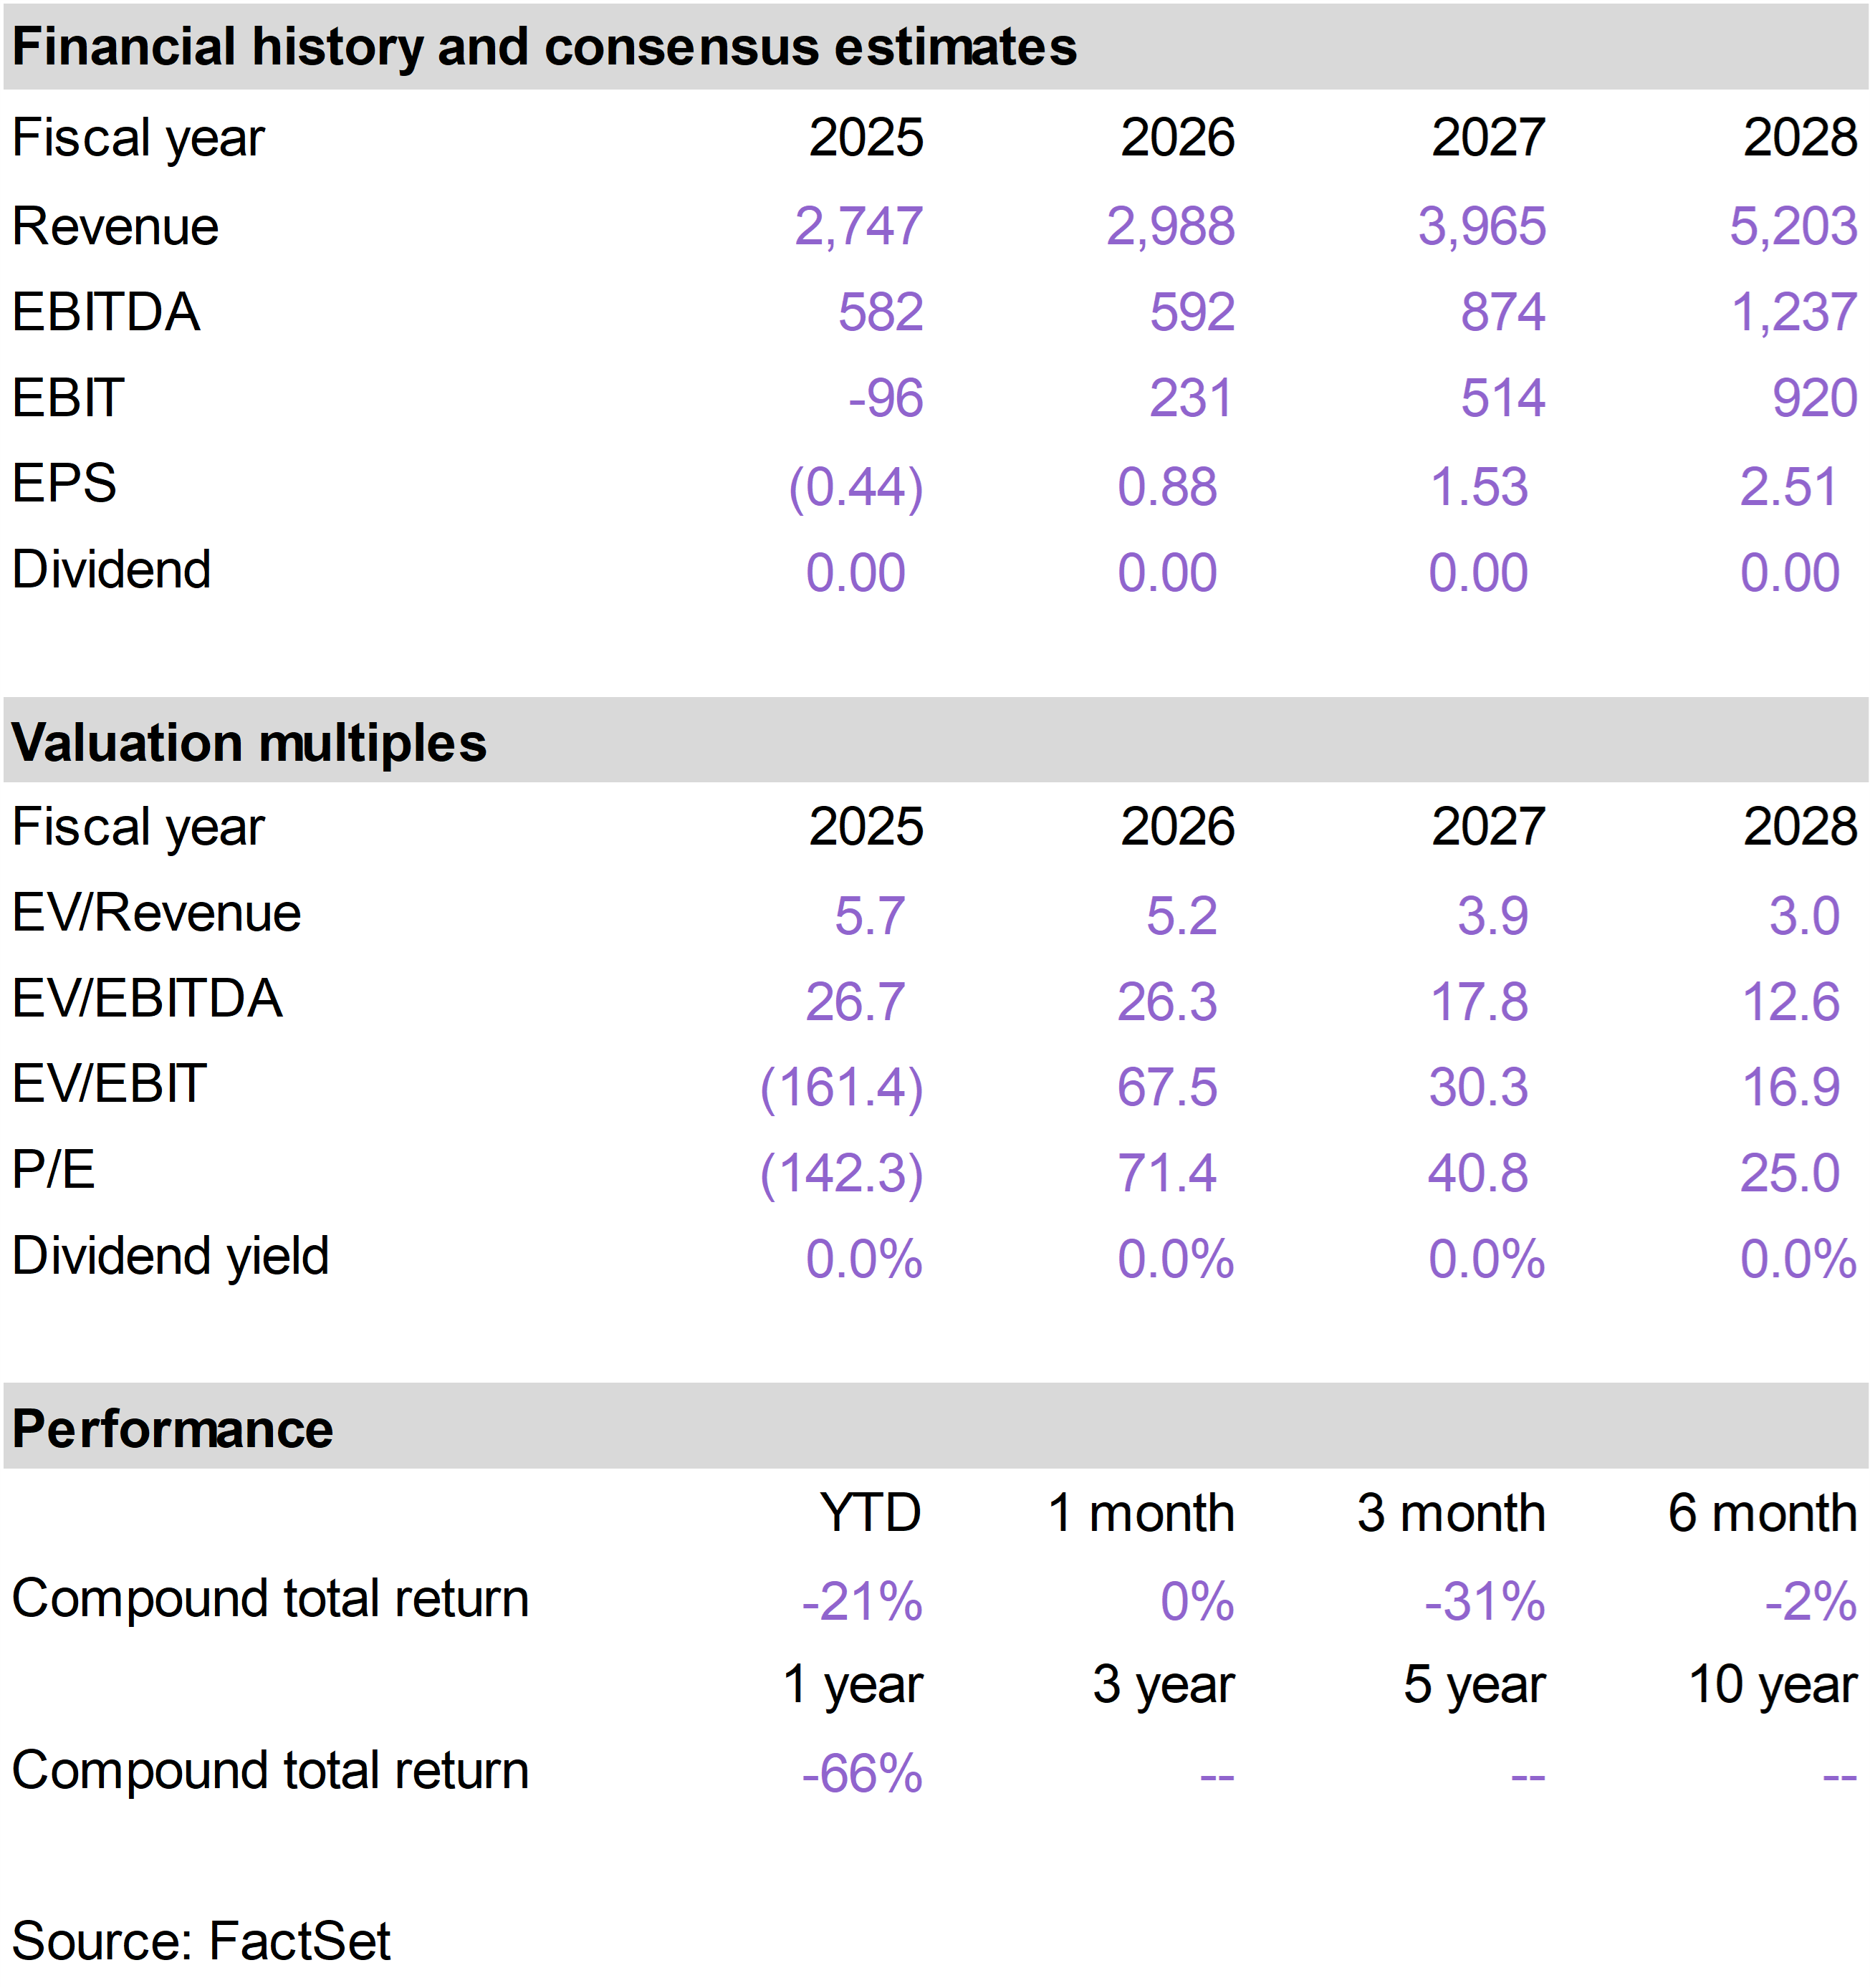
| | Circle Internet Group (CRCL) |
|
|
|
| | Diamondback Energy (FANG) |
|
|
|
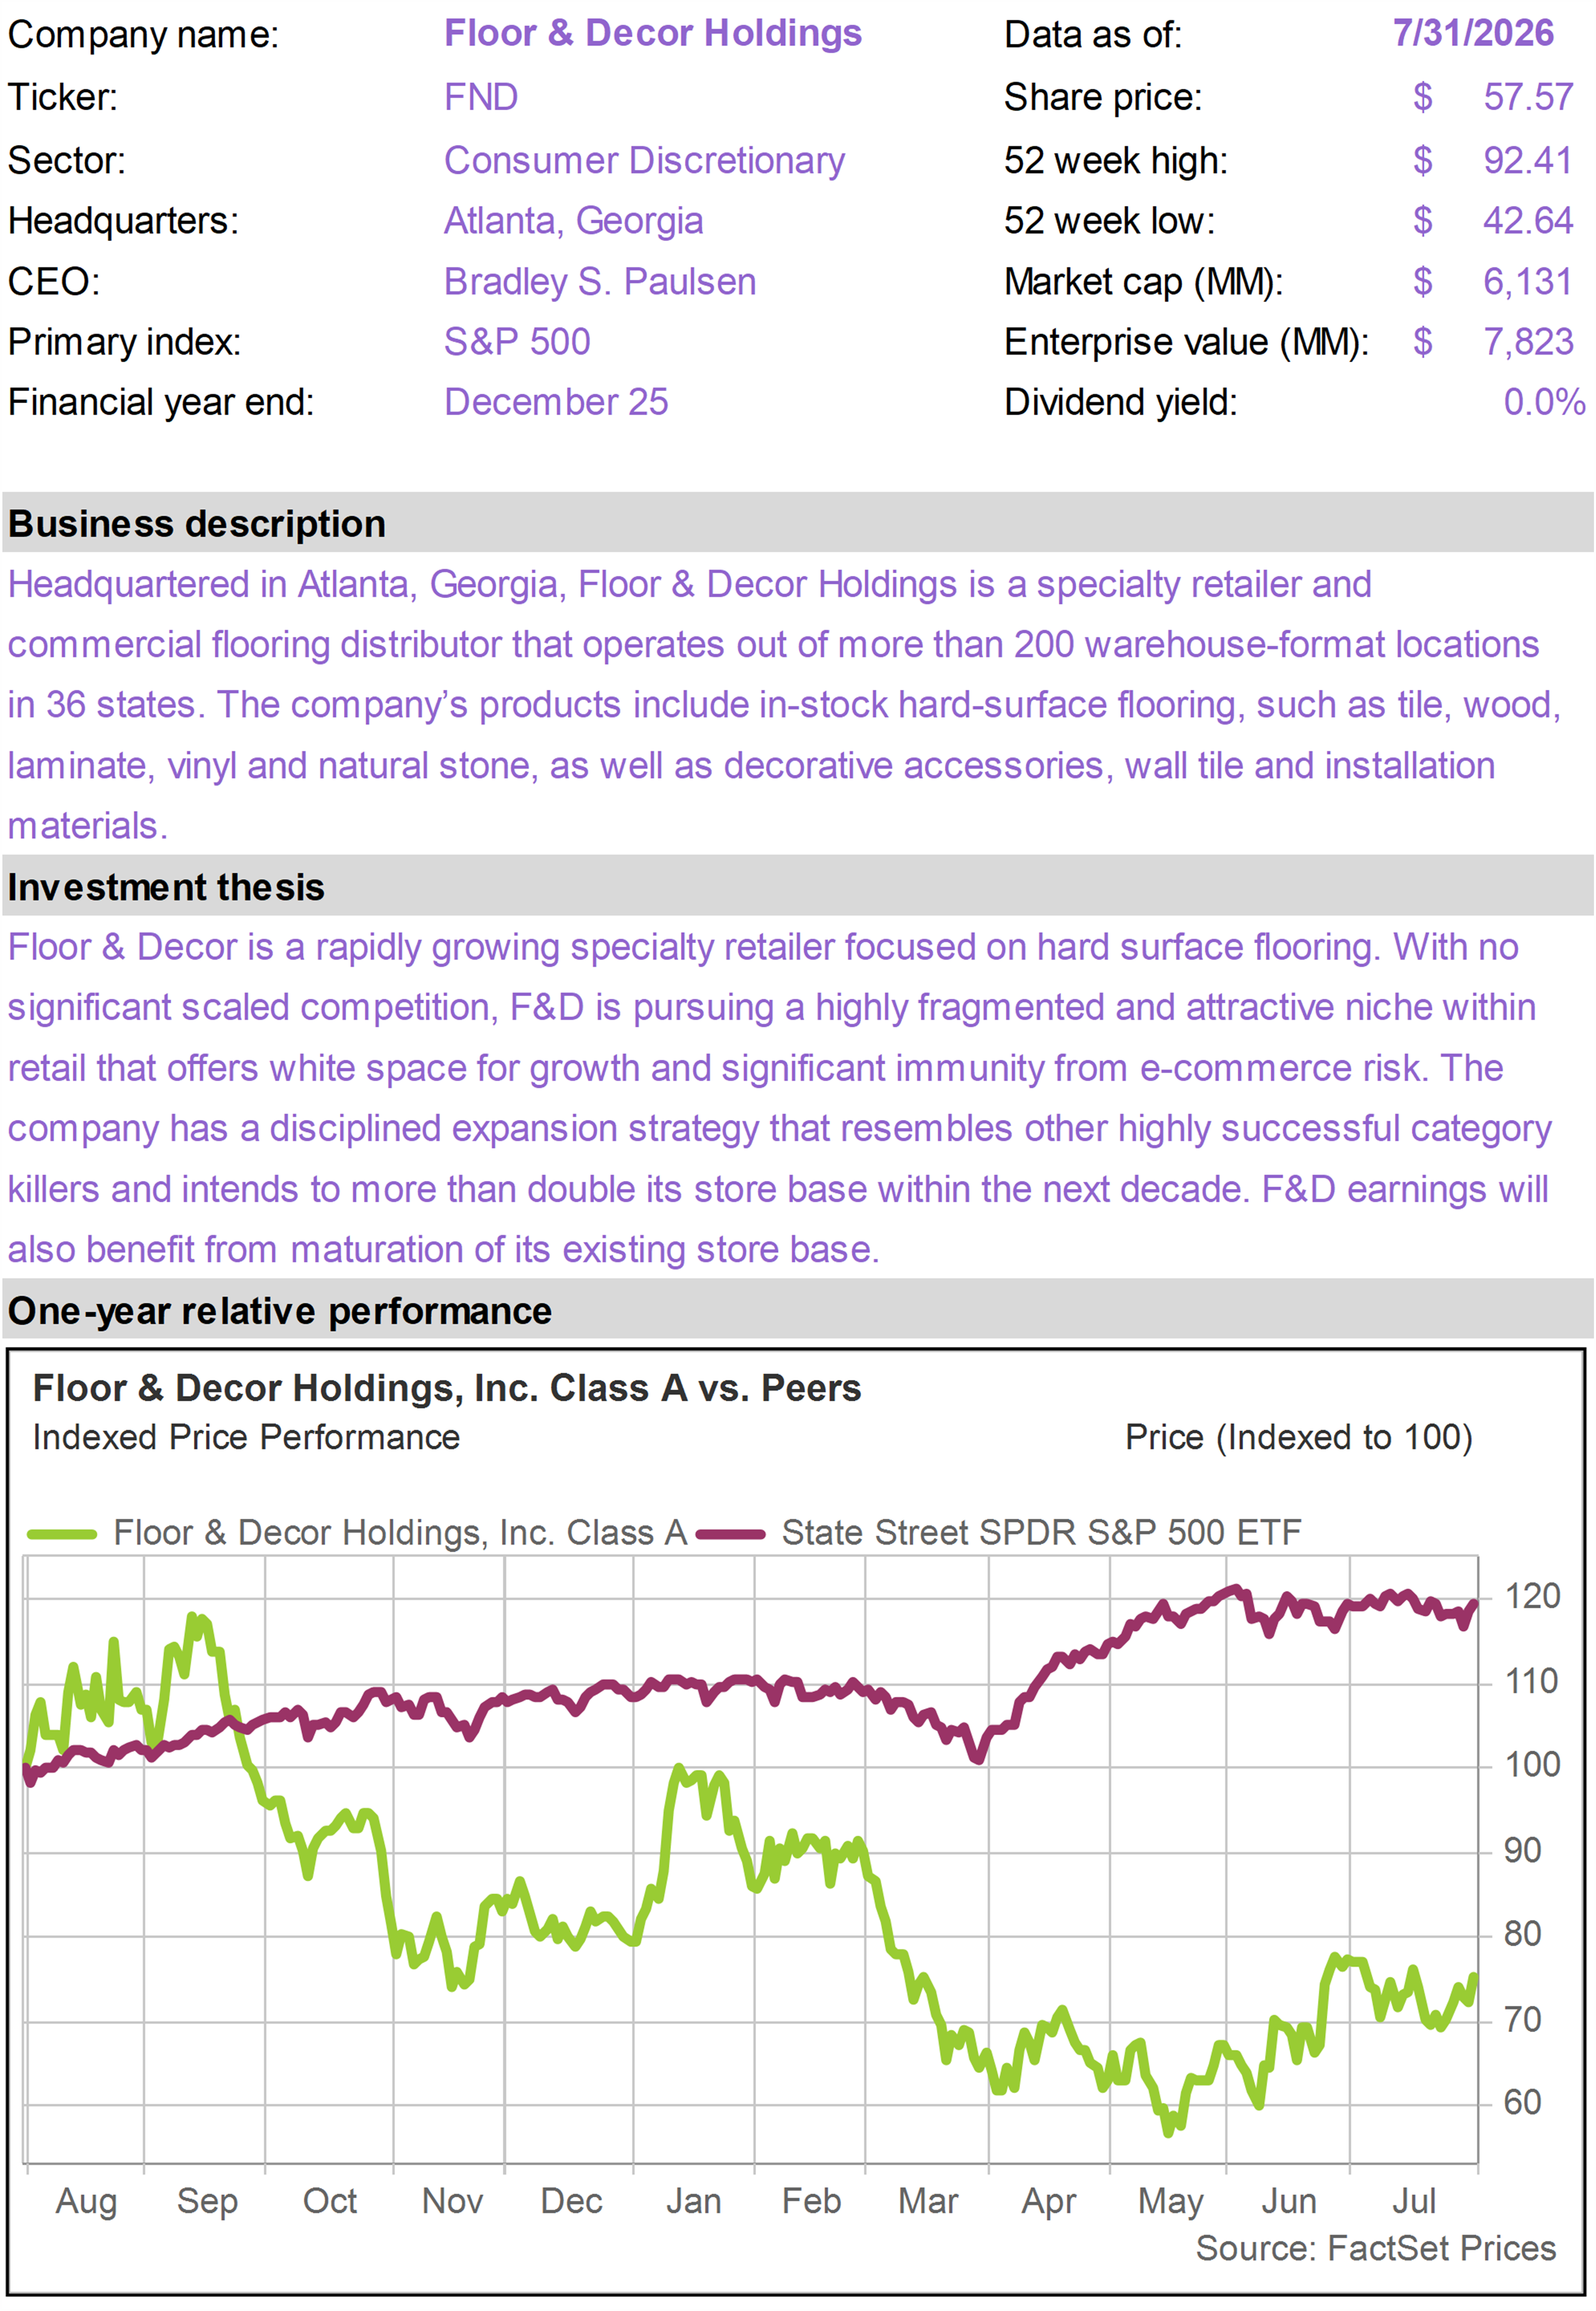
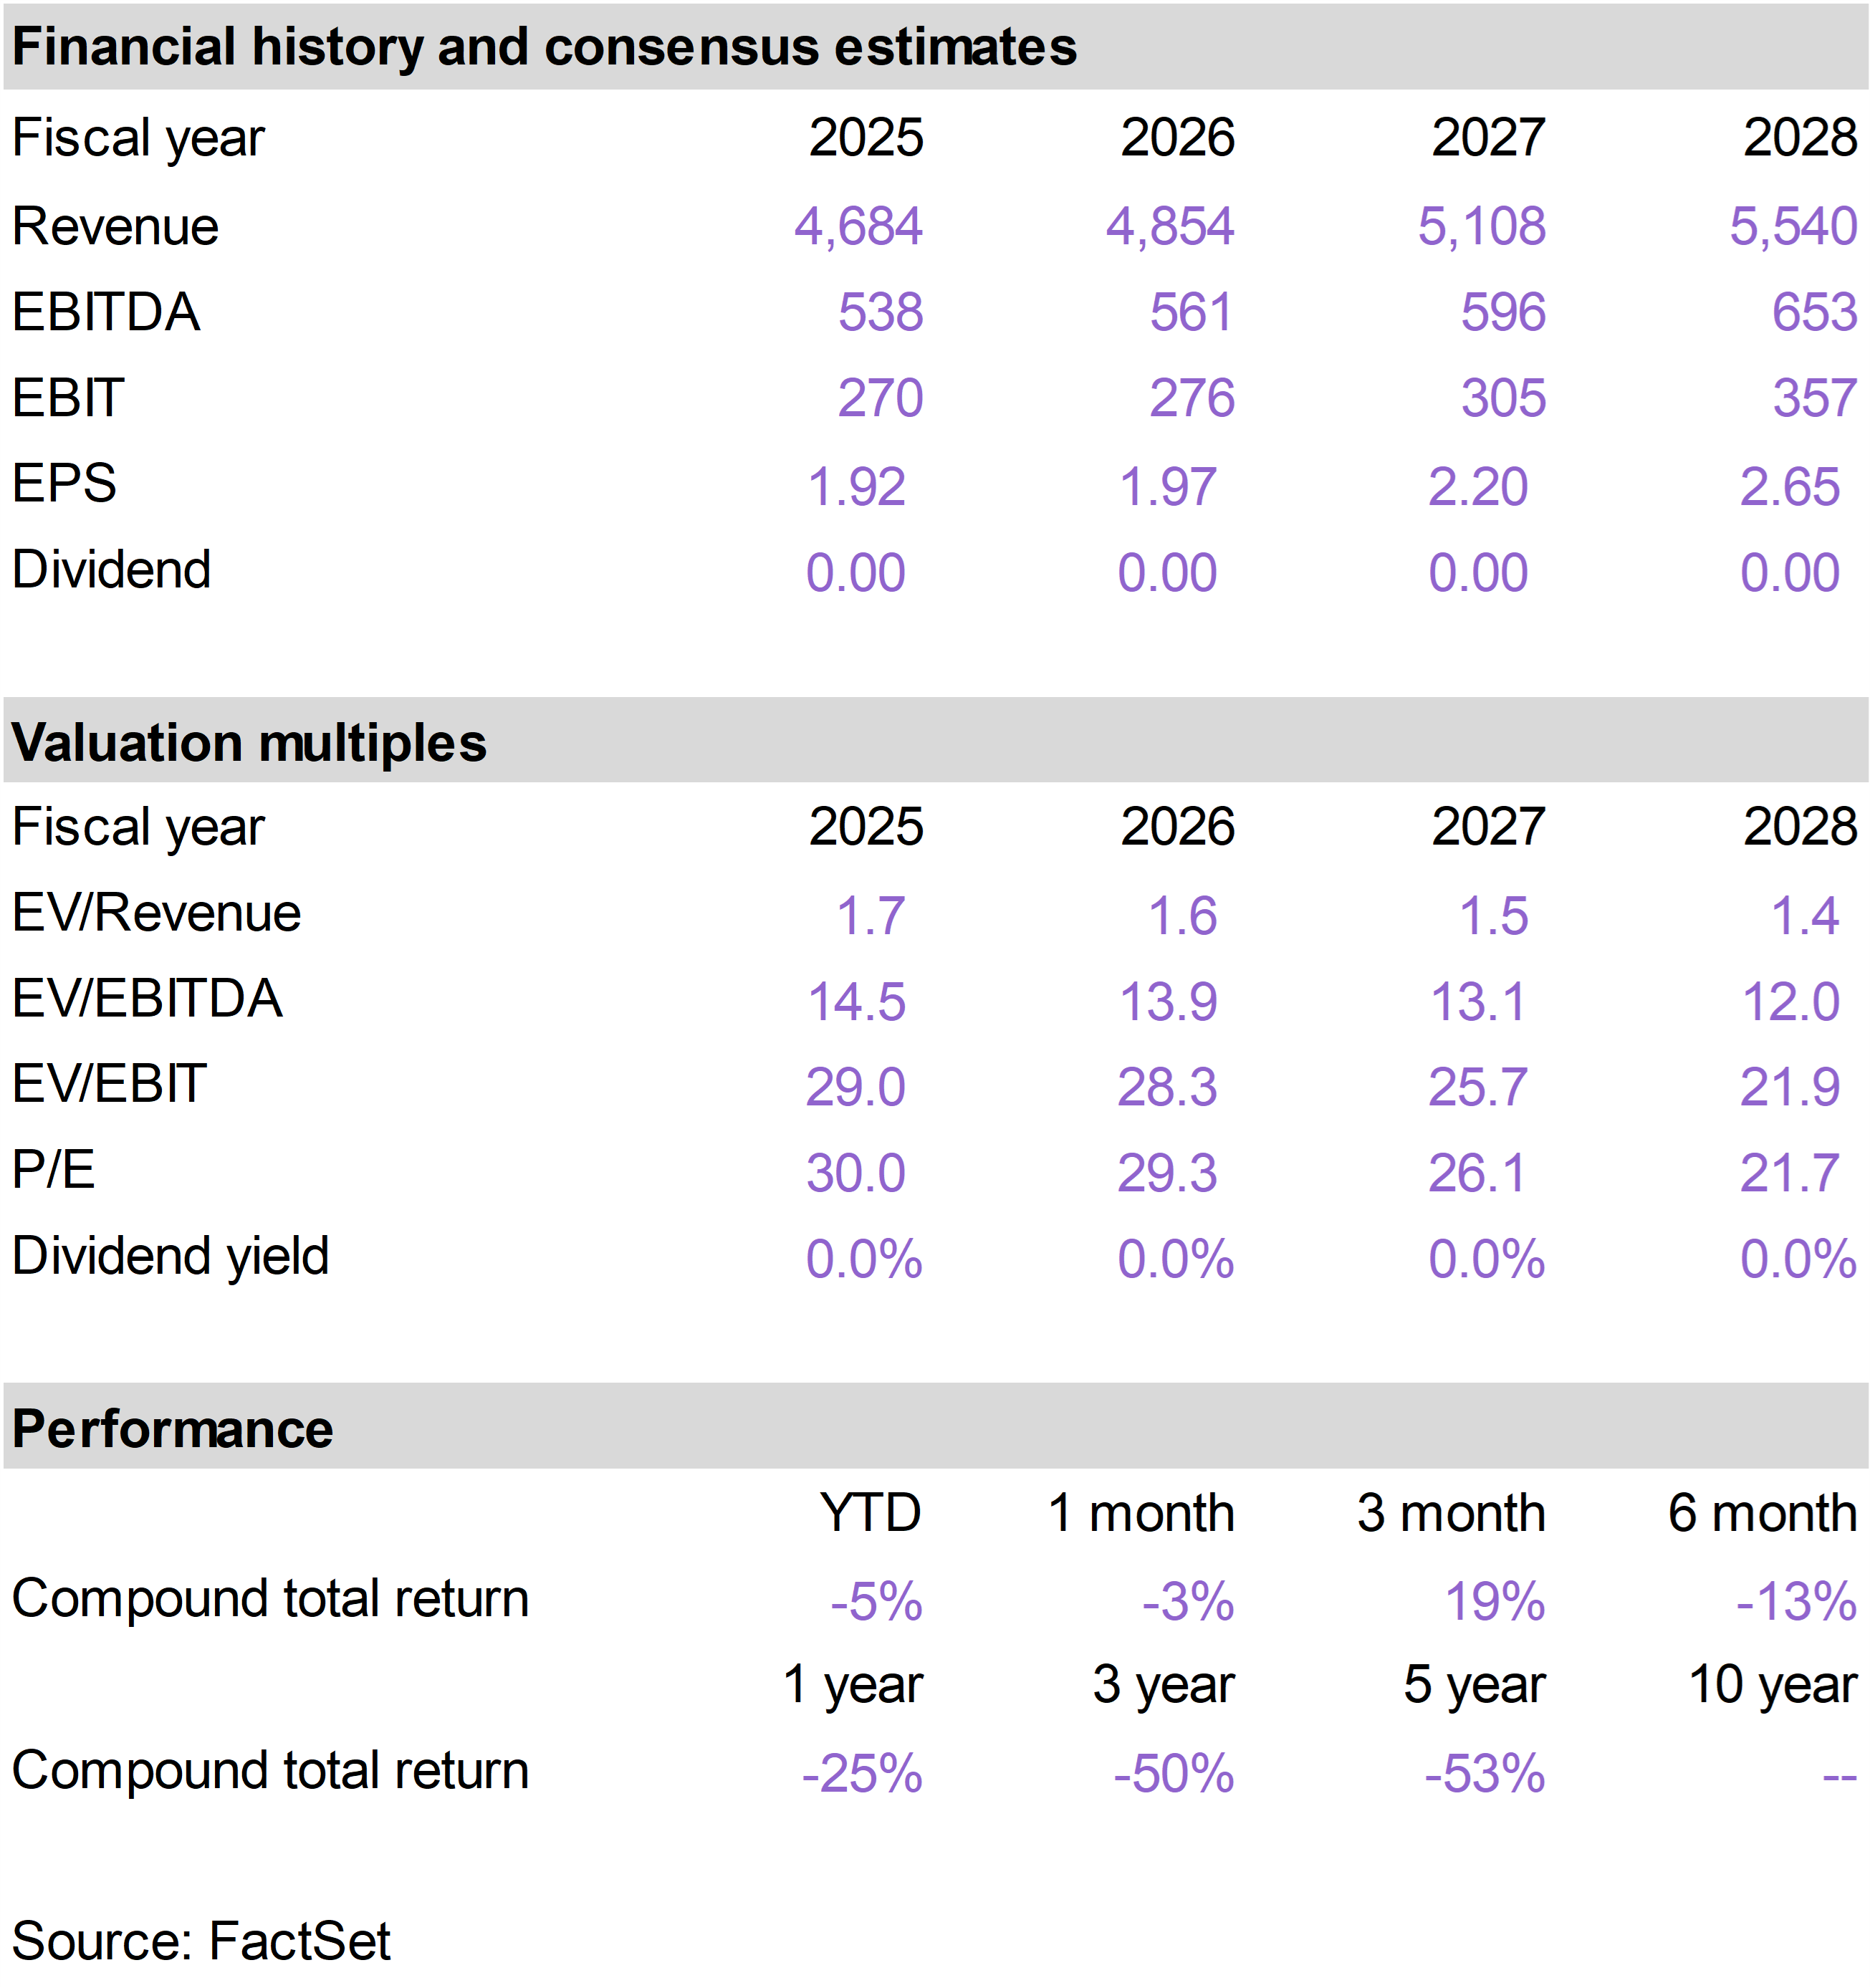
| | Floor & Decor Holdings (FND) |
|
|
|
| | |
|
| | |
|
| | |
|
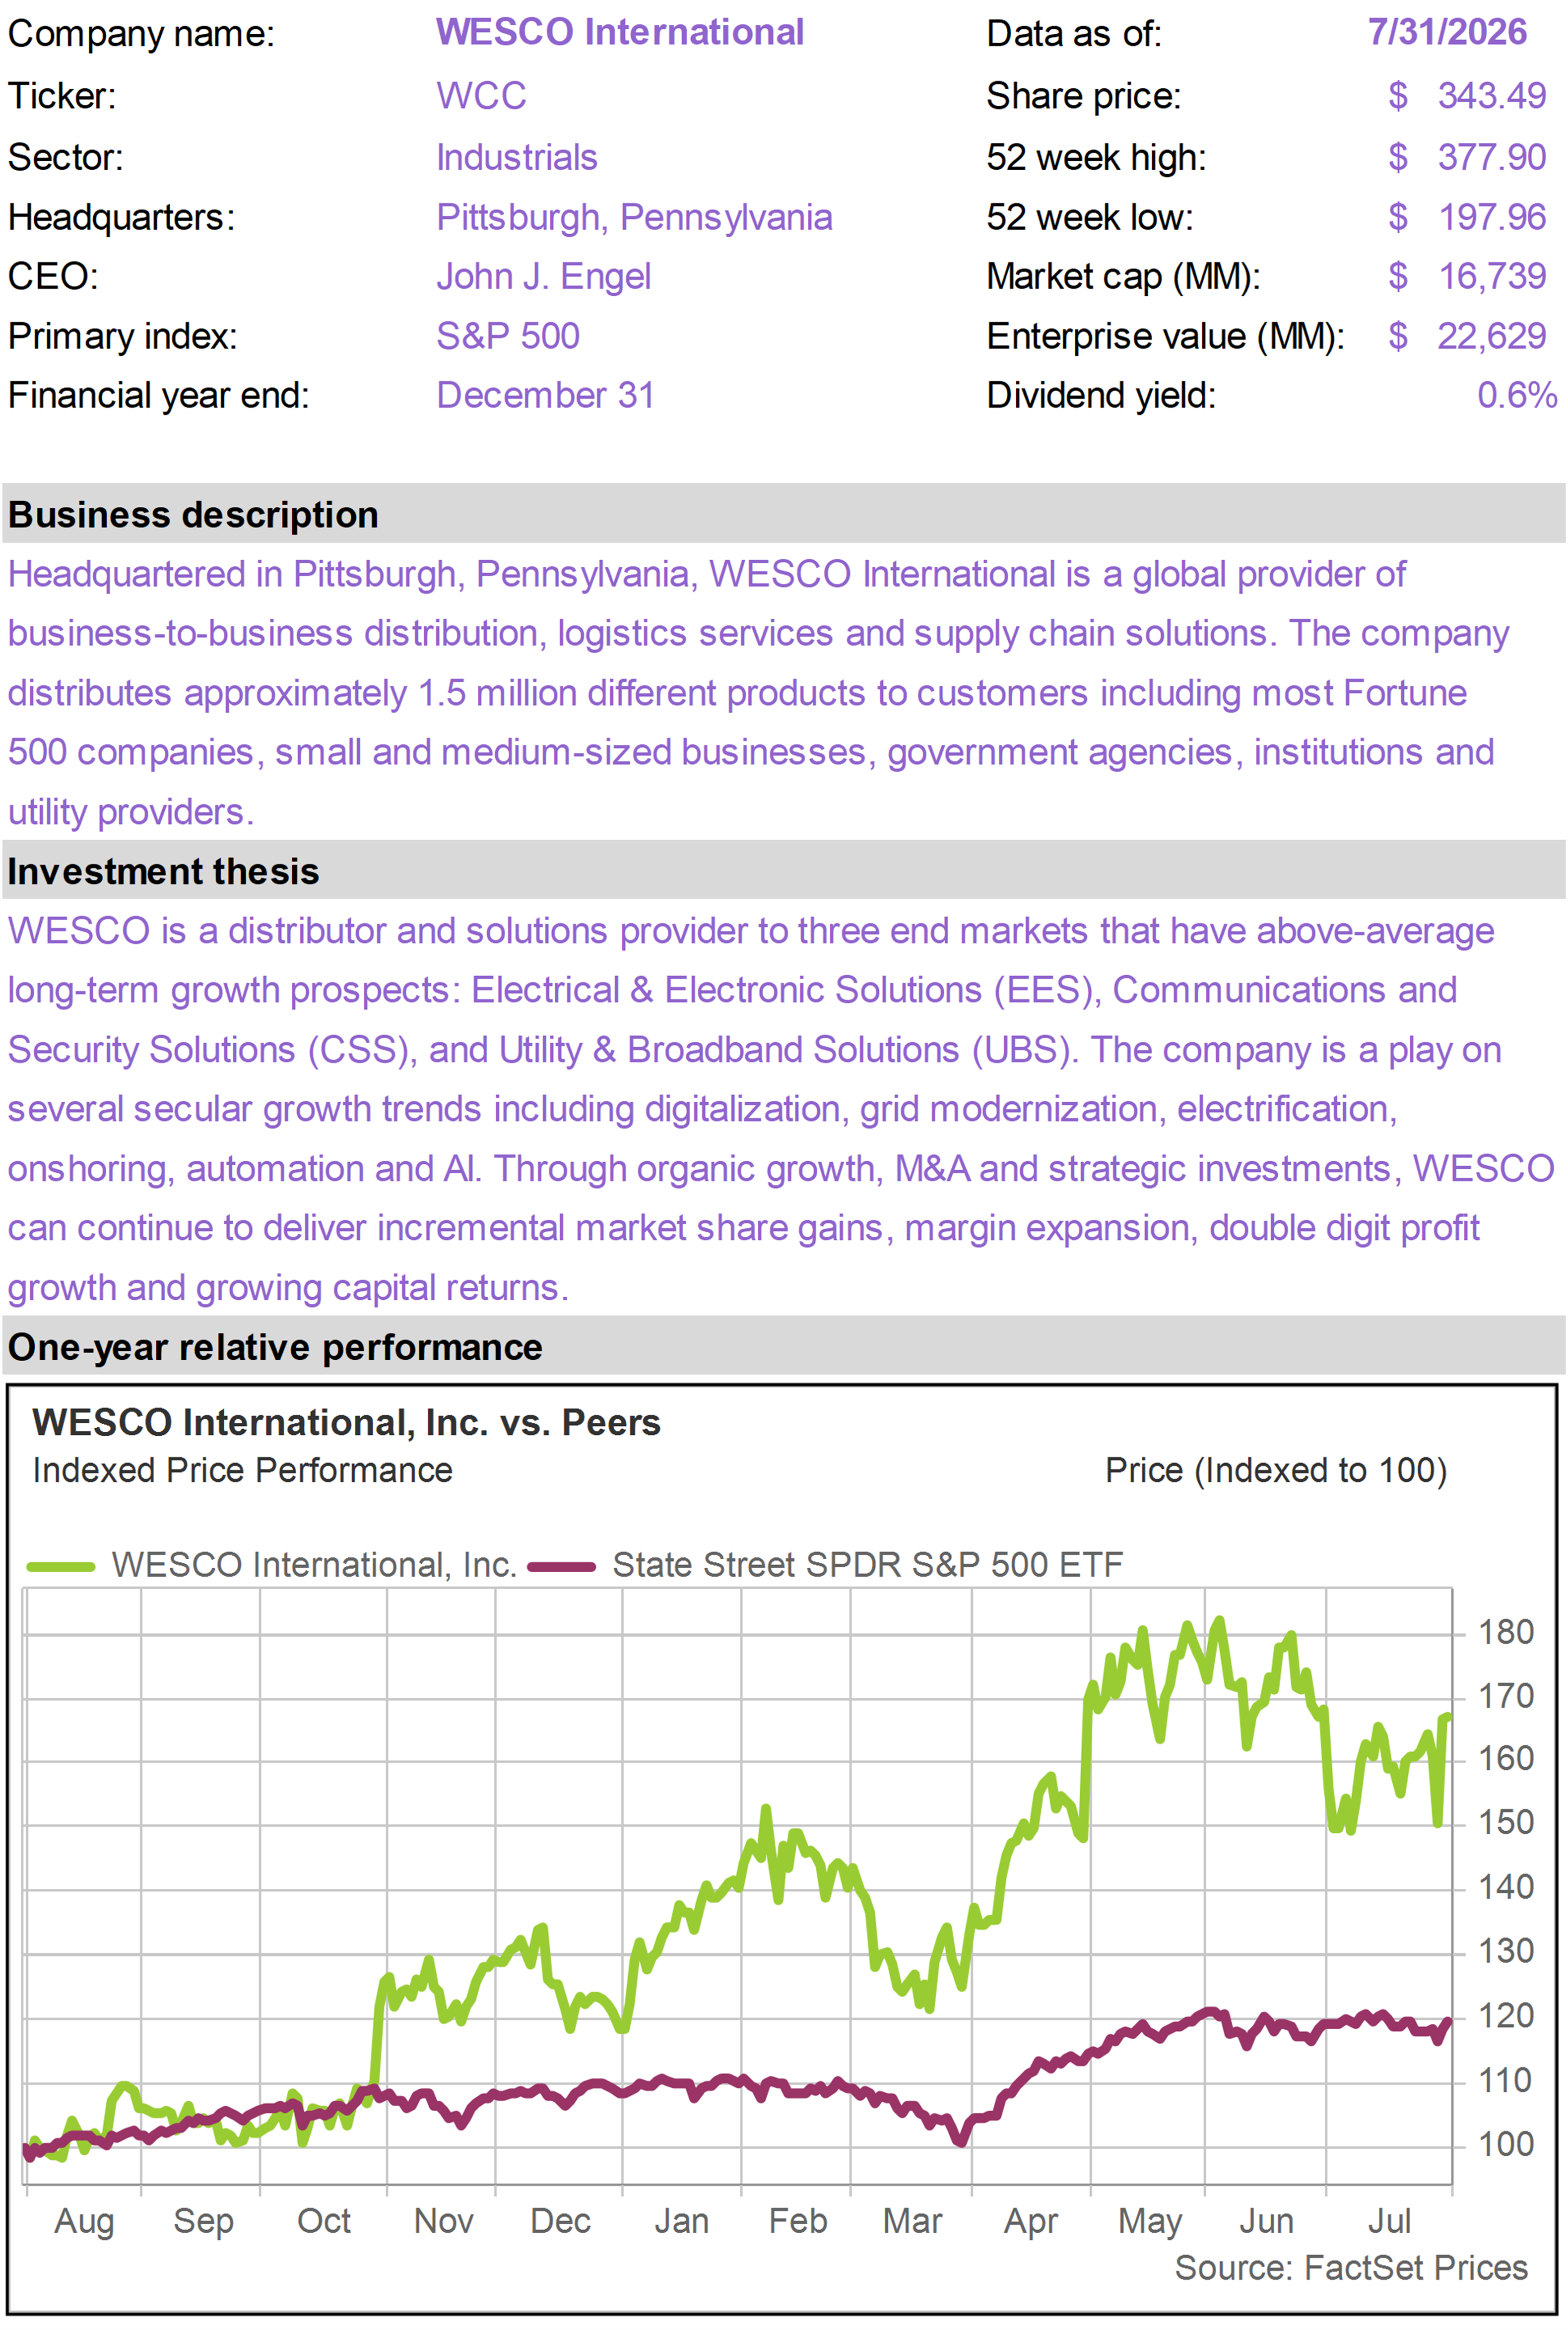
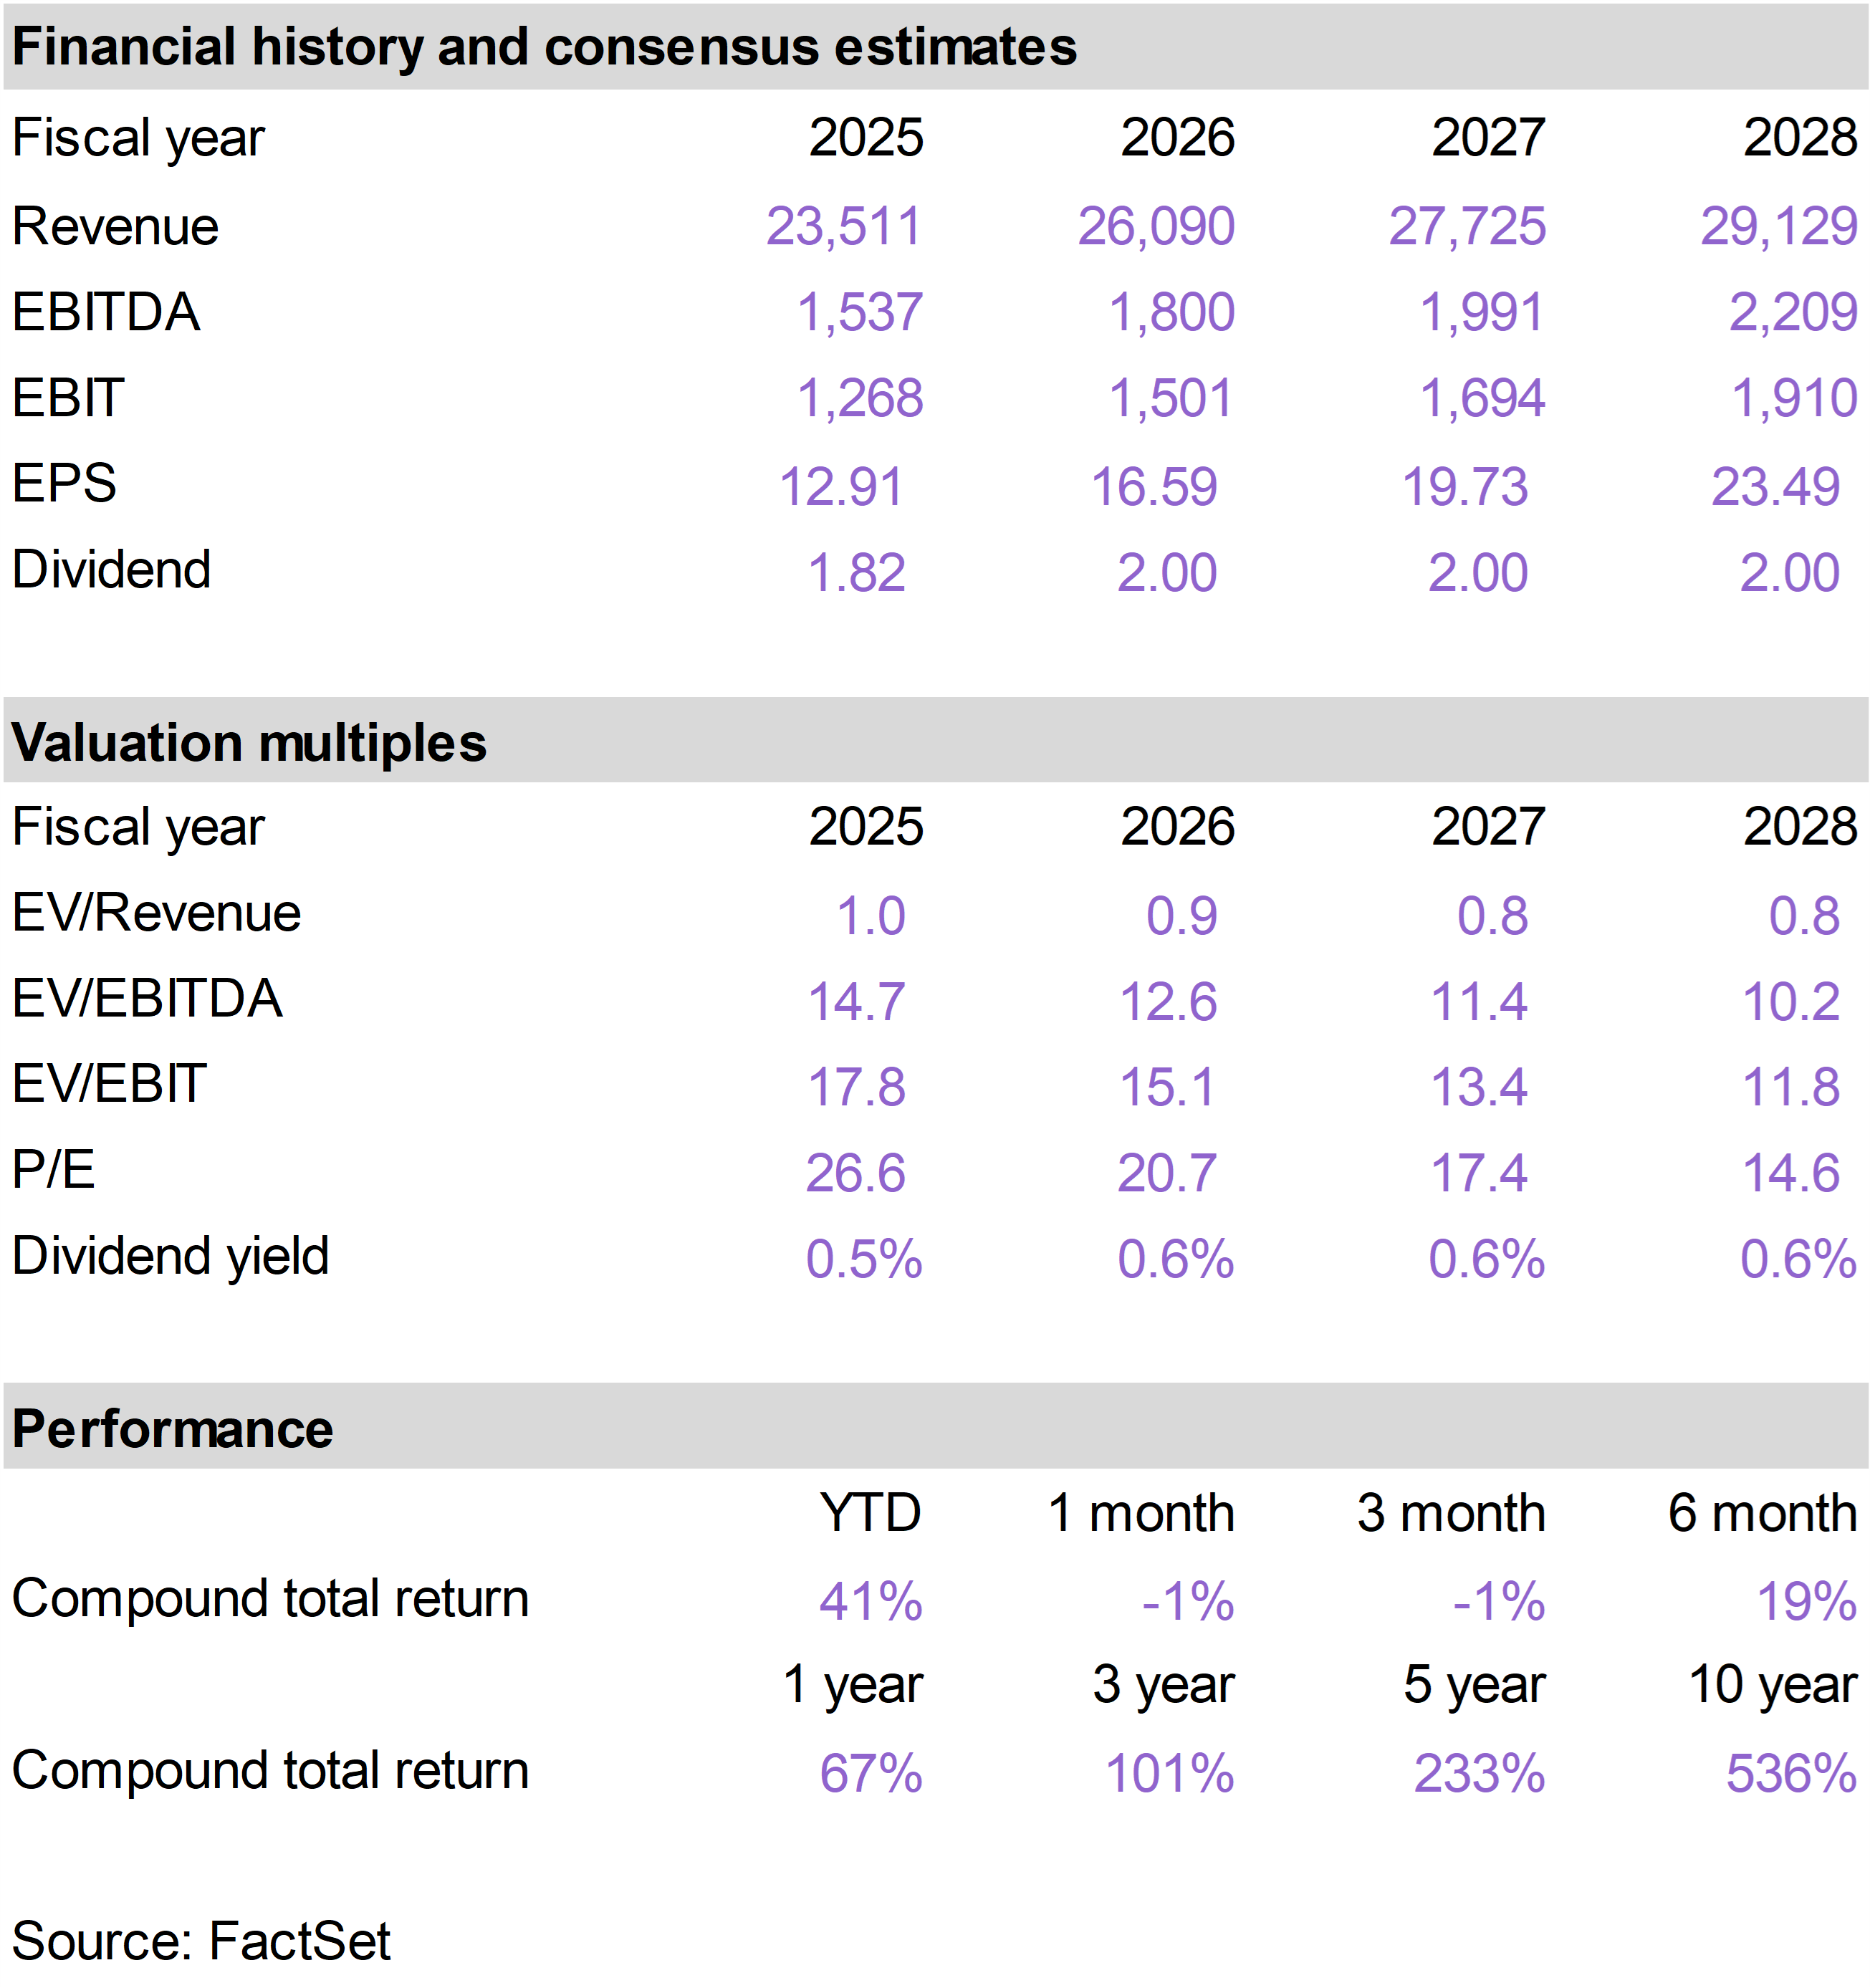
| | WESCO International (WCC) |
|
|
|
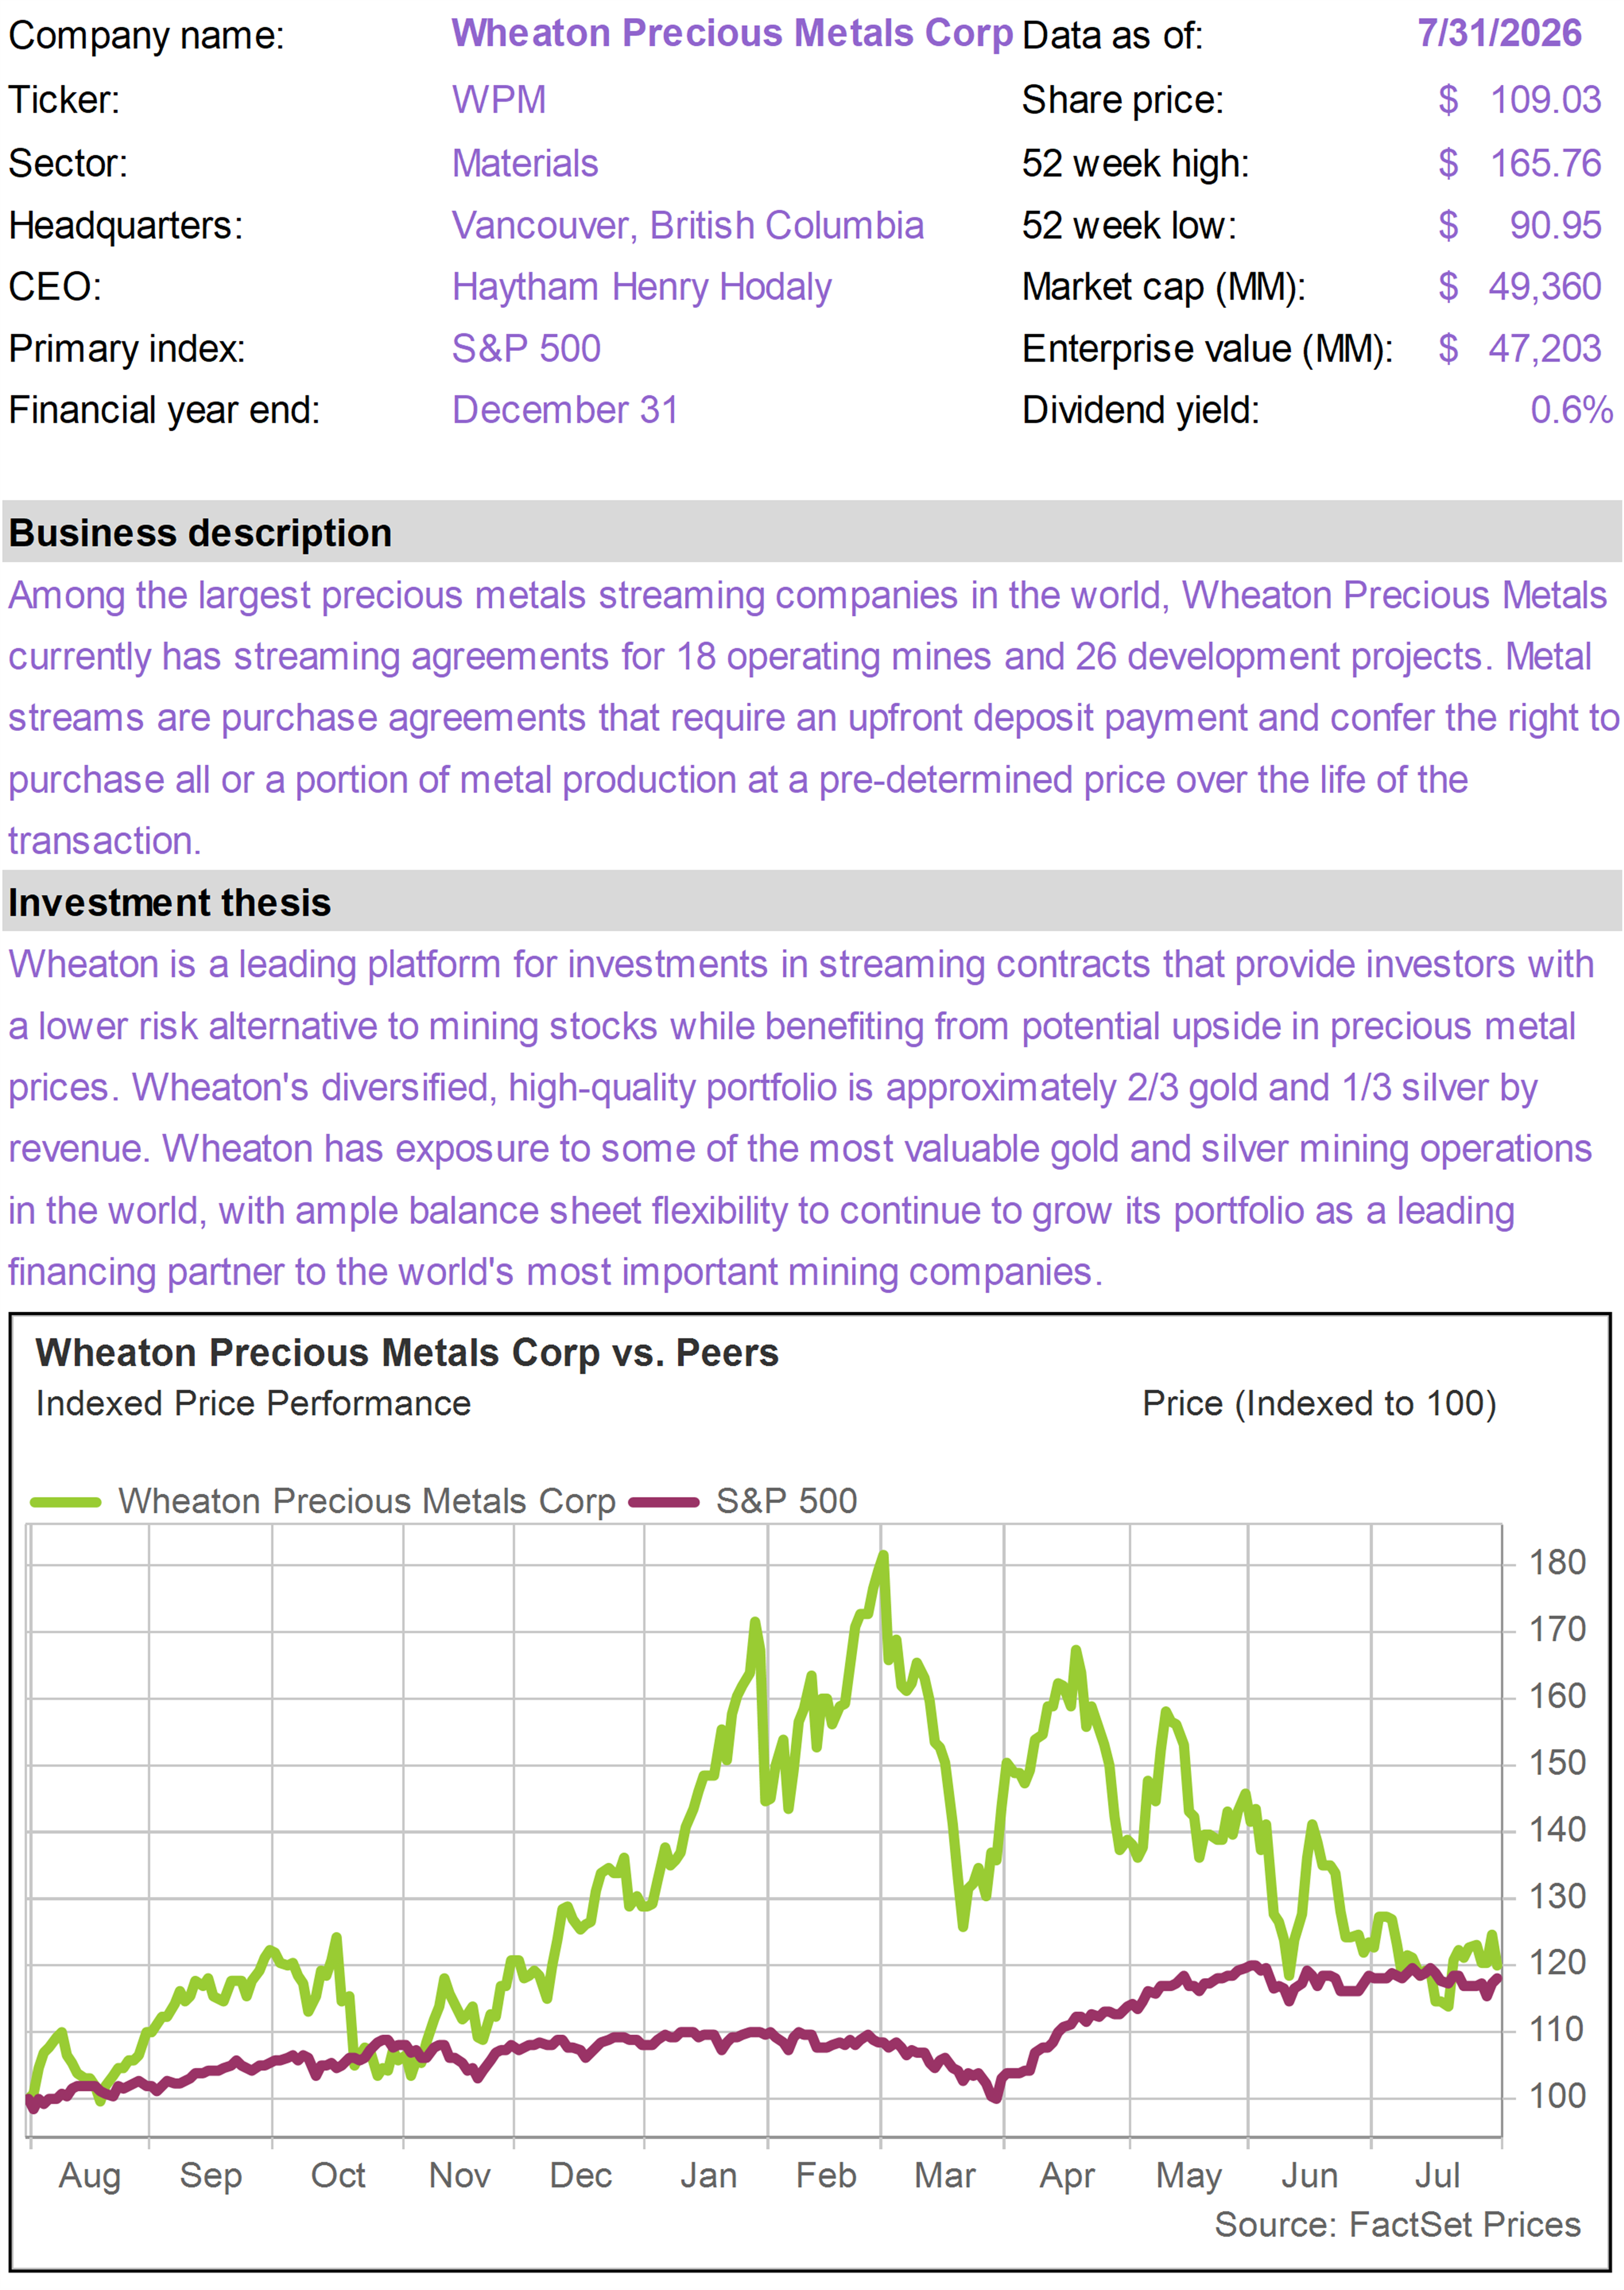
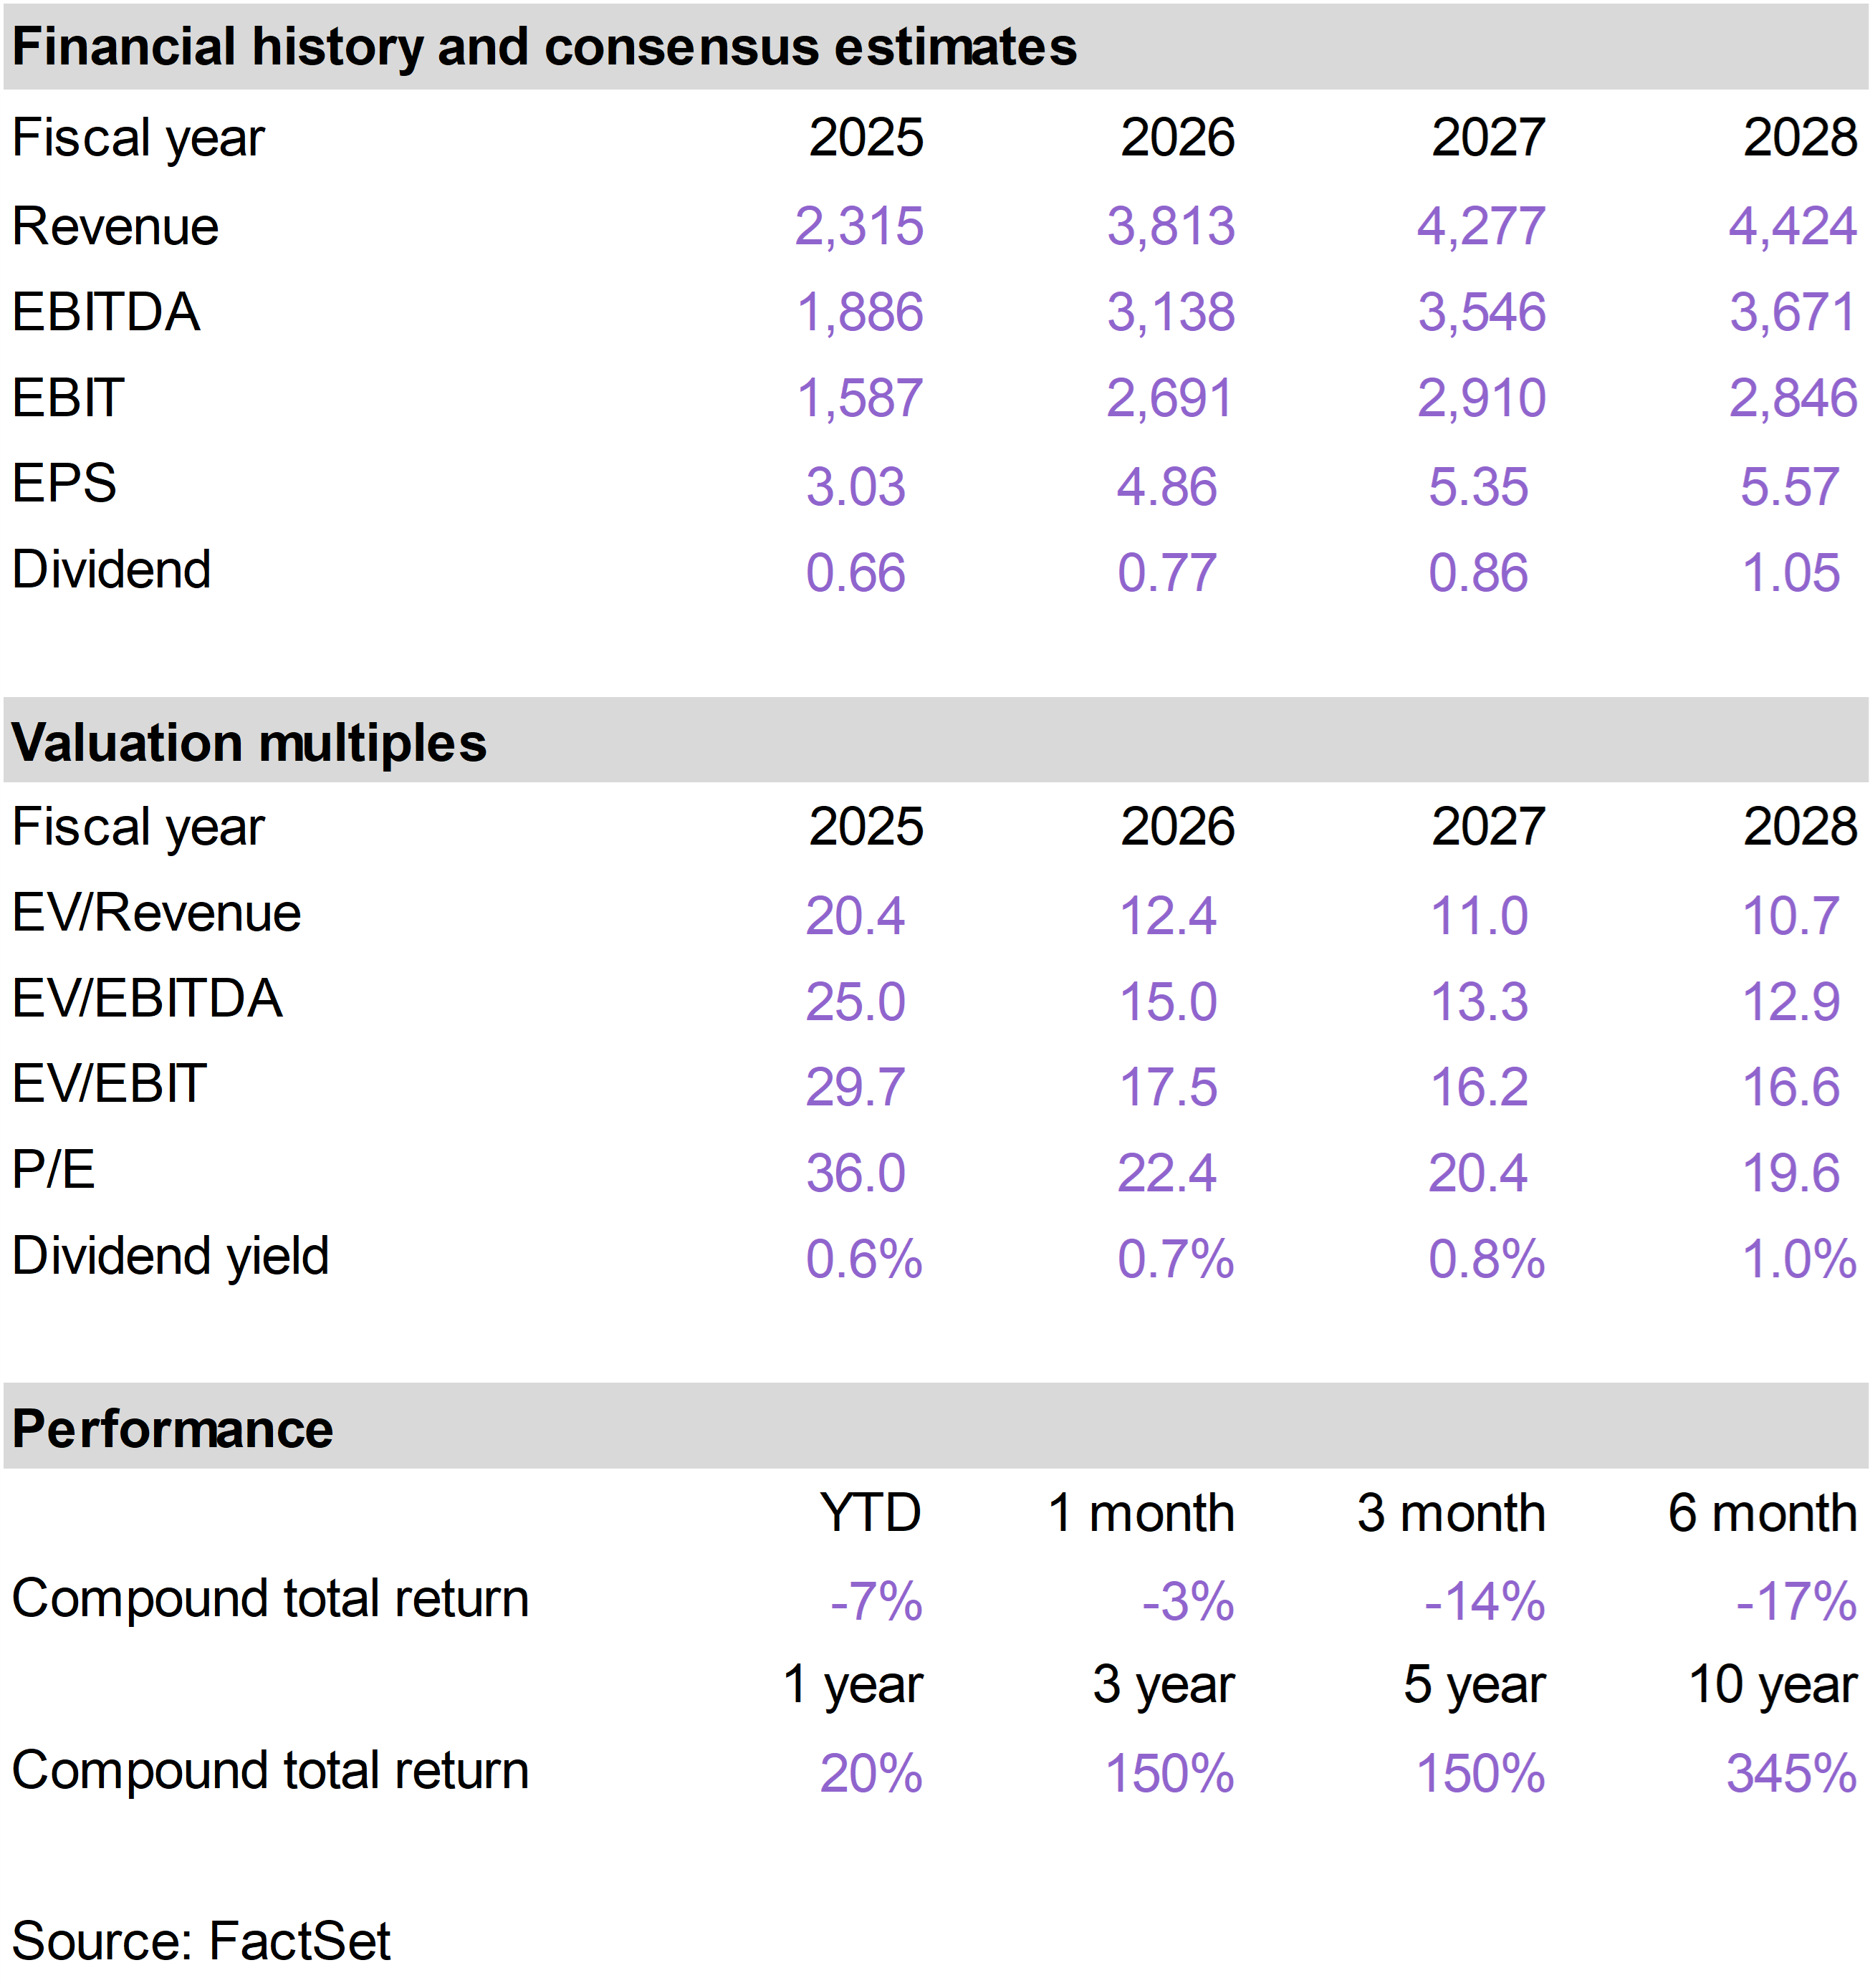
| | Wheaton Precious Metals (WPM) |
|
|
|
| | The 76research Inflation Protection Model Portfolio emphasizes business models that benefit from inflationary pressure. Holdings are typically selected from industries based on supply constrained real assets, including commodity and energy businesses, or companies that otherwise demonstrate superior pricing power. Drawing from an investable universe of expected inflation beneficiaries, specific holdings are chosen based on valuation and general business quality, growth and risk considerations. |
|
| | FOR SUBSCRIBER USE ONLY. DO NOT FORWARD OR SHARE. |
|
| | | |
|
|
|
|
|