| American Resilience Model Portfolio |
|
| Monthly Portfolio Review: July 2026Publication date: August 3, 2026 |
|
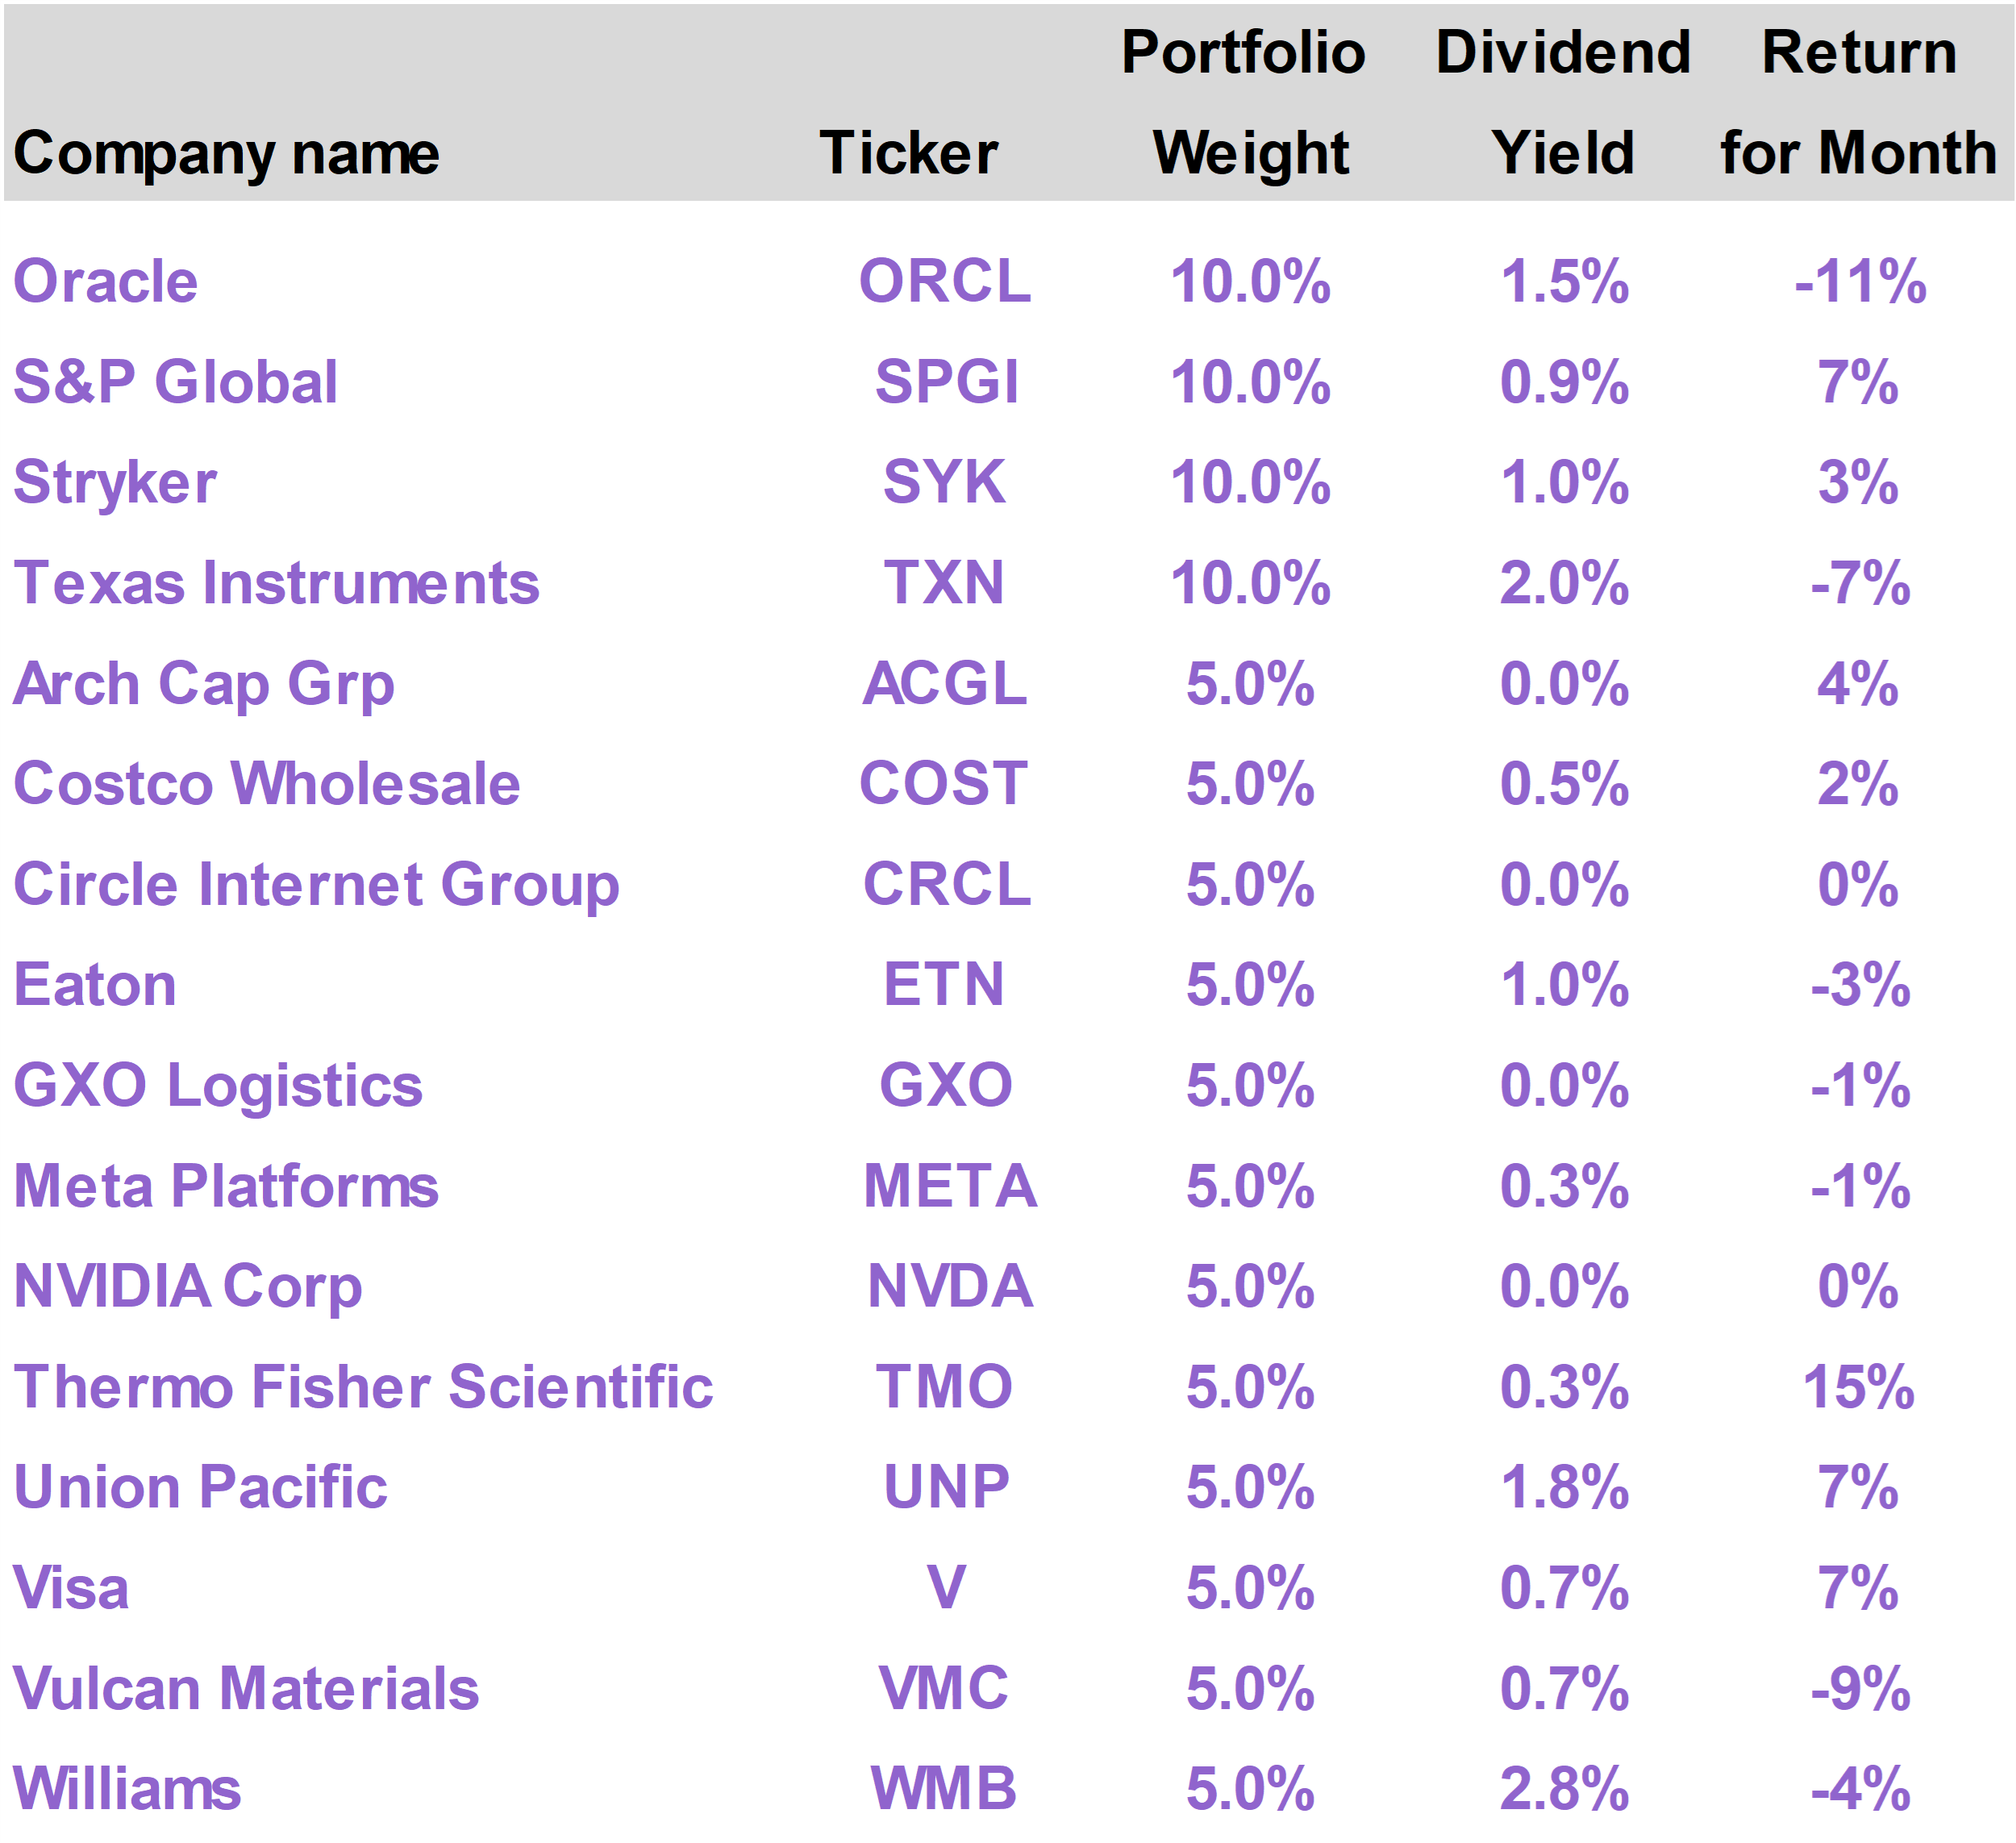
| | | Current portfolio holdings |
|
|
| | FOR SUBSCRIBER USE ONLY. DO NOT FORWARD OR SHARE. |
|
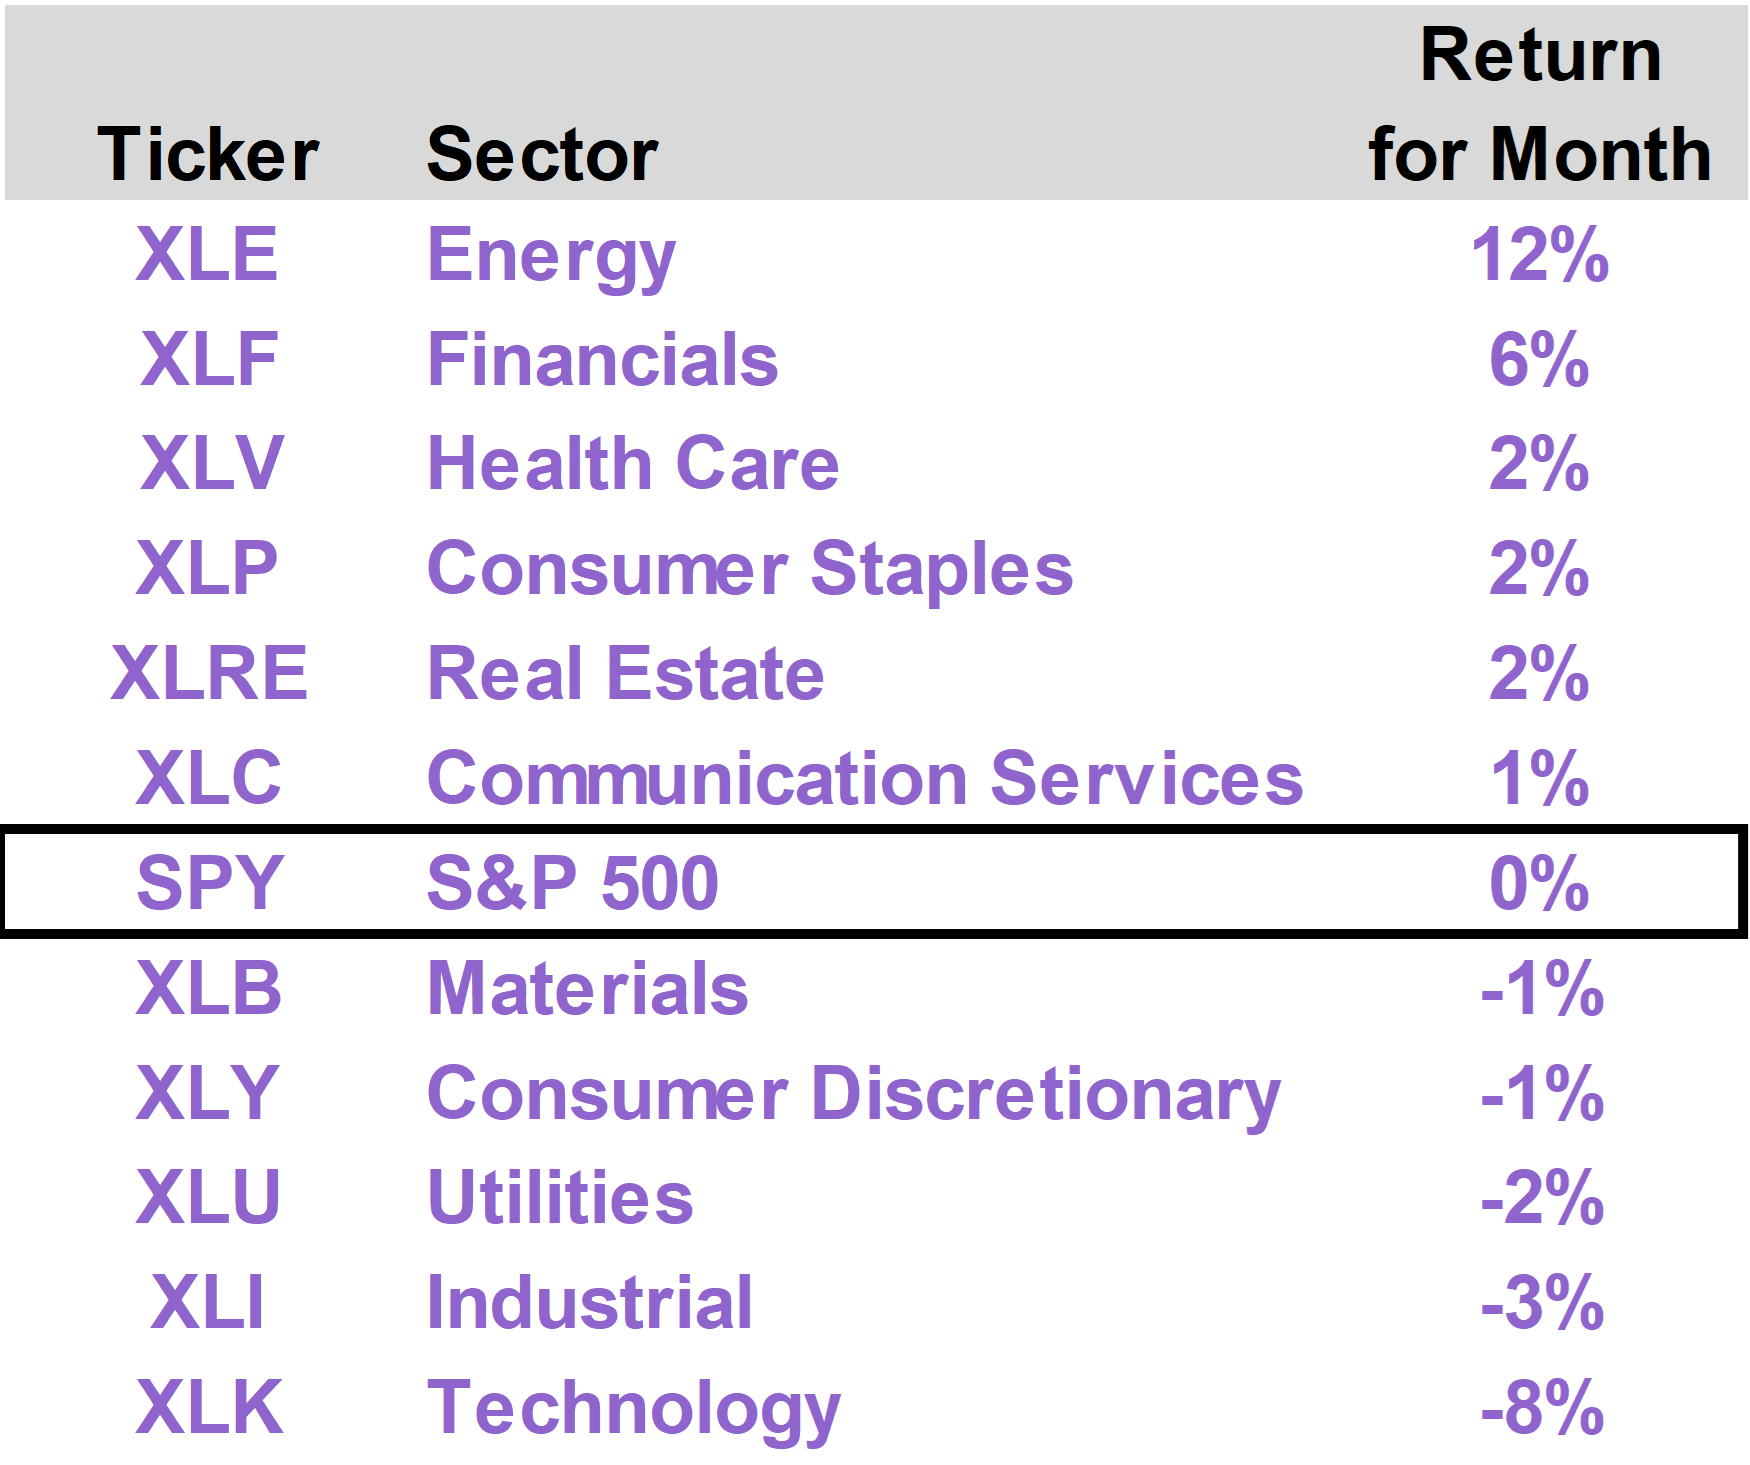
| | | Stocks faced new headwinds in July as the collapse of the U.S.-Iran ceasefire led to higher oil prices and upward movement in interest rates. Technology stocks came under pressure, declining 8%, while Energy stocks outperformed, advancing 12%. The S&P 500 generated a total return of -0.1%, with the tech-heavy NASDAQ faring worse, delivering a -3.2% total return in July. The American Resilience portfolio delivered a slightly positive return of 0.1%. Portfolio performance was led by Thermo Fisher Scientific (TMO), which advanced 15% on strong earnings. S&P Global (SPGI) also performed well, returning 7%, as shareholders received shares of Mobility Global (MBGL), which the company spun-off at the start of the month. The portfolio’s tech holdings were among the primary detractors. Although the conflict in Iran persists as a key macro overhang, the overall growth backdrop, including the AI buildout, remains encouraging.
|
|
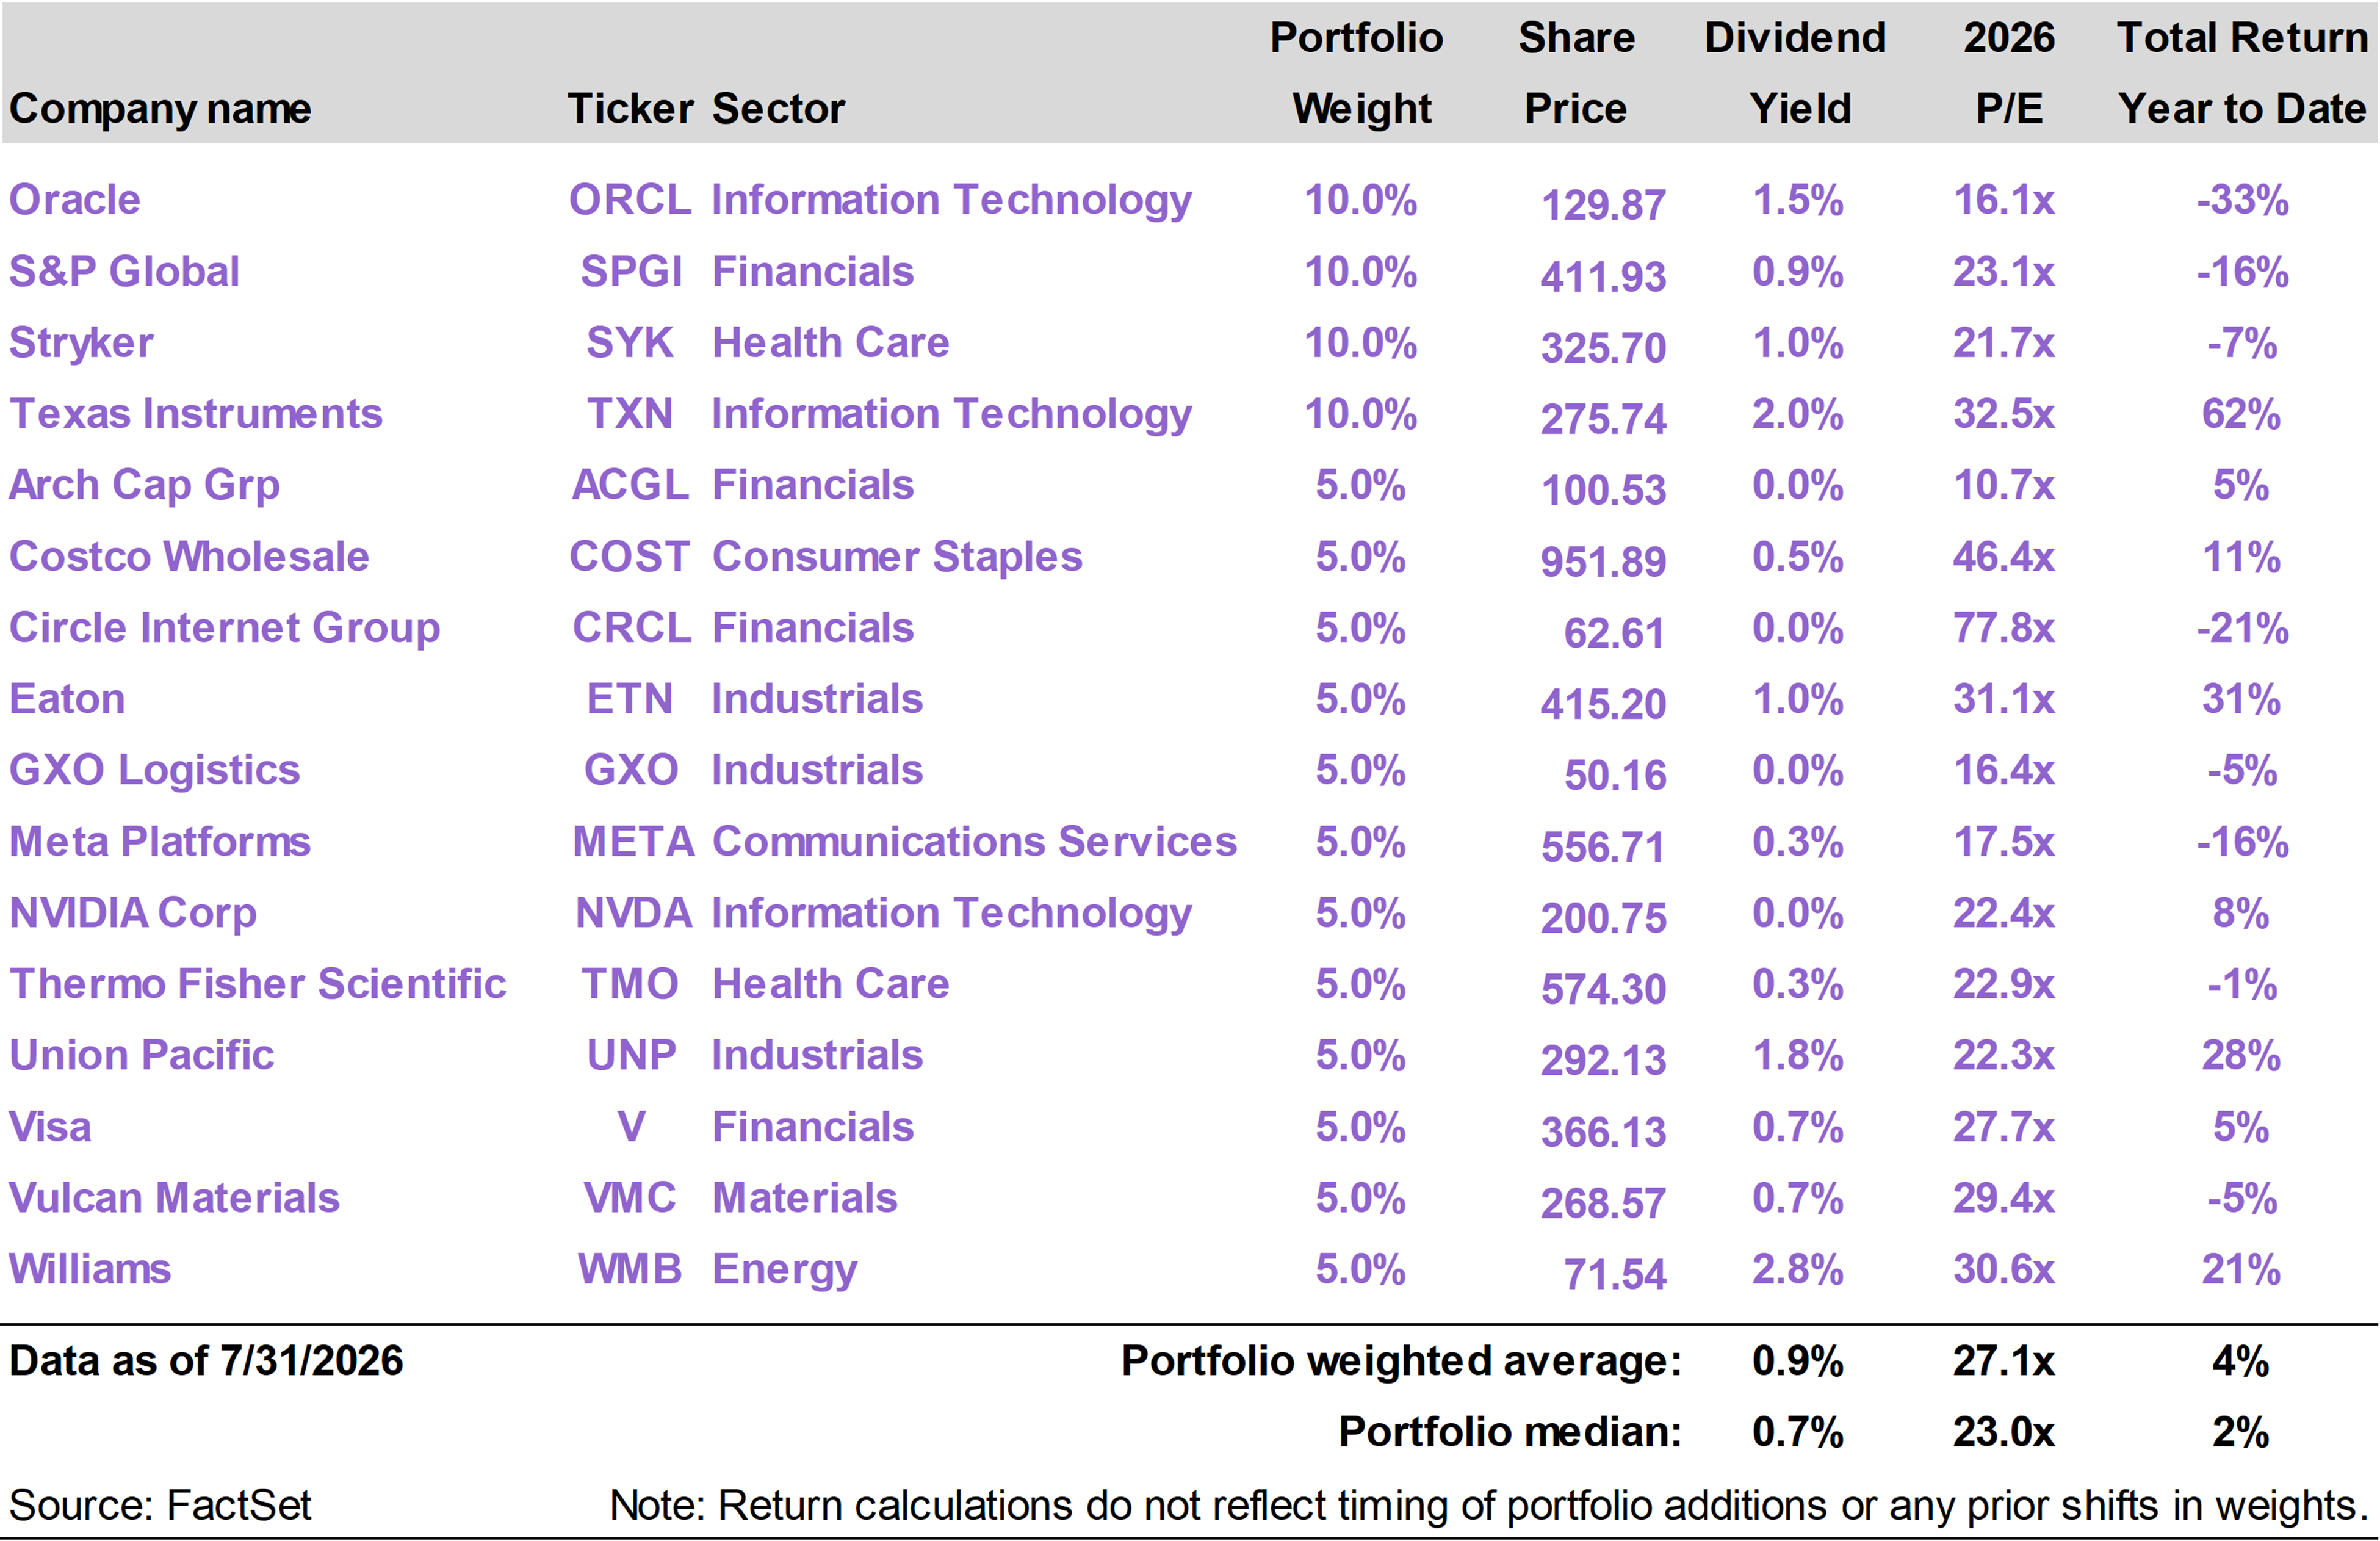
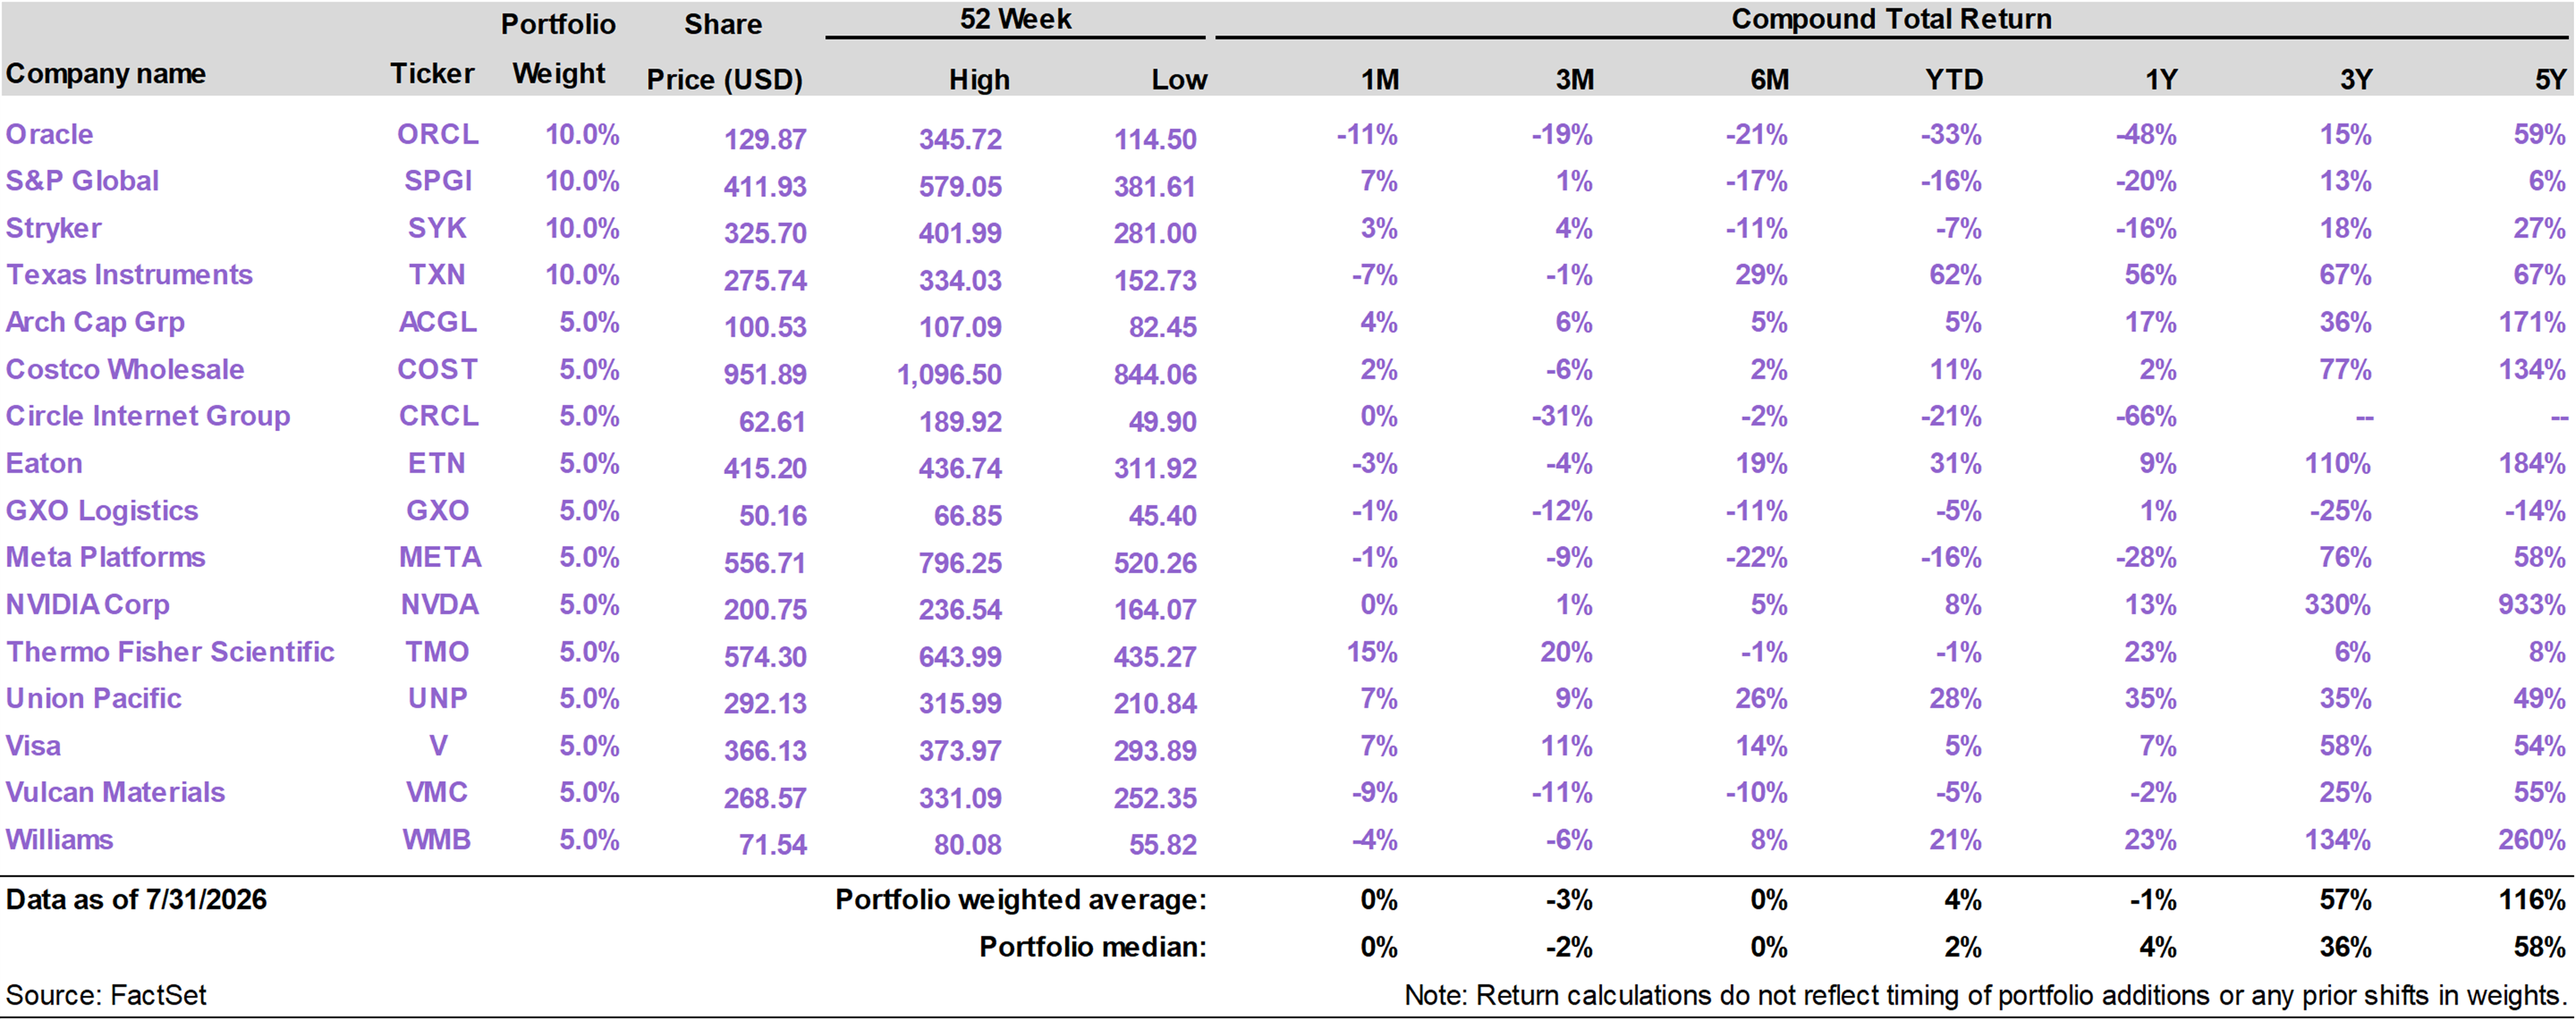
| | | The American Resilience portfolio generated a total return of 0.1% in July, slightly outpacing the S&P 500 Index return of -0.1%. On a year to date basis through the end of the month, the portfolio has returned 8.1%, versus the 10.1% return of the S&P 500.
The top performing portfolio positions in July were Thermo Fisher Scientific (TMO), which returned 15%; S&P Global (SPGI), which returned 7%; and Visa (V), which returned 7%.
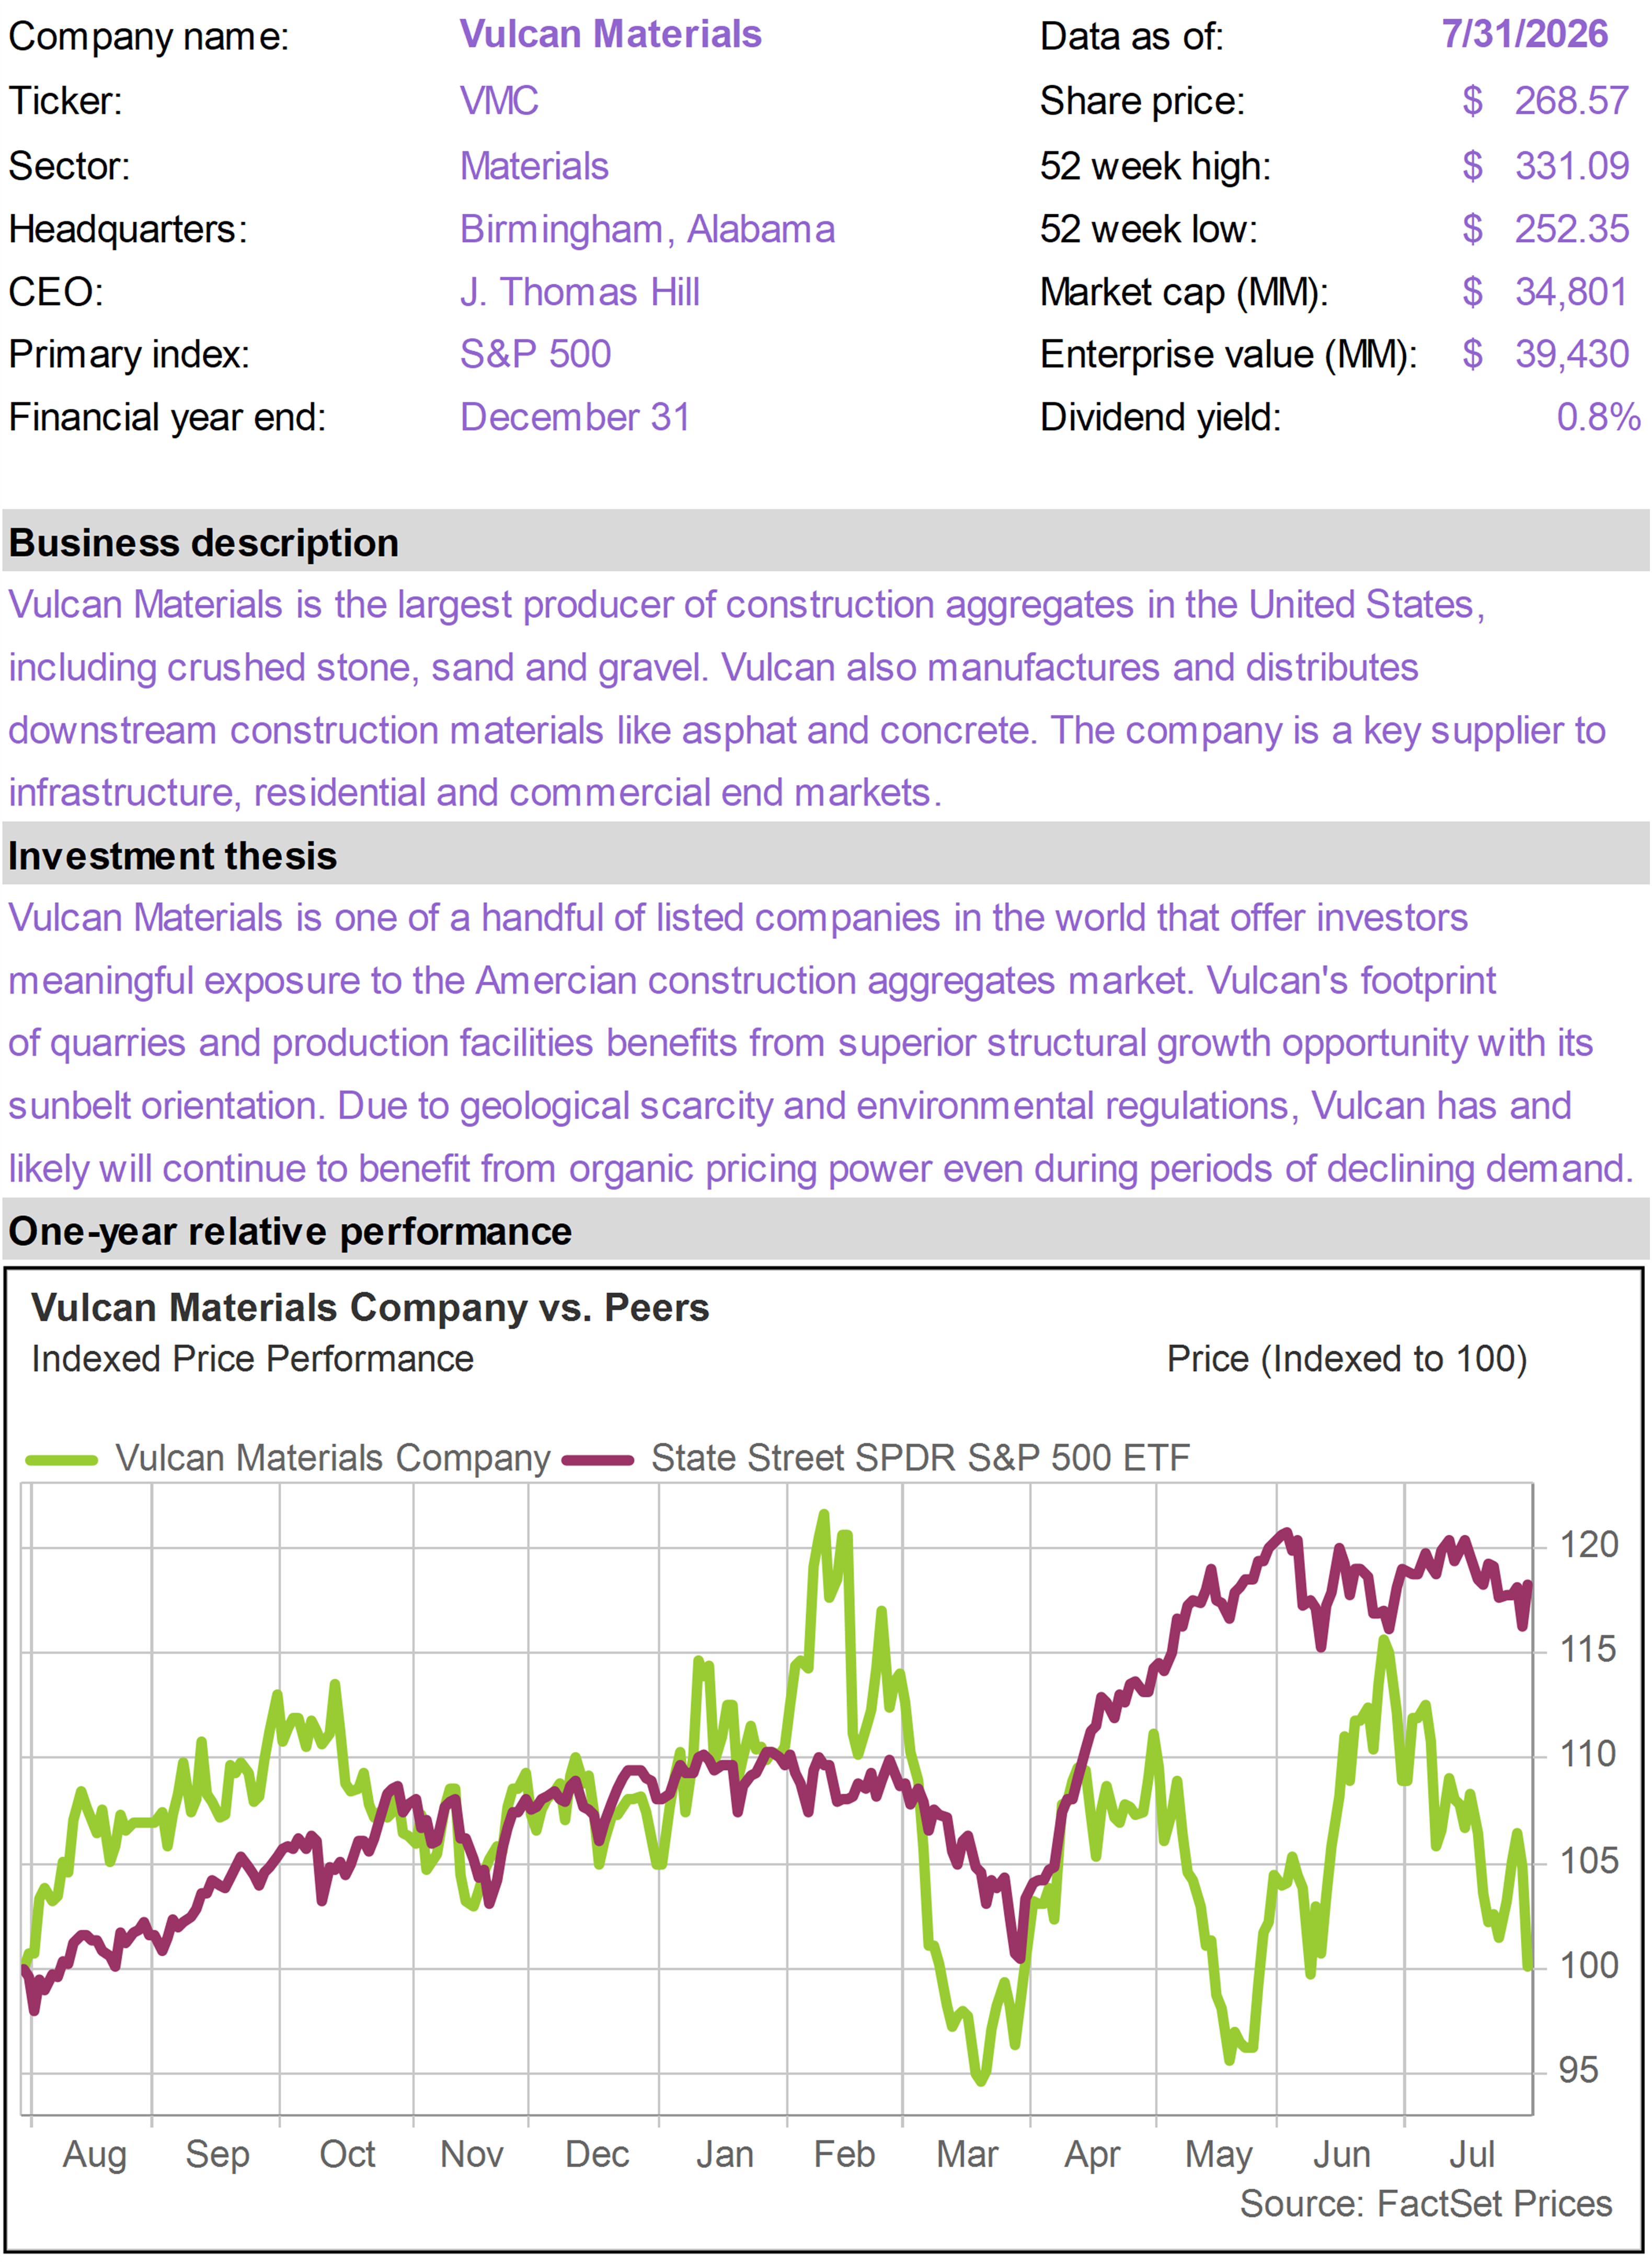
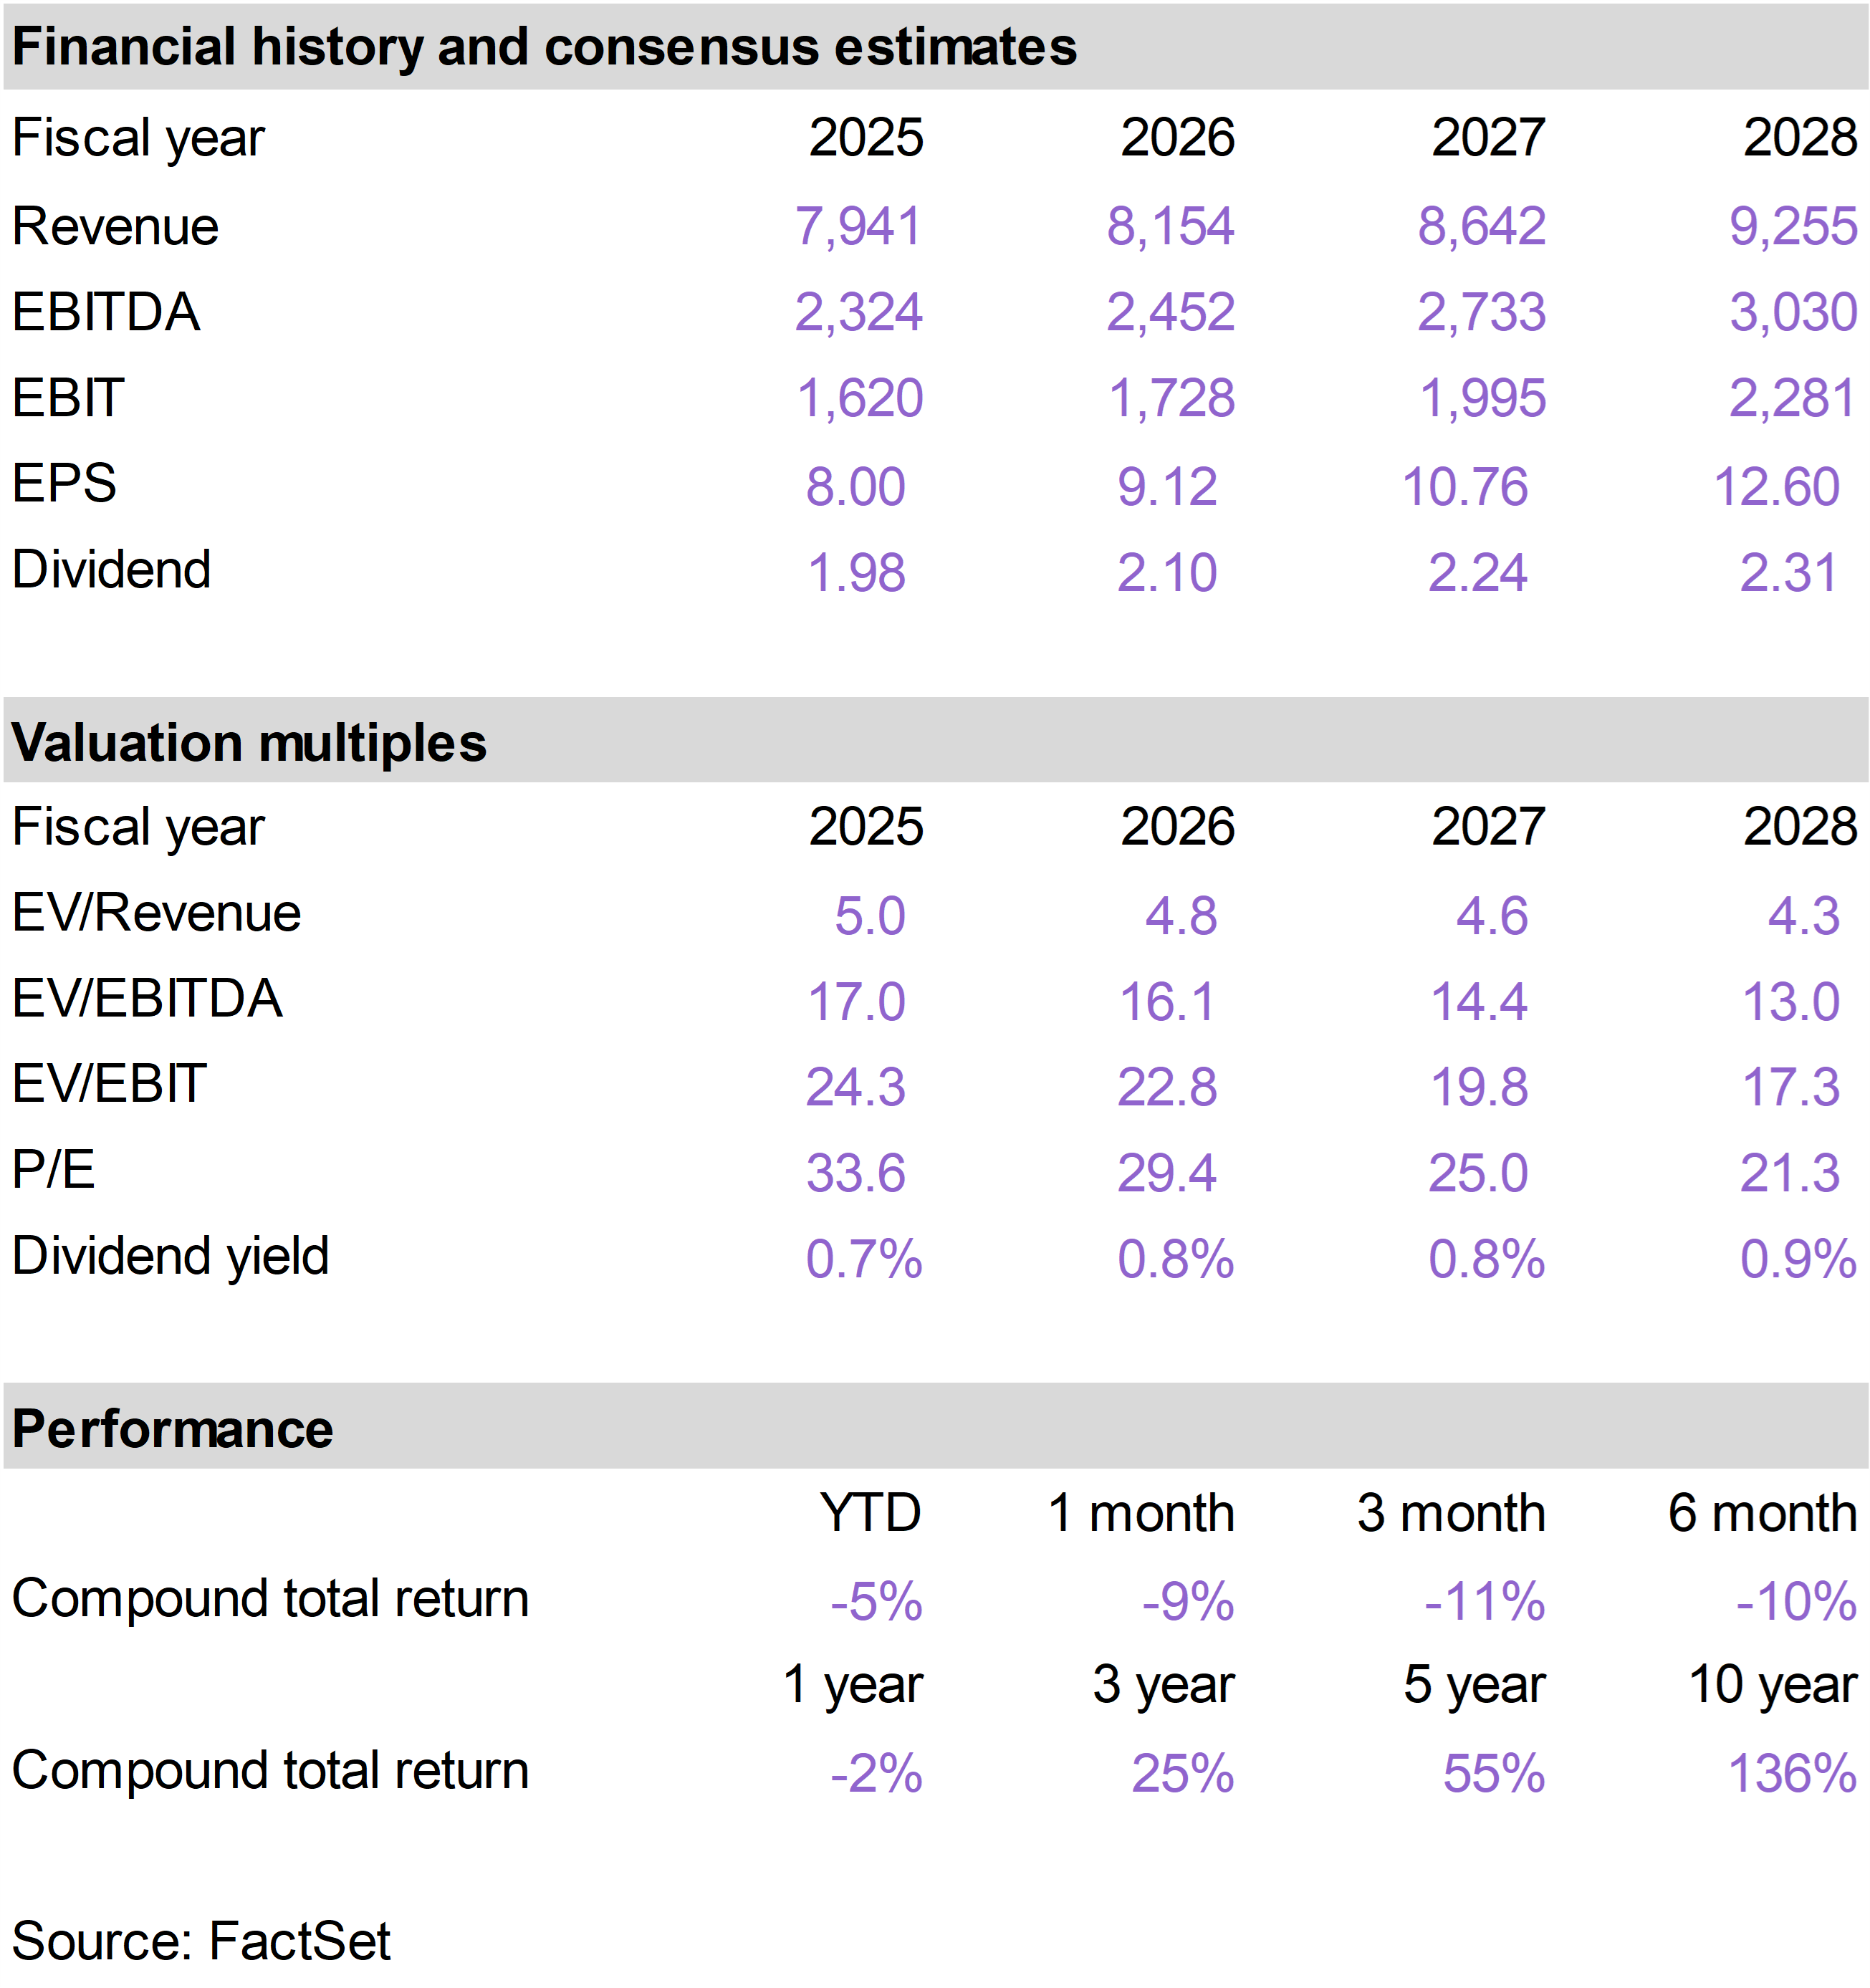
The worst performing positions were Oracle (ORCL), which returned -11%; Vulcan Materials (VMC), which returned -9%; and Texas Instruments (TXN), which returned -7%. |
|
|
Combat resumes
The most important market development in July was the renewed outbreak of combat between the United States and Iran.
In last month’s report, we discussed the collapse in oil prices that followed the Memorandum of Understanding between the two countries. The agreement reopened the Strait of Hormuz and created hope that a more durable resolution to the conflict was taking shape.
Unfortunately, that optimism proved premature.
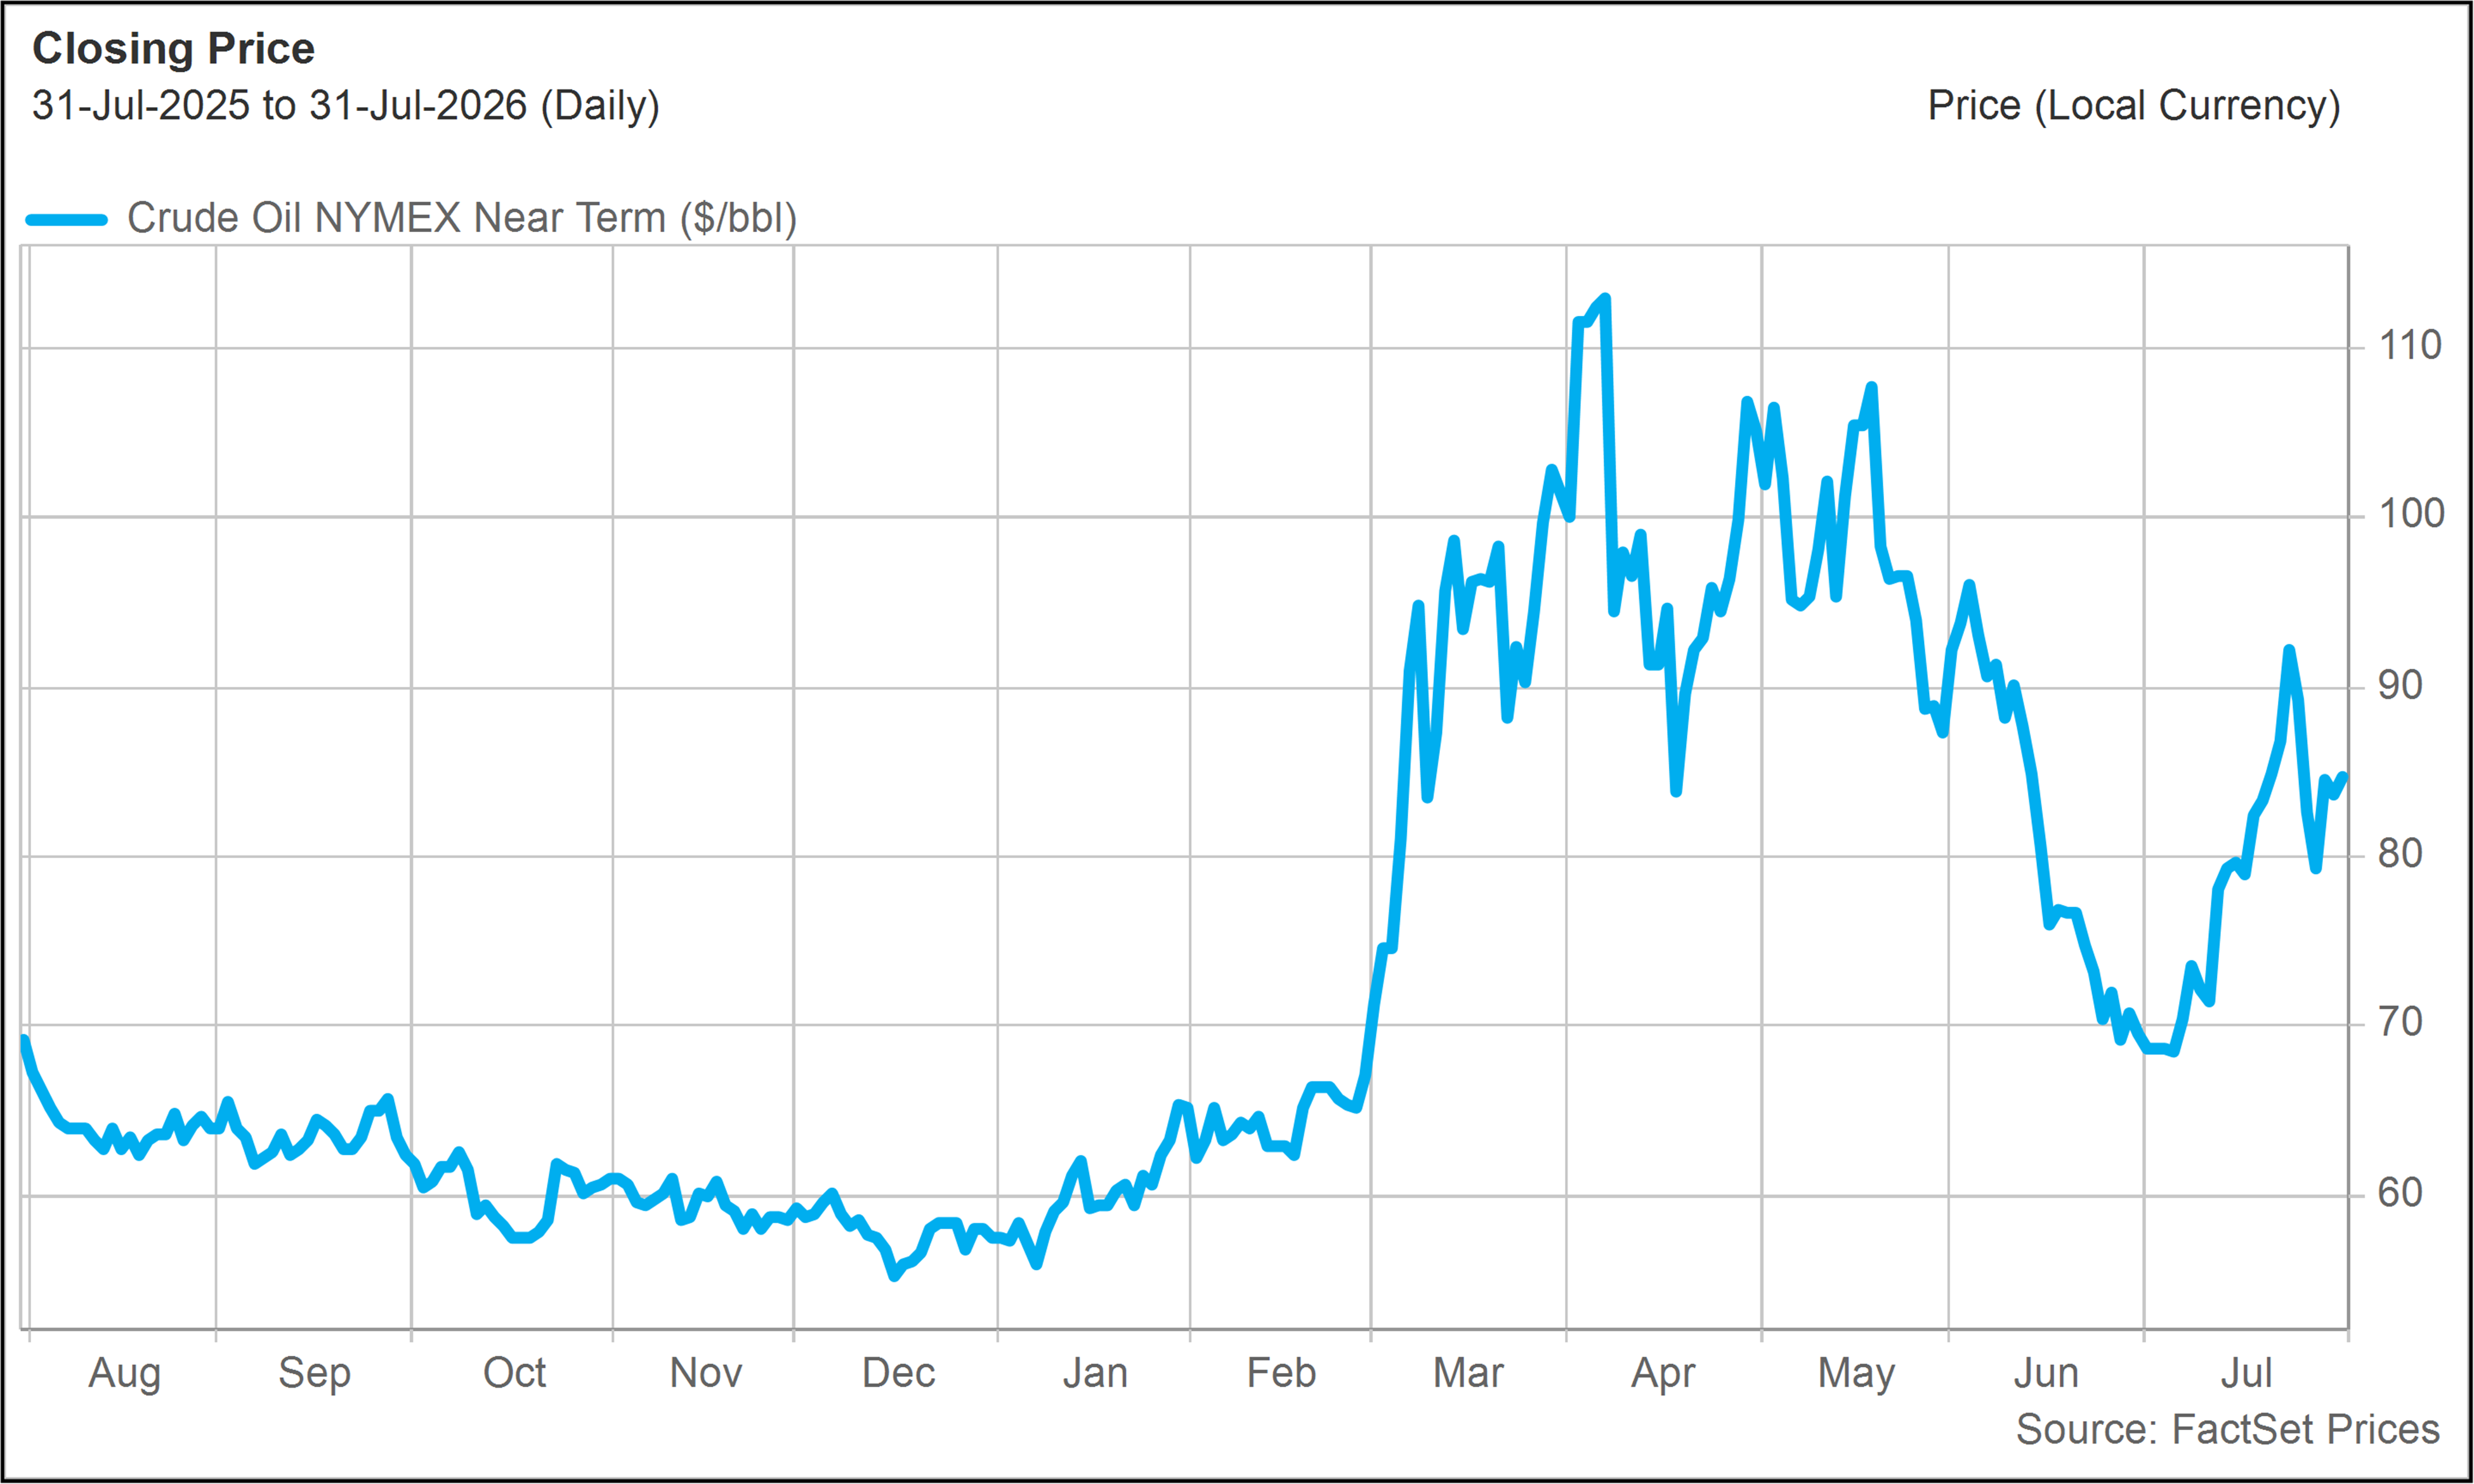
Fighting resumed in July, once again disrupting the movement of energy supplies through the Persian Gulf. Crude oil prices reversed sharply higher as traders rebuilt the geopolitical risk premium that had disappeared following the June agreement.
At the end of June, crude prices had dipped below $70 per barrel, their lowest level since February. By the end of July, crude oil had risen 22% to approximately $85 per barrel. |
|
|
| Crude Oil($/barrel - Last 12 Months) |
|
|
Energy stocks responded accordingly. The Energy sector advanced 12% in July, making it the best-performing part of the S&P 500 by a wide margin.
The speed of the reversal was striking. Energy had been the worst-performing sector in June, falling 5% as the market anticipated a normalization of oil flows. One month later, it was the clear market leader.
As we discussed last week in the 76report (Prepare, Don’t Predict: Investing Amid Renewed Middle East Turmoil), the whipsaw in energy serves as a good reminder of the inherent uncertainty surrounding geopolitical events.
It also illustrates why maintaining exposure to Energy can be valuable even when the immediate geopolitical outlook appears to be improving.
A more complicated inflation picture
The increase in oil prices came just as the inflation outlook appeared to be improving substantially.
The June inflation reports, published in July, showed a meaningful decline in headline inflation, largely reflecting the earlier collapse in energy prices. Core inflation also appeared increasingly contained, with shelter and several service categories showing signs of moderation.
These reports provided evidence that the restrictive monetary policy of the past several years was finally having its intended effect.
But inflation data is backward-looking. The June reports captured the decline in oil prices that followed the temporary peace agreement. They did not reflect the renewed fighting or the sharp rebound in energy prices during July.
This does not mean the inflation improvement has been completely reversed. A rise in oil prices does not automatically translate into persistent inflation, particularly if the increase proves temporary.
But higher oil prices do affect the economy indirectly through various channels, lifting transportation and other operating costs across sectors.
Impact on interest rates
Interest rates moved higher in July as rising oil prices led to diminished expectations for a shift toward easier monetary policy.
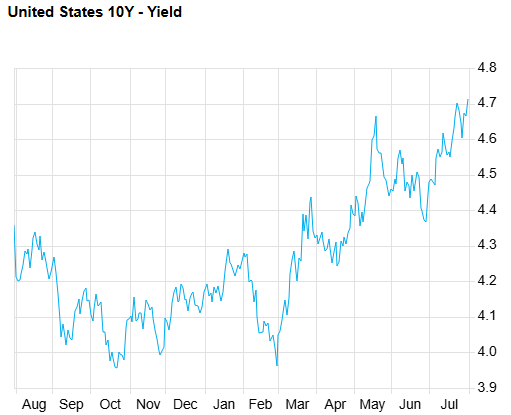
The 10-Year Treasury yield increased more than a quarter-point, from 4.44% at the end of June to 4.71% at the end of July. |
|
|
| 10-Year Treasury Yields—Last 12 Months(Source: FactSet) |
|
|
At its mid-July meeting, the Federal Reserve left the short-term fed funds rate unchanged at the 3.5% to 3.75% target range.
But with three voting members of the Federal Open Market Committee (FOMC) dissenting in favor of higher rates, the debate has moved away from when the Fed might cut rates and toward whether further tightening may become necessary.
That represents an important change in market psychology. Only a few months ago, many investors expected declining energy prices and moderating inflation to create a relatively straightforward path toward lower rates.
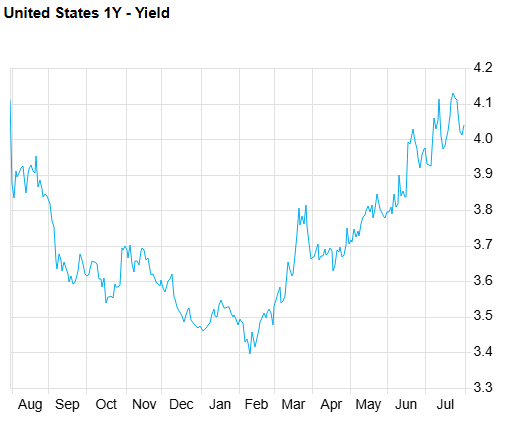
Now, with One-Year Treasury yields slightly higher than 4%, at least one quarter-point interest rate hike within the next 12 months is priced into Treasuries. |
|
|
| 1-Year Treasury Yields—Last 12 Months(Source: FactSet) |
|
| Economic resilience
The economic data published during July also gave the Fed little reason to move aggressively toward lower rates.
The preliminary second quarter GDP report suggested that underlying domestic demand remained healthier than the headline growth rate initially implied. Consumer spending continued to expand, while business investment remained solid.
Investment in equipment and technology infrastructure was an especially important source of support.
The enormous spending associated with data centers, semiconductors, electrical infrastructure and the broader AI buildout is not just a stock market narrative. It is having a measurable impact on capital investment throughout the economy.
The continued strength of consumer spending and business investment means the economy is not sending the Fed an urgent signal that lower rates are needed.
That is encouraging from an earnings and recession-risk perspective. But it also means interest rates may remain elevated for longer than investors had hoped, with the Fed likely less nervous about triggering an economic contraction.
A flat market masks a major rotation
Against this backdrop, the S&P 500 generated an approximately flat return in July. That seemingly uneventful result obscures a dramatic rotation beneath the surface.
The Energy sector, as noted, advanced 12%, followed by a 6% return from Financials. Meanwhile, Technology declined 8% and was the most significant detractor to returns. |
|
|
|
From a sector perspective, the most notable aspect of the month was that the S&P 500 remained approximately flat despite severe weakness in tech, even though tech now represents nearly 40% of the index.
Investors did not abandon the market altogether. They moved capital from one part of the market to another.
This arguably represents healthier market breadth than an environment in which nearly all returns depend on a small group of mega-cap companies.
But the forces driving the rotation were not entirely favorable.
Energy benefited from geopolitical instability. Financials benefited in part from higher interest rates and a steeper yield curve. Defensive sectors benefited as investors became more cautious.
The market became more diversified, but it did so largely because the macroeconomic backdrop became less comfortable.
AI shakeout
Technology was the clear casualty of the July market environment. The sector declined 8%, with some semiconductor, hardware and AI-infrastructure stocks falling substantially more than the sector average.
There were two interconnected sources of pressure.
The first was interest rates.
Higher long-term bond yields reduce the present value of earnings expected far in the future. This effect is especially significant for high-growth companies whose valuations depend on many years of future expansion.
The second was growing scrutiny of AI capital spending.
The largest Technology companies continue to commit extraordinary sums to data centers, processors, networking equipment and electrical infrastructure. The scale of this spending demonstrates management teams’ confidence that AI will become a major source of future growth.
But investors are increasingly interested in proof that the spending will generate an adequate return. This focus became especially important during July’s earnings season.
Companies that demonstrated strong cloud demand and visible AI monetization were treated more favorably. Companies that increased capital spending without providing equally compelling evidence of near-term financial returns came under pressure.
The path forward
The short-term trajectory of markets will likely continue to depend heavily on the Iranian conflict.
A credible and lasting agreement that restores normal shipping through the Strait of Hormuz could cause oil prices to retreat, improve the inflation outlook and give the Fed greater flexibility. That scenario could provide meaningful relief to Technology and other interest rate sensitive assets.
Without such an agreement, energy prices may remain volatile, interest rate relief could be delayed, and investors may continue to favor businesses offering immediate cash flow over those whose valuations depend primarily on distant growth.
But while uncertainty around Iran, oil and interest rates represents a major headwind, investors should not lose sight of the broader backdrop of healthy economic growth and sustained technology-related investment.
The strong results recently reported by both Microsoft (MSFT) and Amazon (AMZN) provide important evidence that the AI infrastructure buildout is being supported by genuine customer demand.
MSFT reported quarterly revenue of approximately $90 billion, up 18% year-over-year. Cloud services revenue, which increasingly represents demand for AI compute capacity, grew 43%.
AMZN’s cloud business delivered even sharper acceleration. Amazon Web Services (AWS) revenue increased 37% to $42 billion—its fastest growth in more than four years.
Management indicated that much of its available computing capacity for 2027 has already been reserved by customers, with significant commitments extending into 2028.
These are not the results of an infrastructure buildout searching for customers. They suggest that new capacity is being absorbed rapidly and that businesses remain willing to spend heavily to gain access to advanced computing and AI capabilities.
The strong growth posted by these AI industry leaders suggest that July’s pressure on Technology stocks was more likely a reassessment of valuations, financing costs and the timing of returns—not a collapse in the underlying growth opportunity.
Markets may remain volatile as investors respond to developments in Iran, oil prices and interest rates. Yet beneath these short-term pressures, the economy continues to expand and demand for computing infrastructure remains exceptionally strong.
A resolution of the Iranian conflict could therefore produce a powerful combination: lower energy prices and interest rates alongside continued growth in AI-related investment and earnings. Even without an immediate resolution, the long-term technology and productivity story remains intact. |
|
| | |
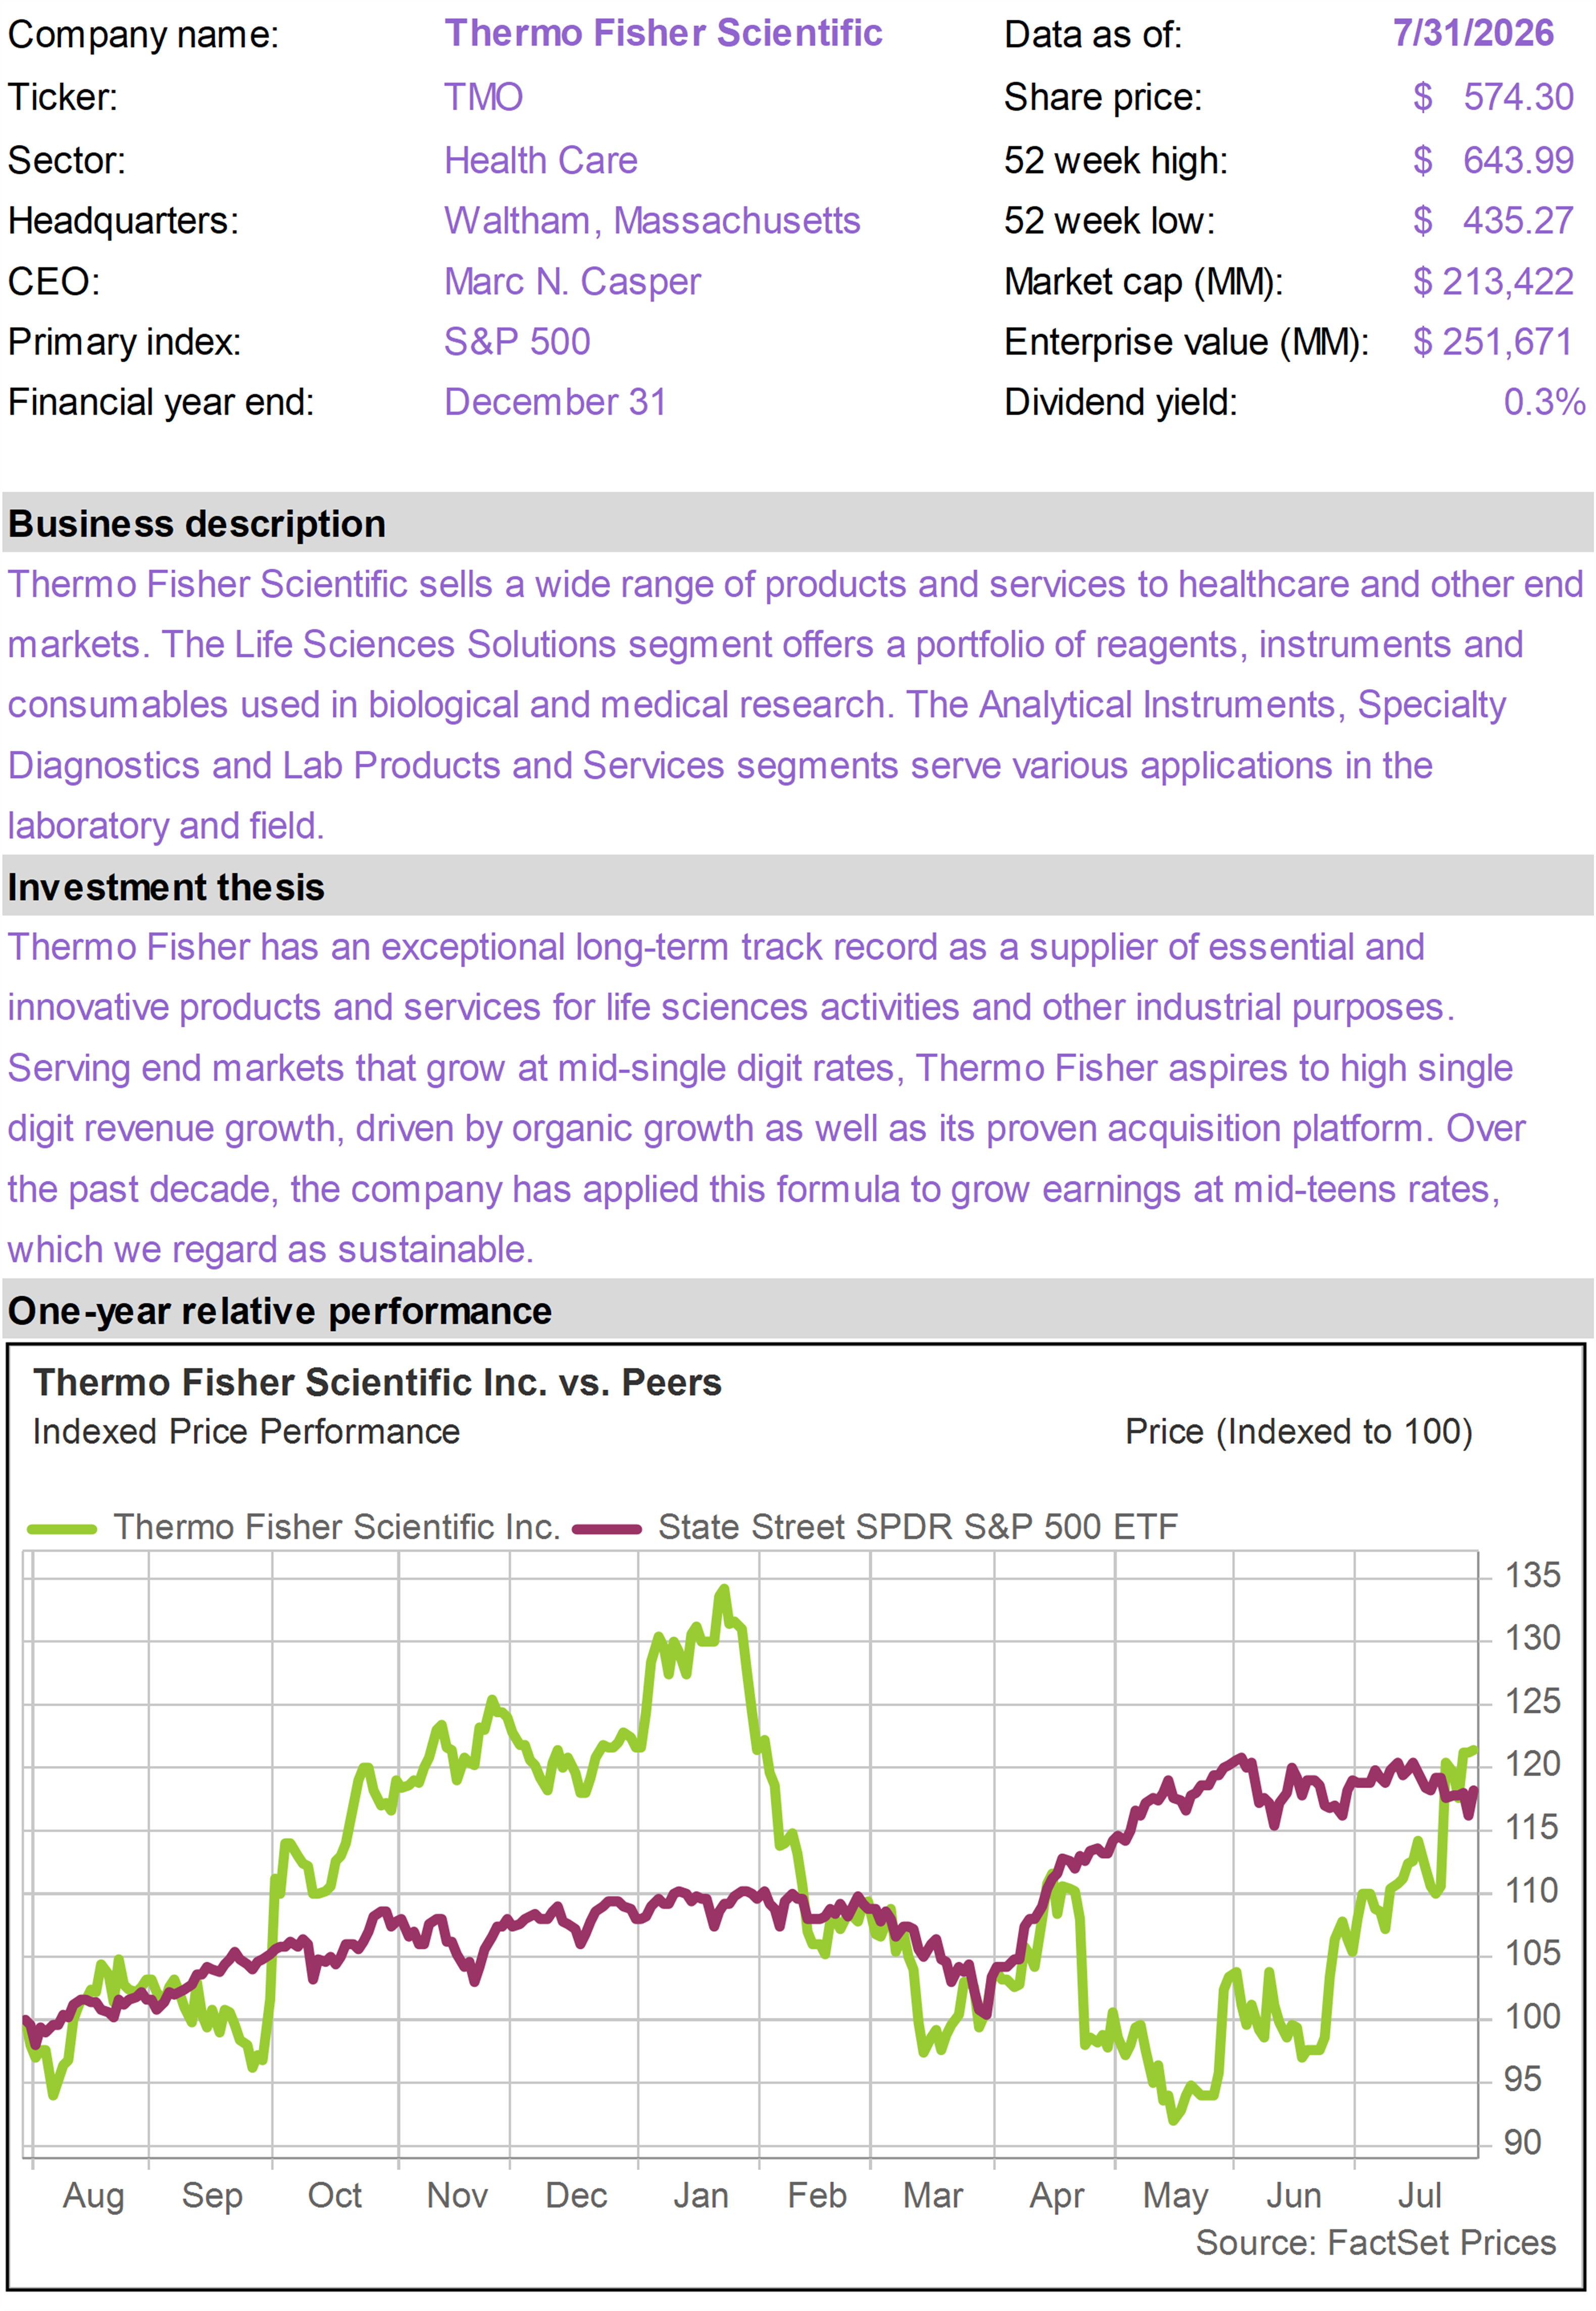
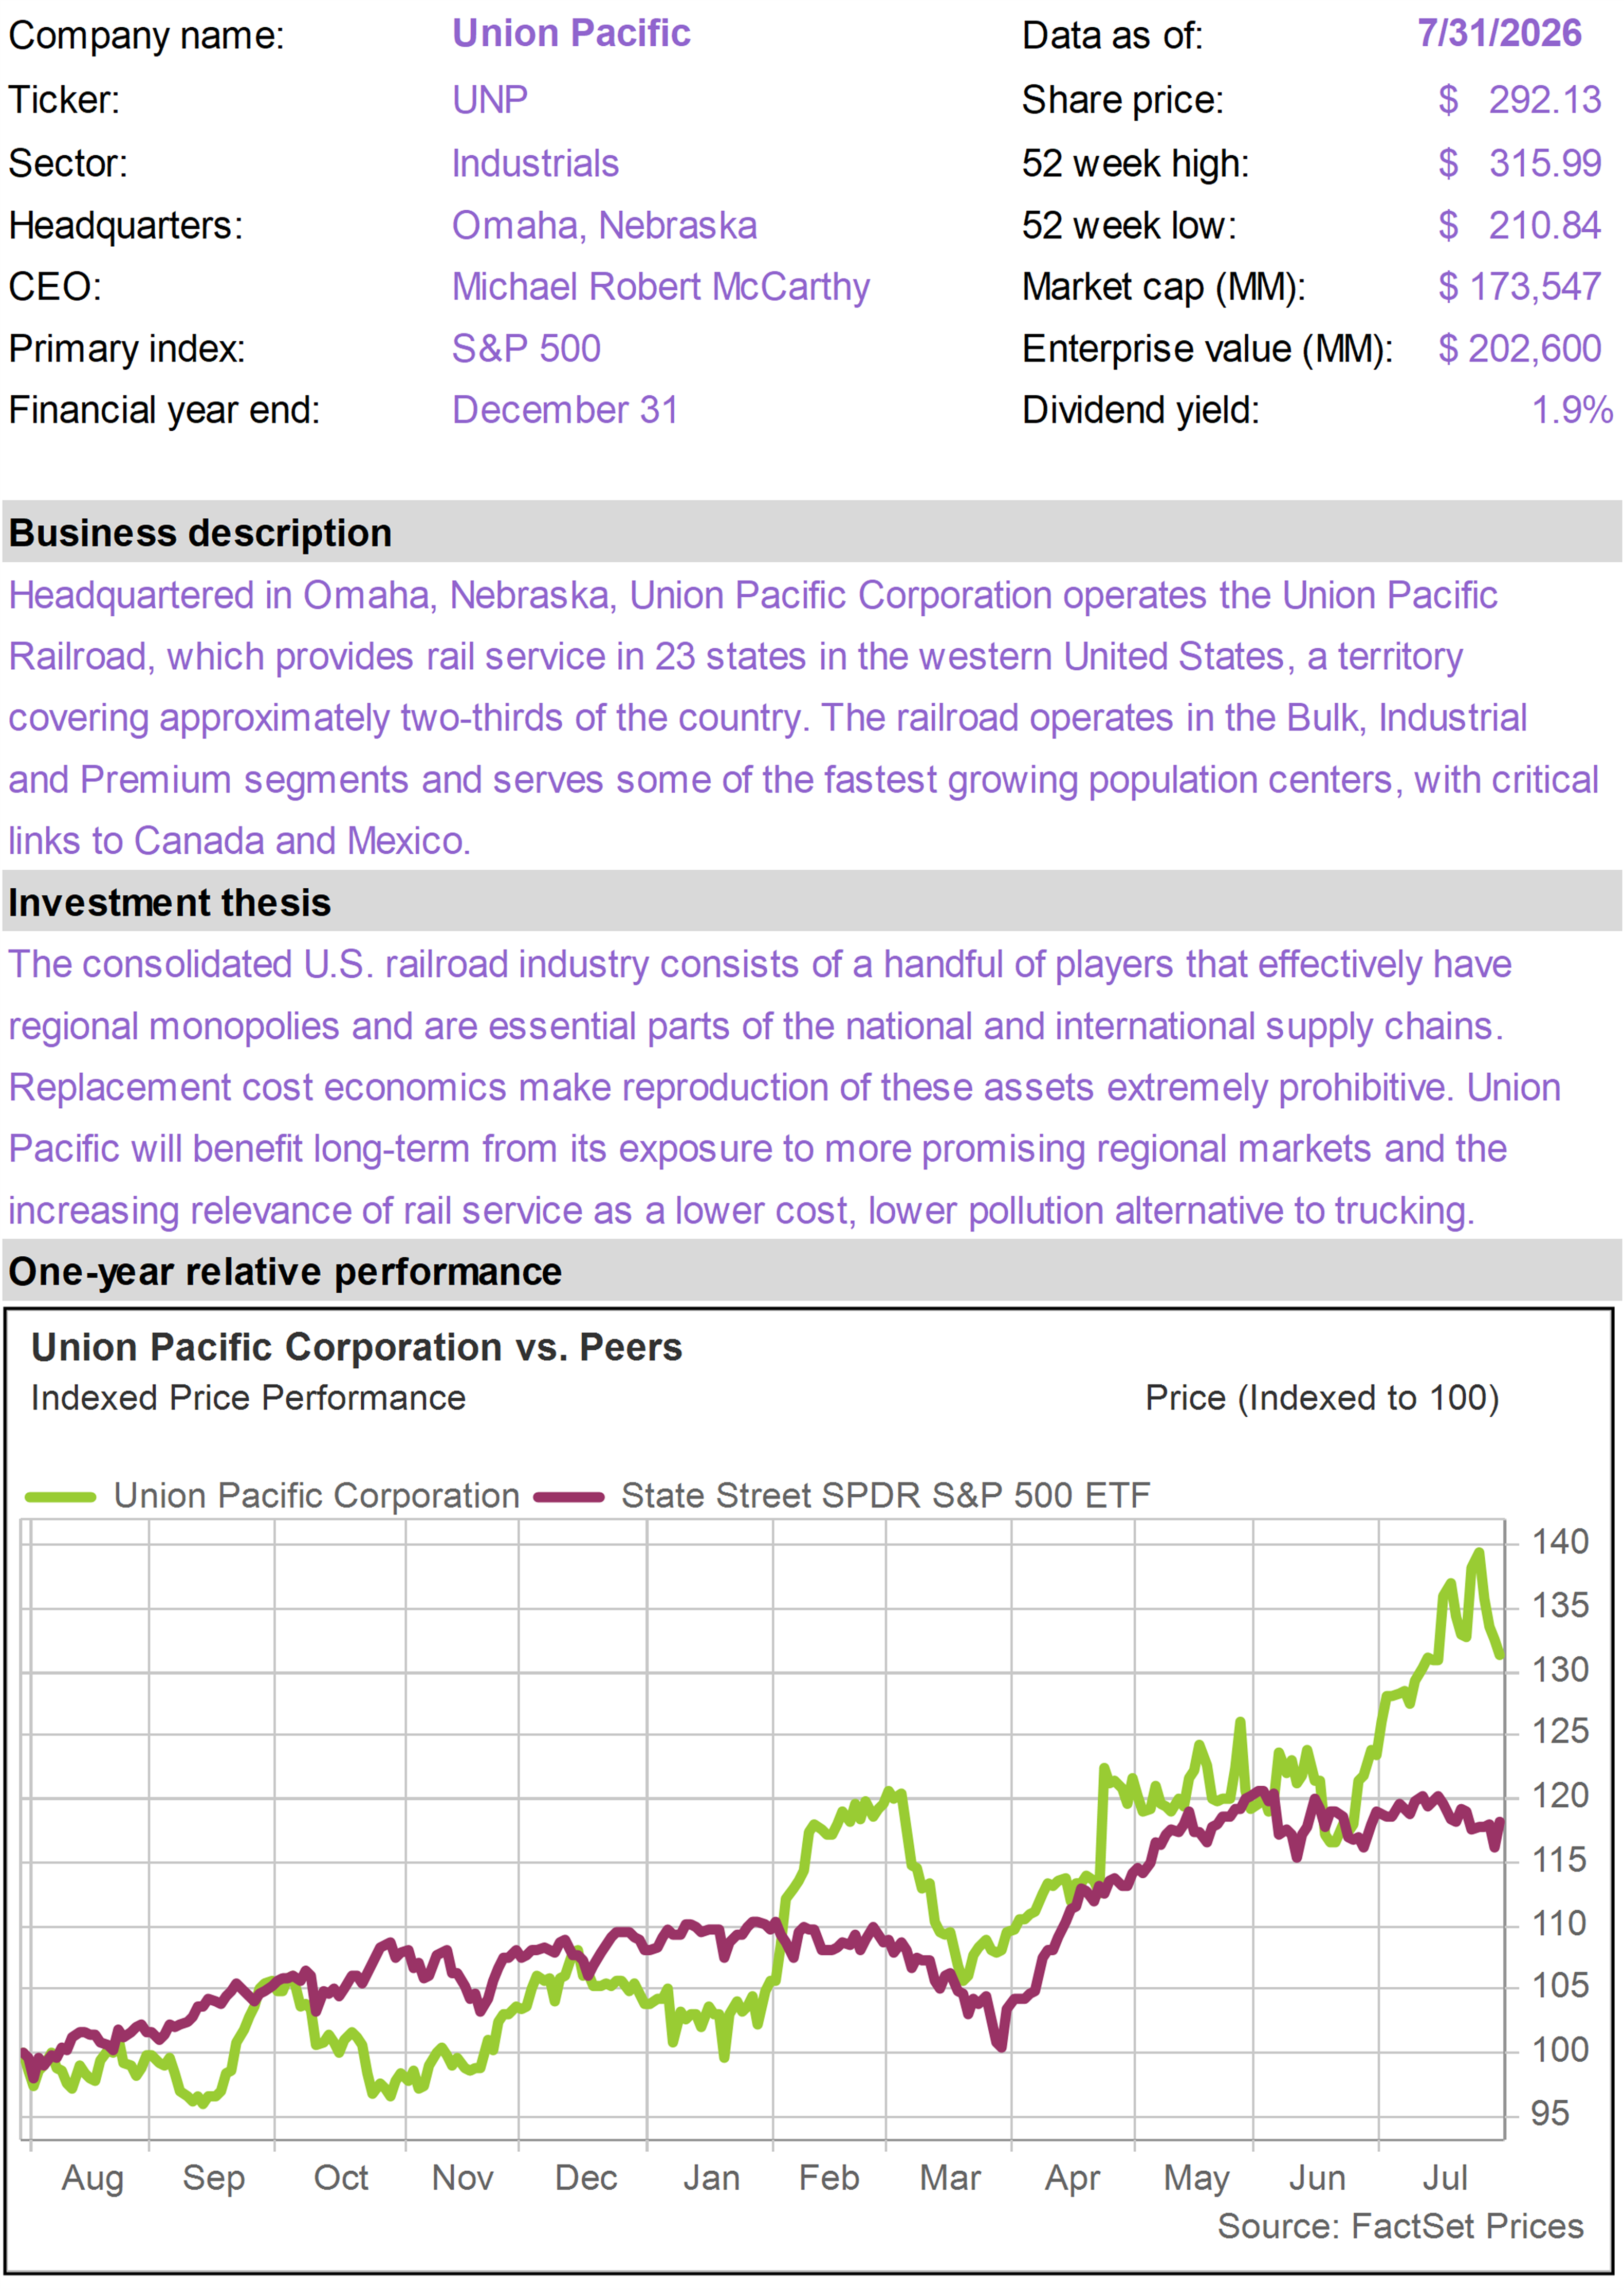
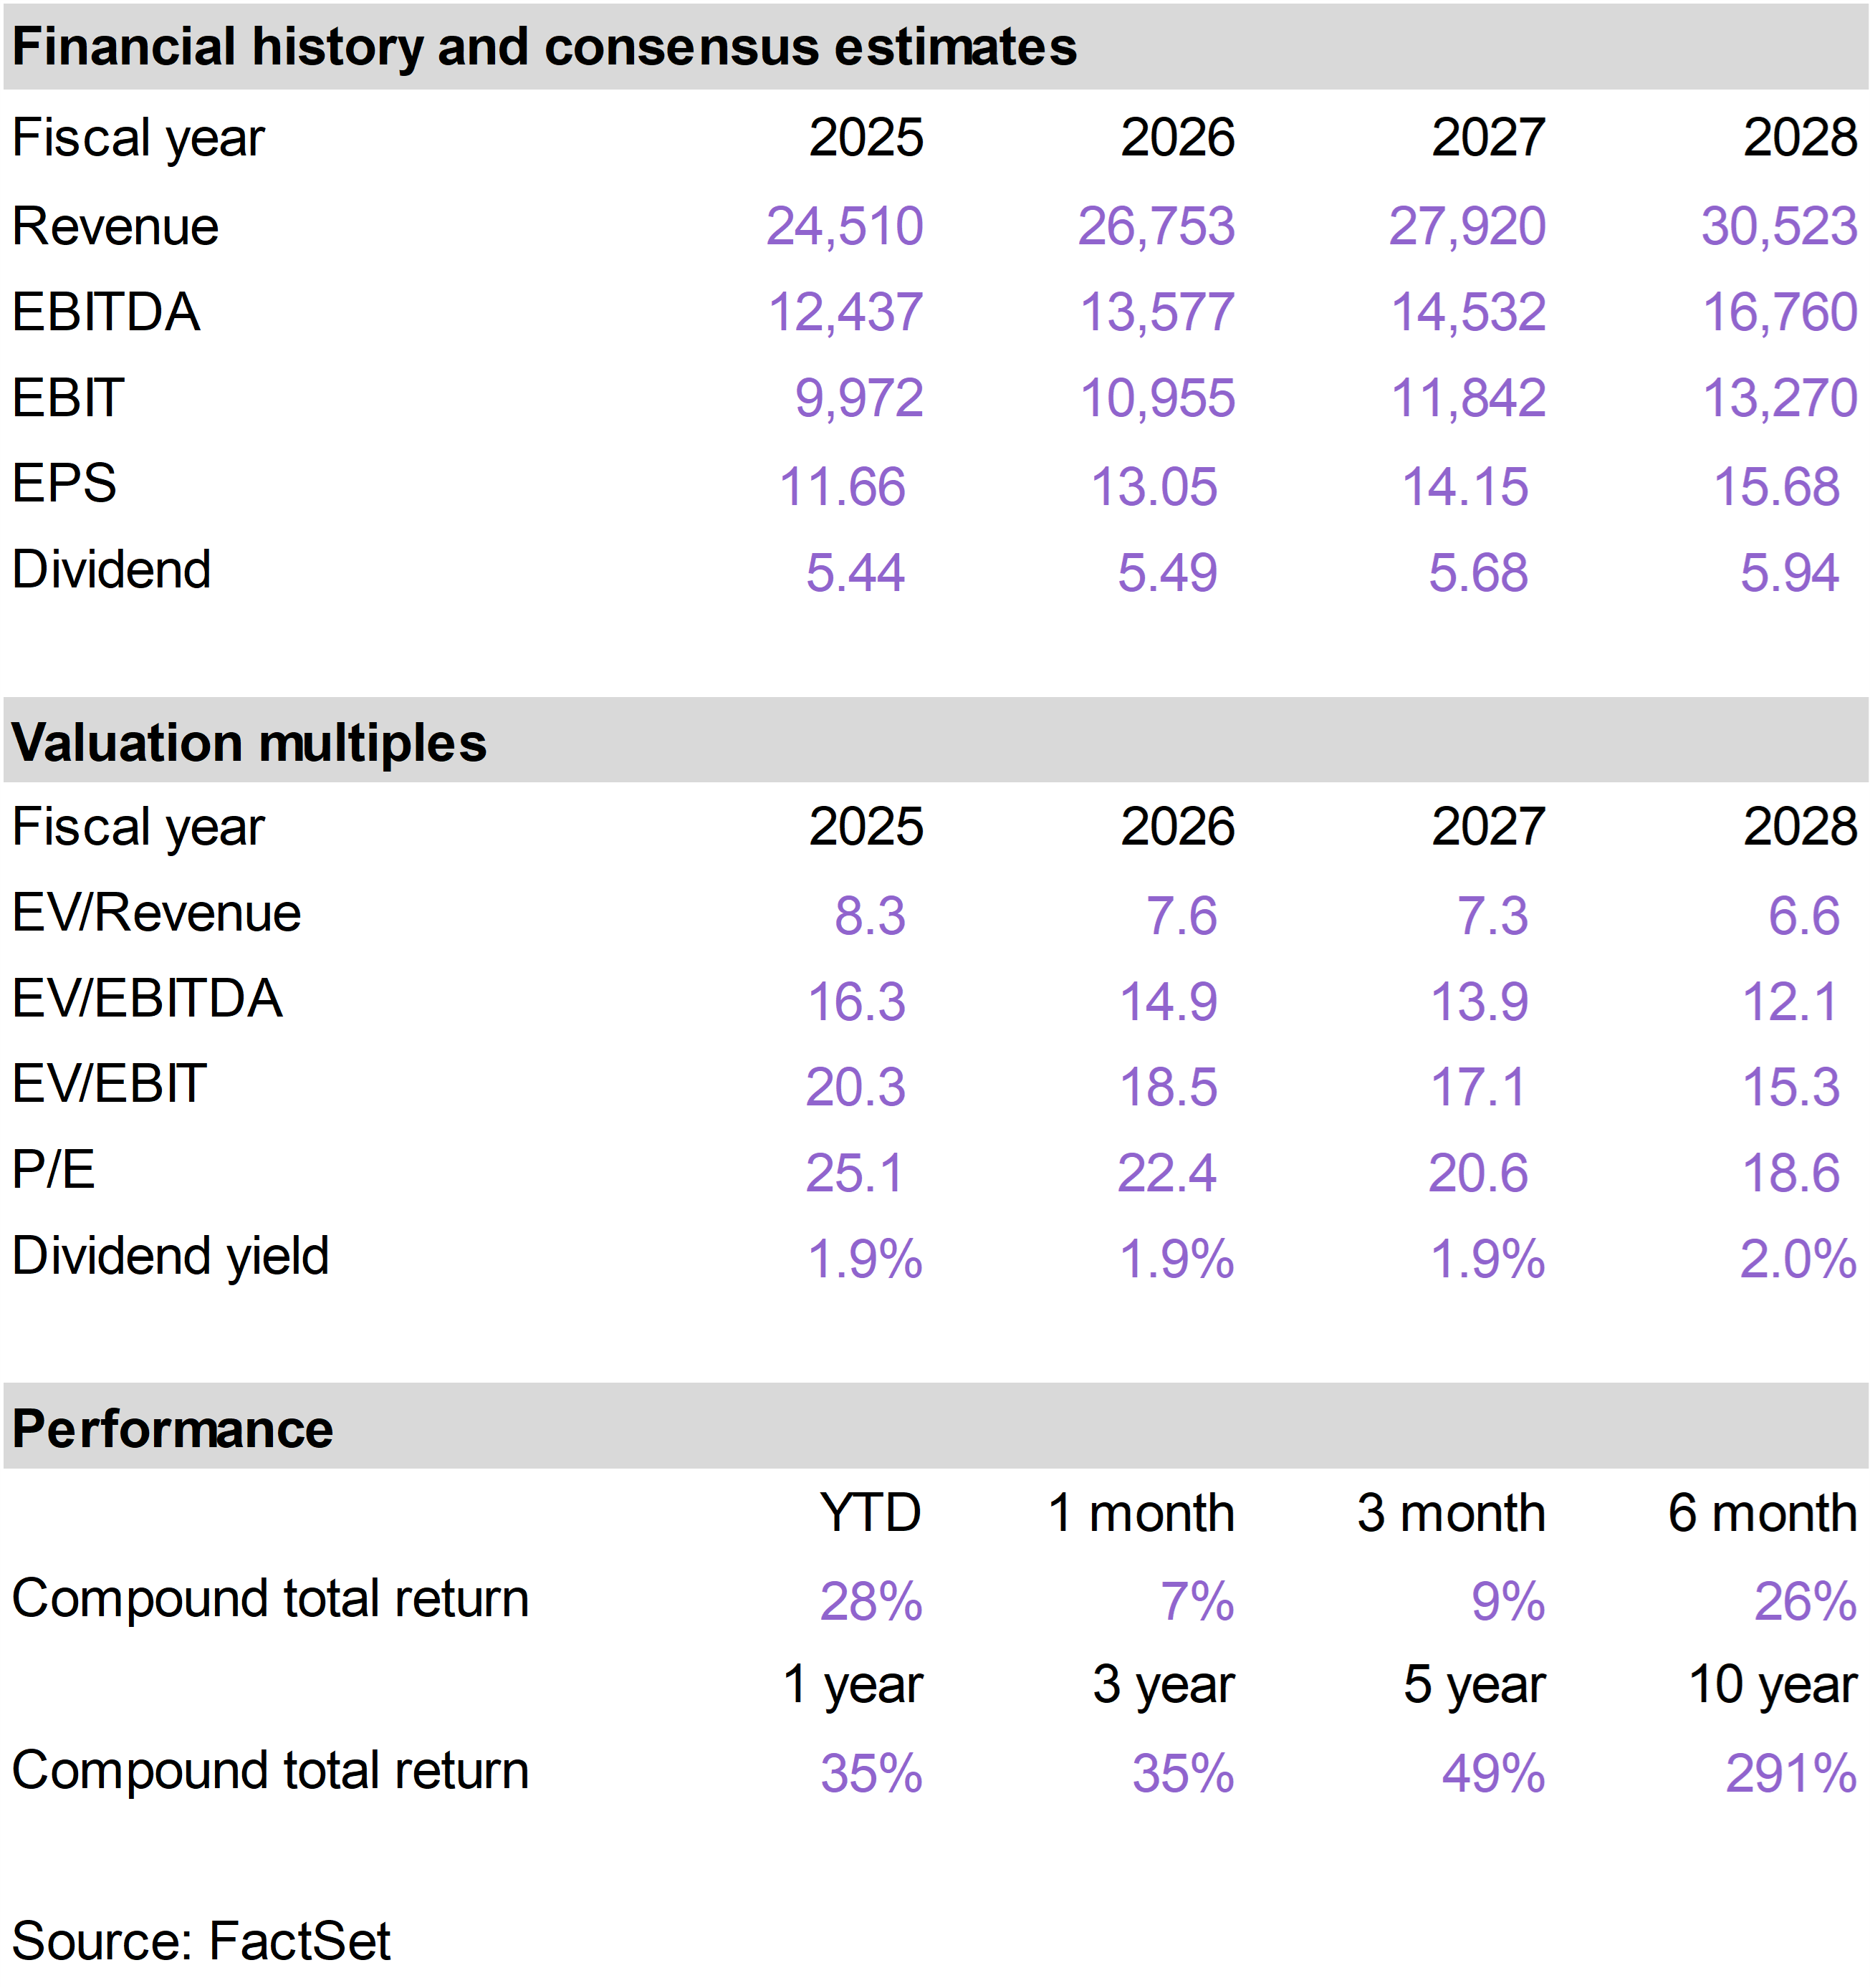
The top performing stocks in the portfolio in July were Thermo Fisher Scientific (TMO), which returned 15%; S&P Global (SPGI), which returned 7%; and Visa (V), which returned 7%.
The worst performing positions this month were Oracle (ORCL), which returned -11%; Vulcan Materials (VMC), which returned -9%; and Texas Instruments (TXN), which returned -7%. |
|
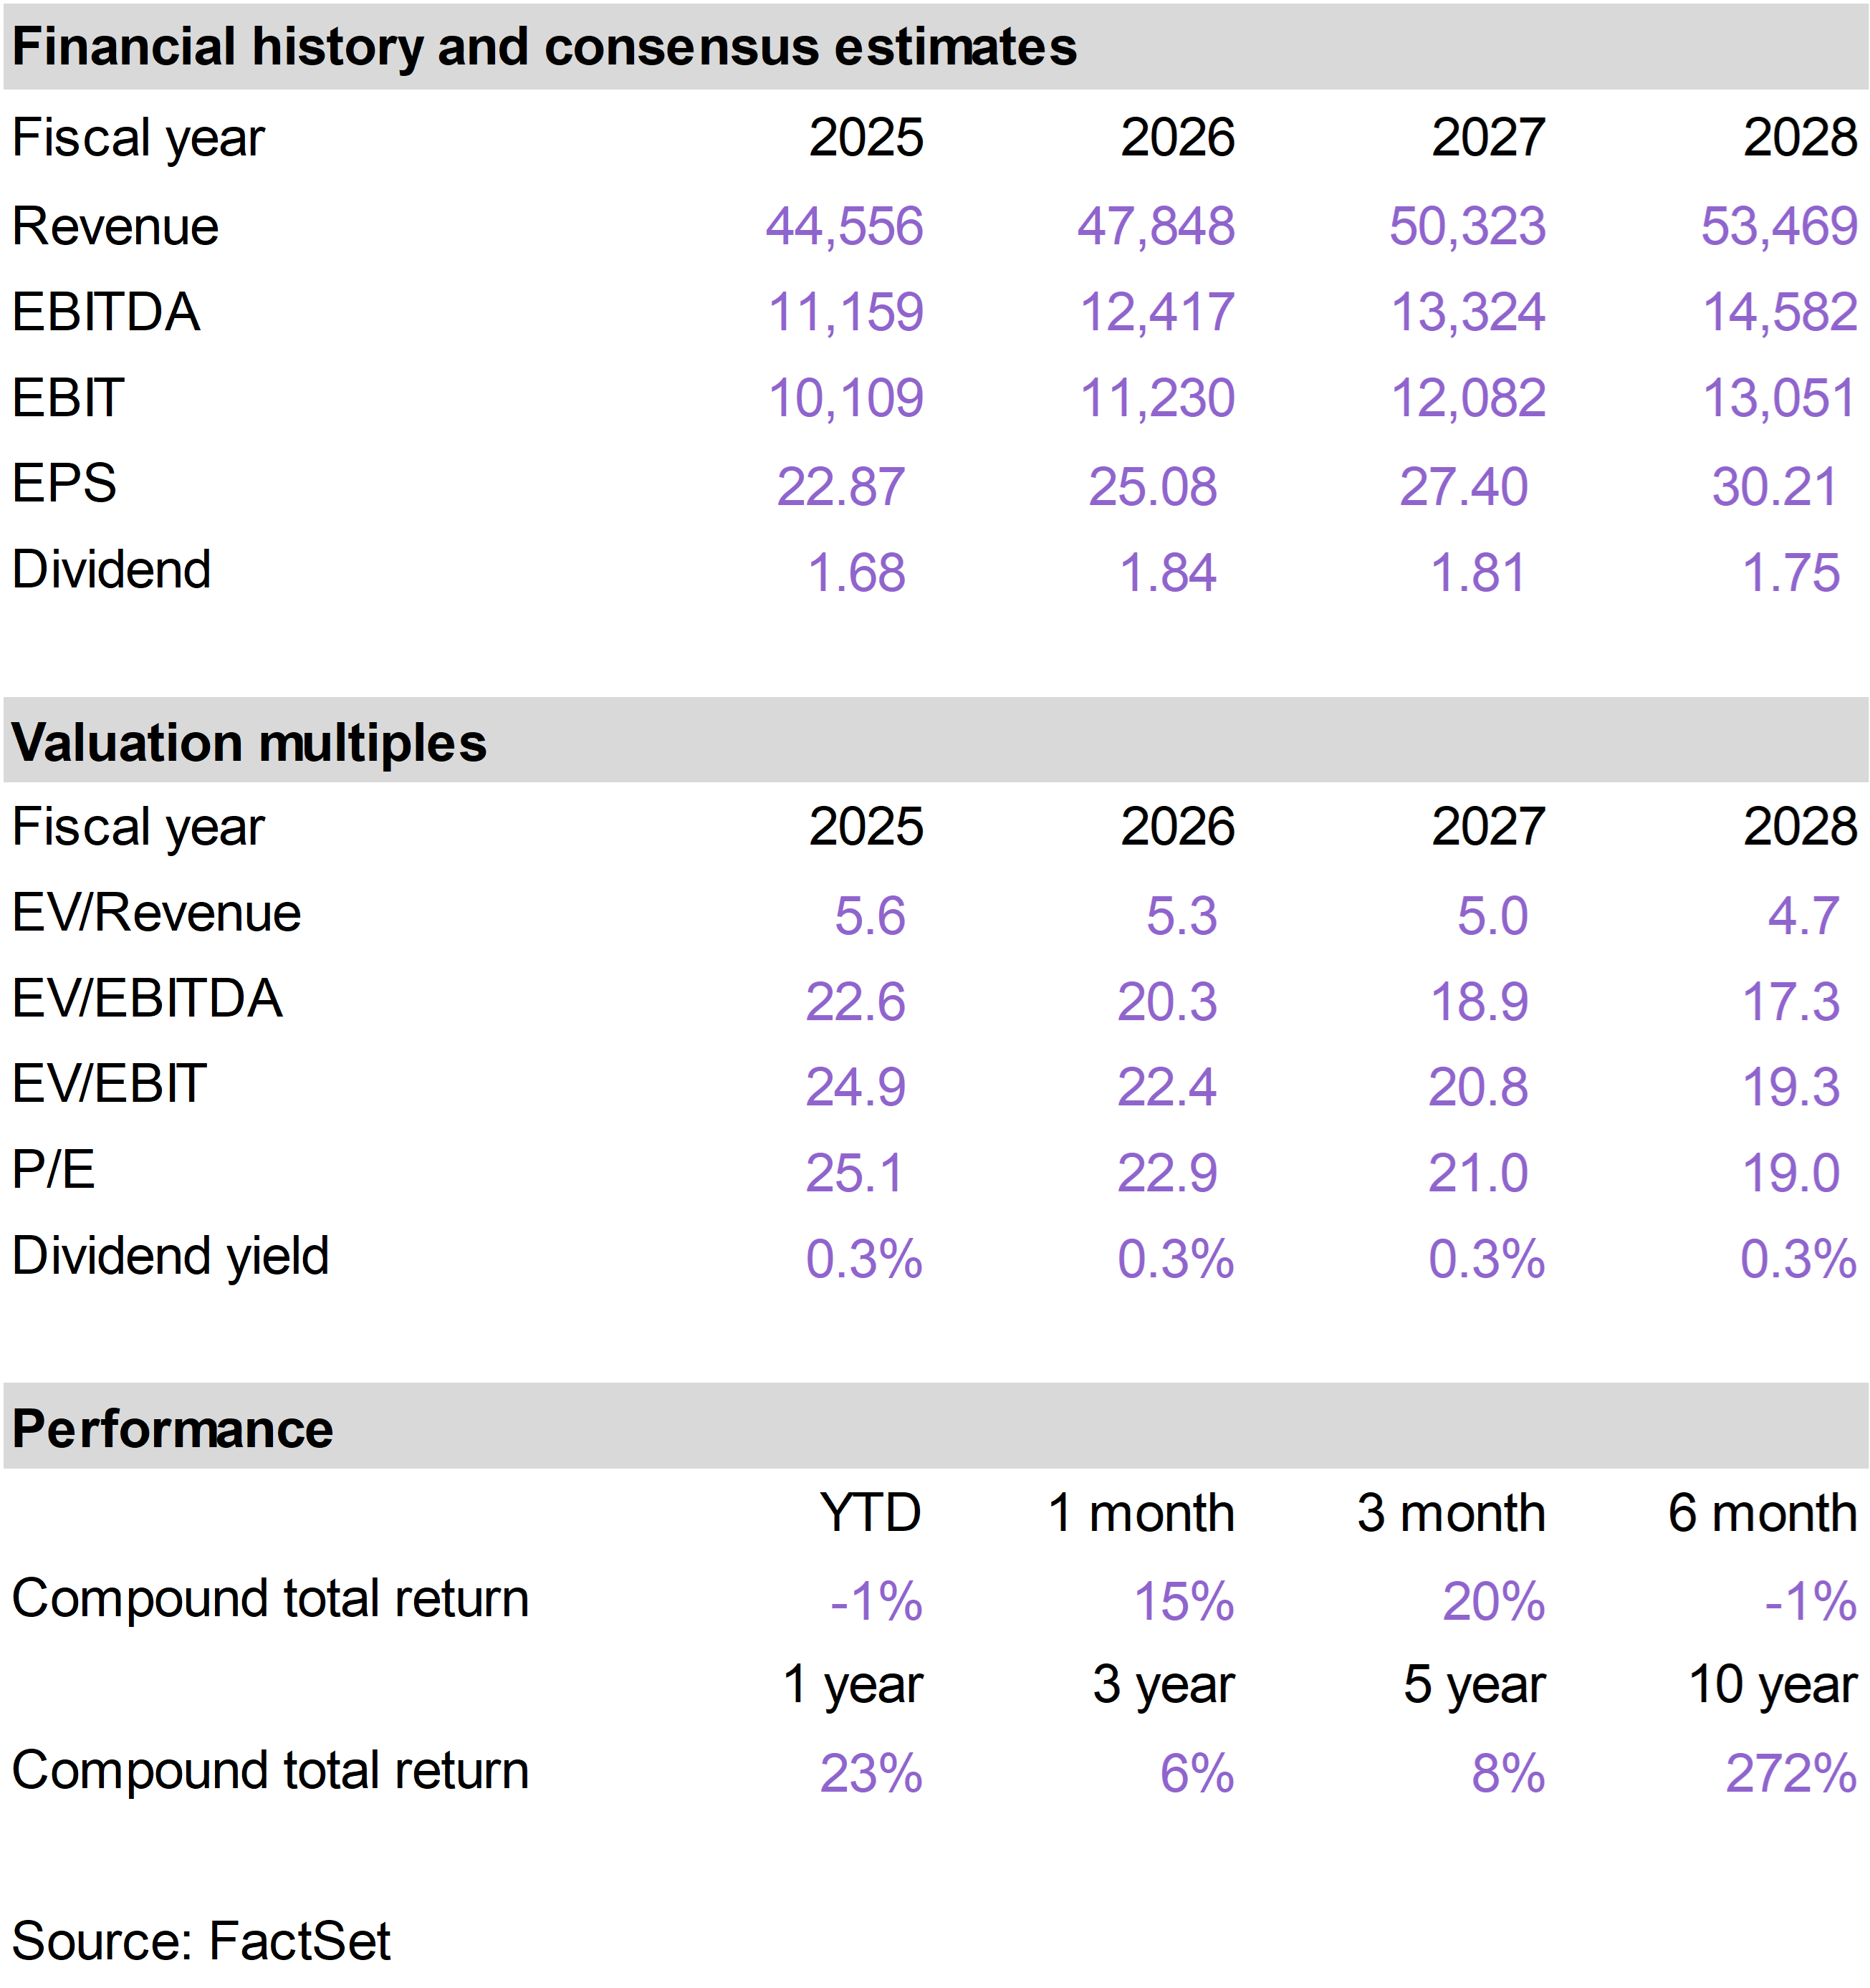
| | TMO performed well in July after reporting results that provided some of the clearest evidence yet that the life sciences tools market is beginning to recover.
Second quarter organic revenue increased 5%, substantially exceeding expectations and accelerating from 1% growth in the first quarter. This was the company’s strongest underlying growth rate in more than three years, excluding COVID-related revenue.
The breadth of the improvement was especially encouraging. All four of TMO’s major end markets generated positive organic growth for the first time since late 2024.
Analytical Instruments was the strongest segment, with organic revenue increasing 7%. Demand was particularly healthy for electron microscopes used by semiconductor customers, while chromatography and mass-spectrometry sales benefited from improving research activity.
Strong execution magnified the benefit of the revenue improvement. Adjusted operating margins expanded approximately 90 basis points from the prior year and came in comfortably ahead of expectations.
Higher revenue and better margins helped adjusted earnings per share exceed estimates by approximately 5%.
Management responded by raising its 2026 outlook. TMO now expects organic growth near the upper end of its previous 3% to 4% range and increased the midpoint of its earnings guidance. This represented the company’s first meaningful increase to its full-year organic growth expectations in roughly four years.
The company also used the earlier weakness in its share price to execute an additional $1 billion share repurchase, demonstrating confidence in the business and providing another source of earnings-per-share growth.
The July results strengthened the case that TMO is moving beyond a temporary post-pandemic adjustment and entering a more durable recovery. After several years of uneven end-market conditions, investors received evidence in July that demand is improving across several parts of the business at the same time.
The combination of accelerating organic growth, expanding margins, higher guidance and strong capital deployment reinforced our confidence in the long-term investment thesis. |
|
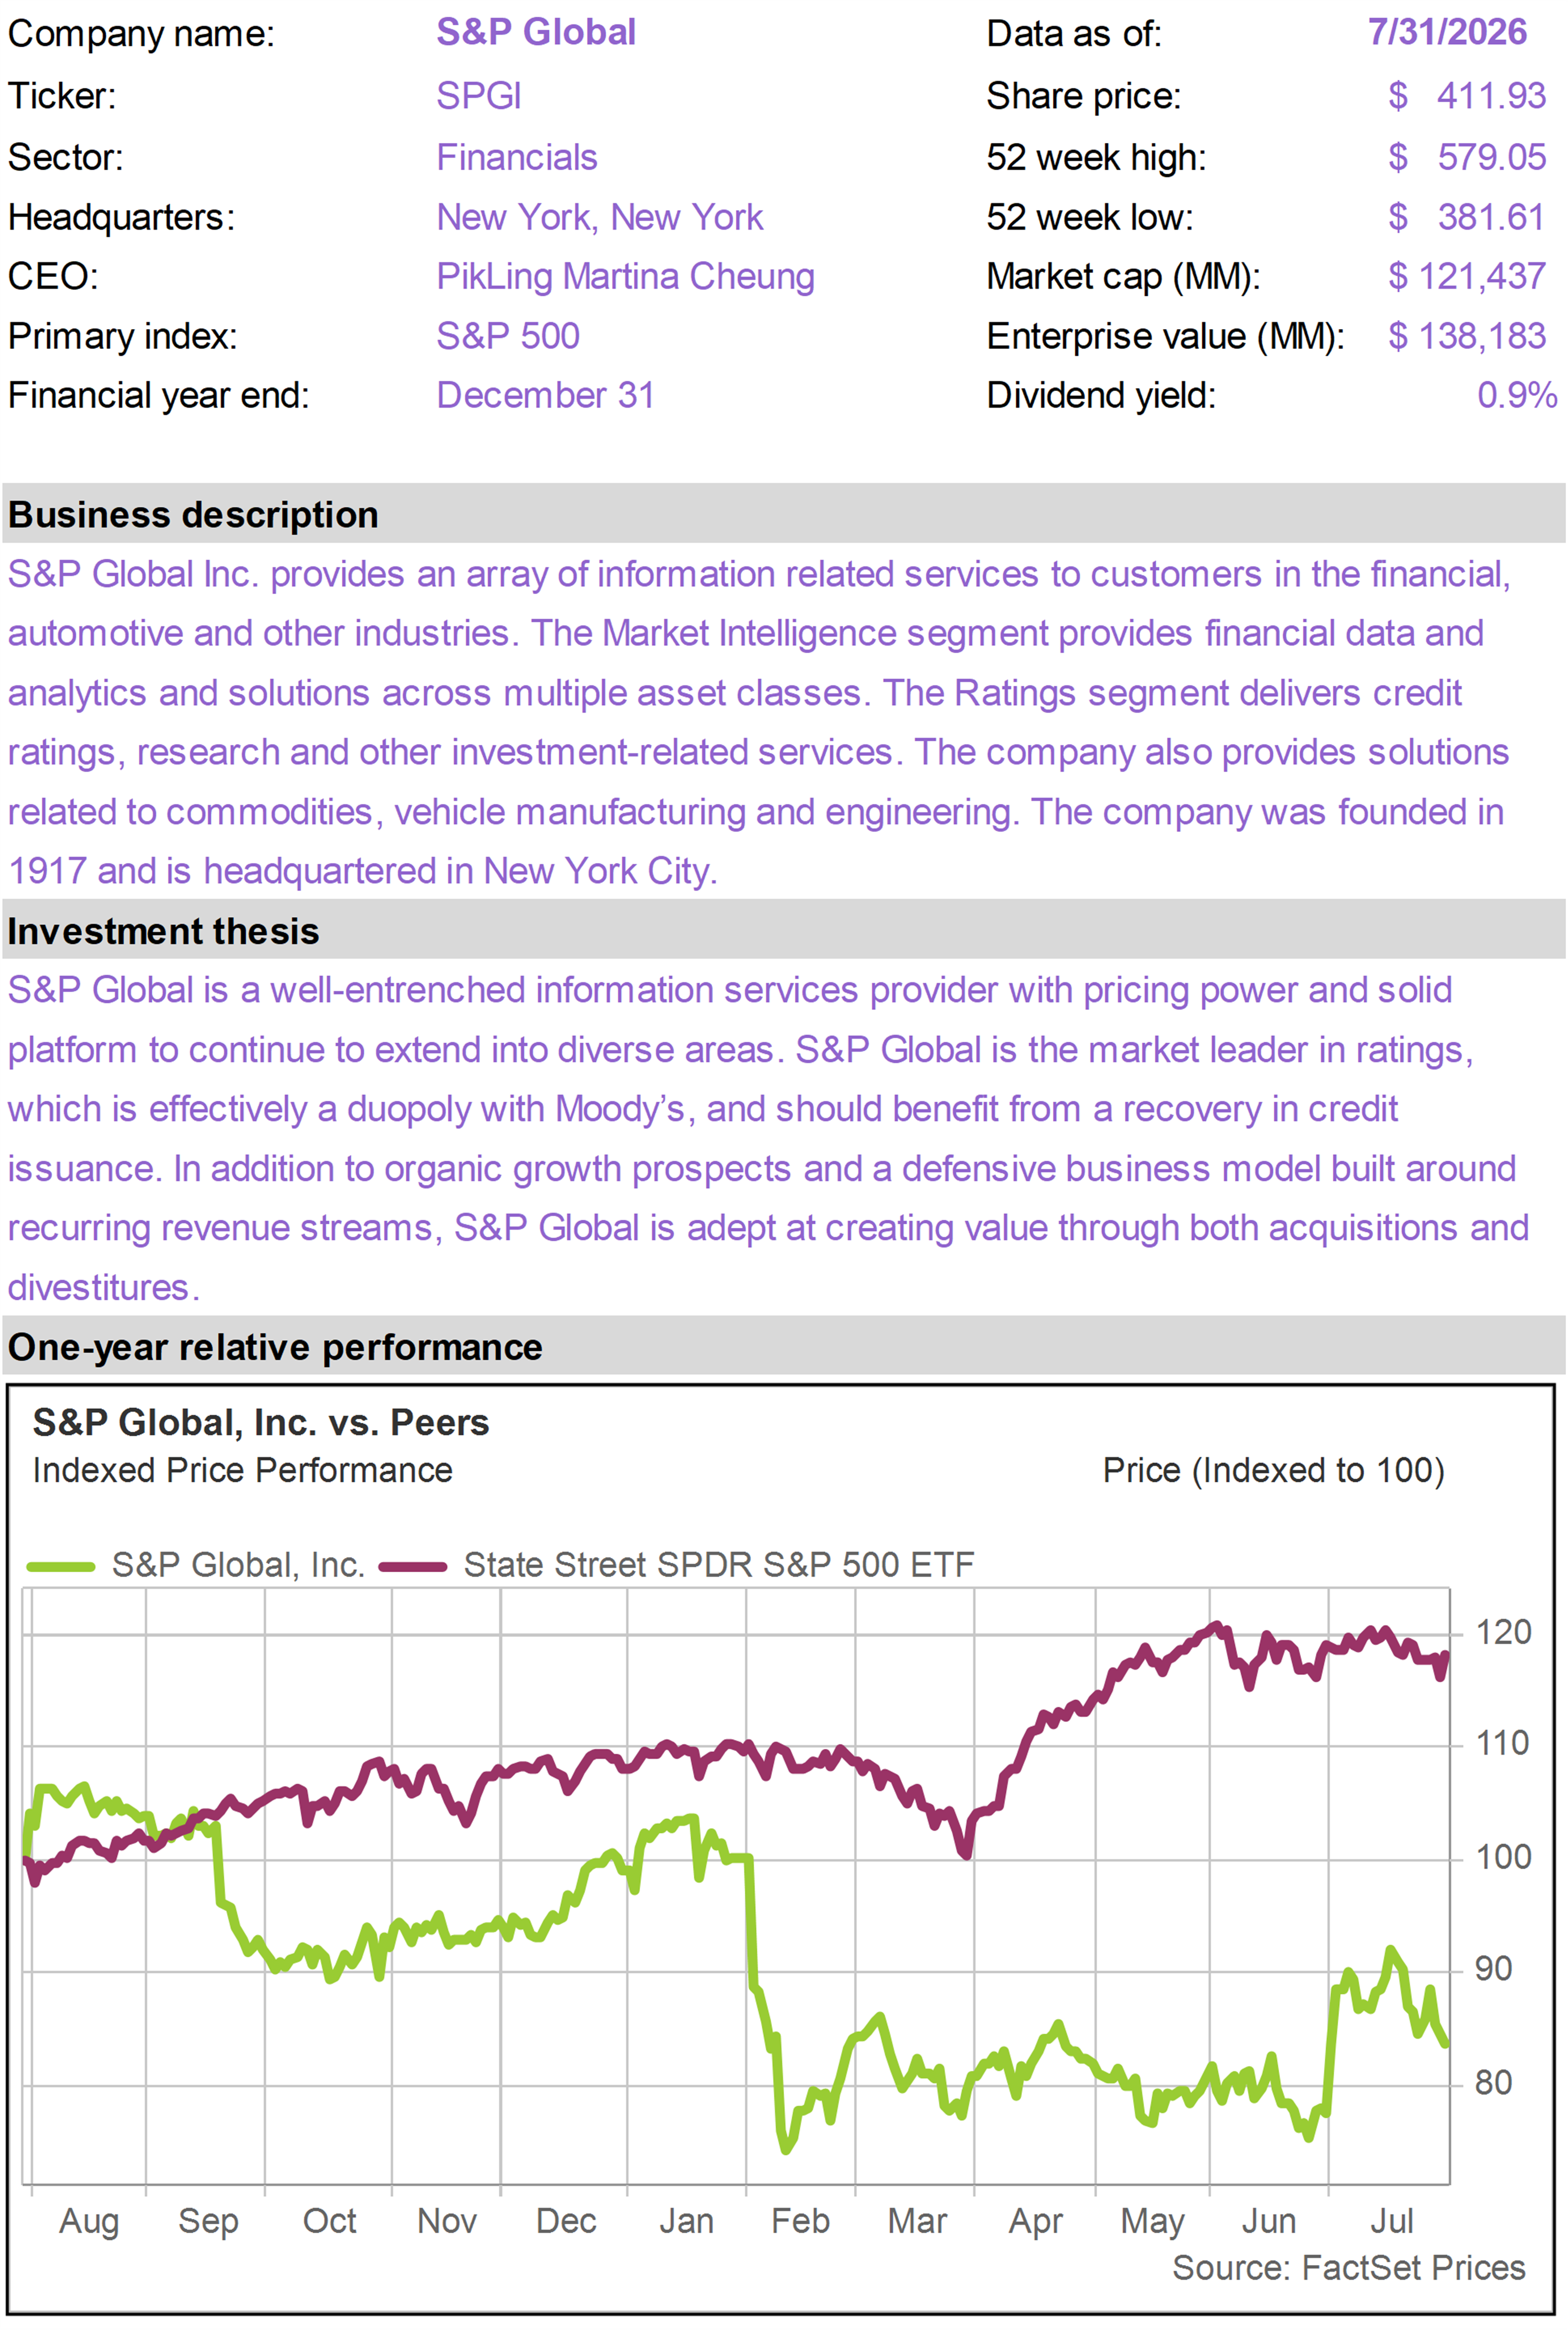
| | SPGI benefited this month as strong credit-rating activity, expanding margins and increased capital returns reinforced the company’s earnings outlook.
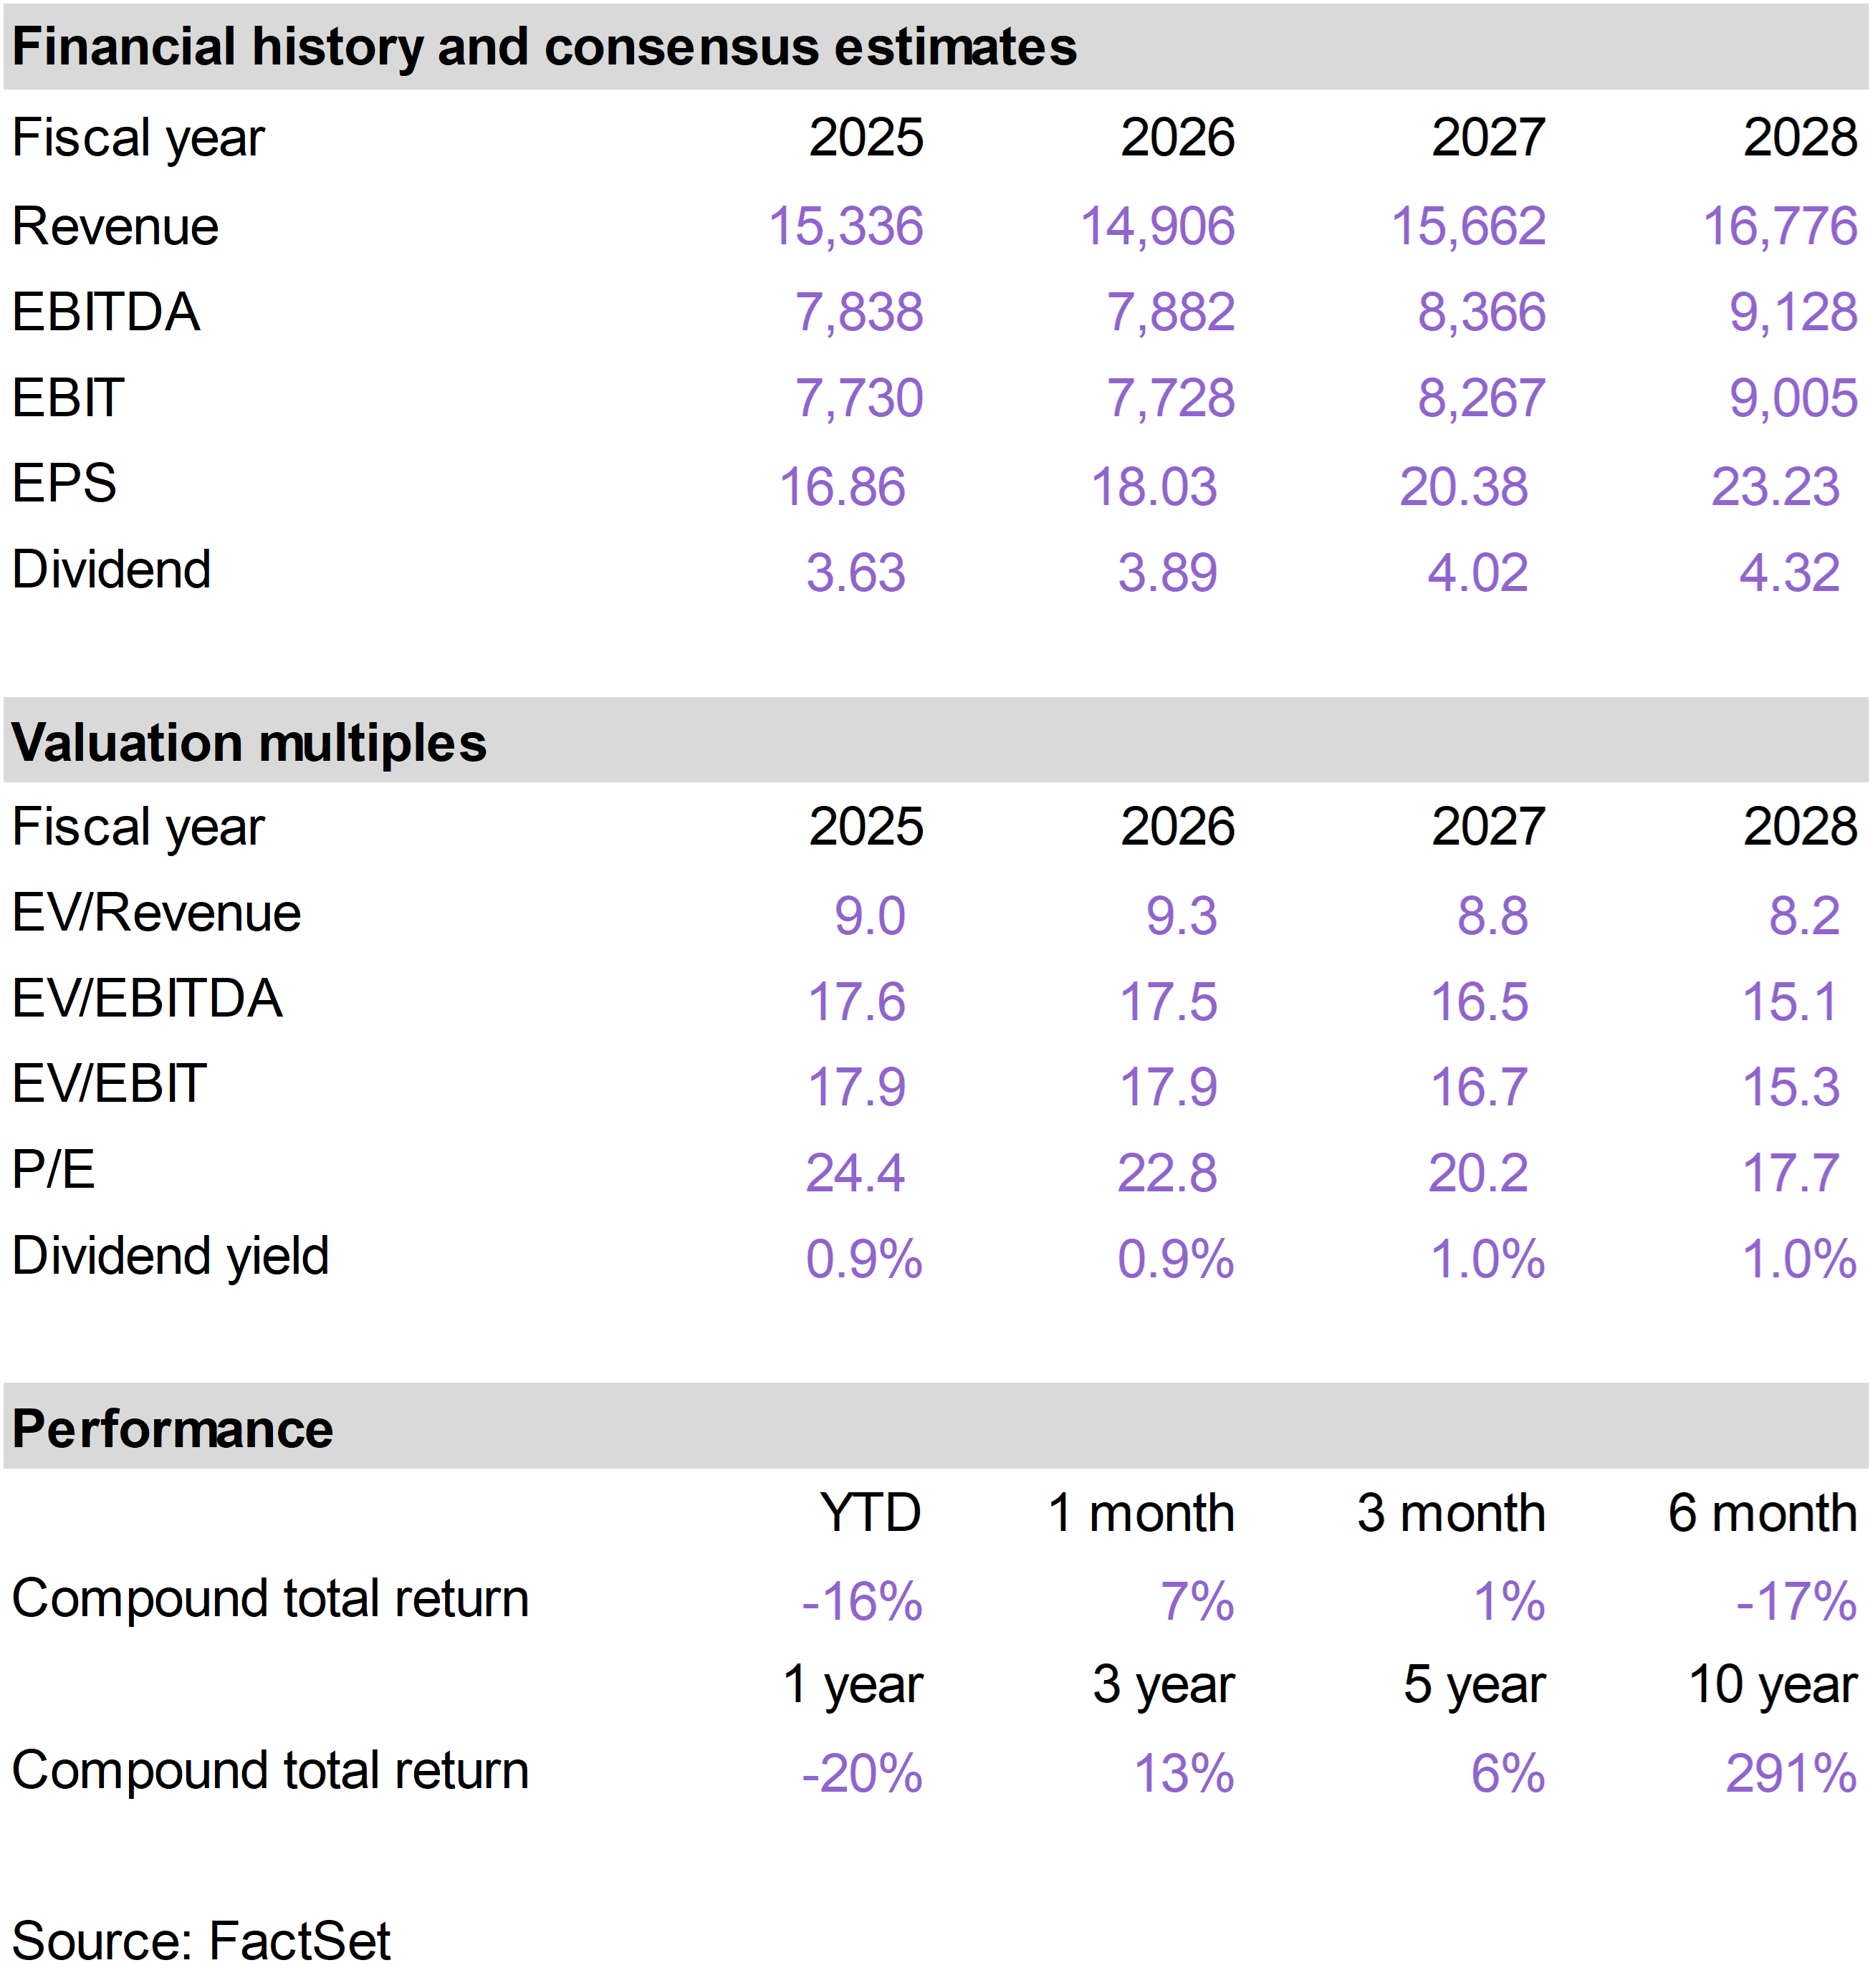
Second quarter revenue increased 11% on an organic, constant-currency basis. Adjusted earnings per share rose 23% to $4.83, while the adjusted operating margin reached 54.3%, approximately two percentage points above the prior year.
The Ratings business was the main source of upside. Ratings revenue increased 17%, while transaction revenue and billed debt issuance both grew 25%.
Investment-grade issuance was especially strong, supported by merger and acquisition activity and financing for AI infrastructure. Large technology companies issued approximately $169 billion of debt during the first half, already approaching SPGI’s original full-year expectation.
Private markets revenue also increased 60%, showing progress beyond the traditional public debt-rating franchise.
The medium-term outlook remains favorable even if issuance growth slows. Approximately $11 trillion of debt is expected to require refinancing over the next four and a half years, creating a substantial base of recurring demand.
SPGI also benefits from the AI investment cycle without directly assuming the associated capital intensity. As large companies borrow to finance data centers and related infrastructure, SPGI collects fees through its Ratings business.
The Index business also performed well, with revenue increasing approximately 20%. Ratings and Indices are SPGI’s highest-margin businesses, and their strength helped offset softer results in Market Intelligence and Energy.
There was also encouraging evidence of AI monetization. More than 500 clients are now using SPGI’s large language model programming interfaces and related products. Usage increased more than fivefold from the previous quarter, while AI-enabled customers increased their spending substantially faster than other clients.
Capital allocation provided another source of support. Management increased planned 2026 share repurchases to more than $7 billion, representing over 5% of the company’s market capitalization.
On July 1, shareholders of SPGI (as of June 15, 2026) received one share of Mobility Global (MBGL) for each share of SPGI they owned. We covered the MBGL spin-off (Taking Advantage of One of Wall Street’s Oldest Secrets) earlier in the month.
We continue to view the spun-off business as an attractive long-term hold.
The transaction also leaves SPGI with a cleaner and more profitable collection of businesses. Management maintained its growth expectations following the separation while raising its margin outlook.
SPGI owns difficult-to-replicate benchmarks, ratings franchises and proprietary datasets that are deeply embedded in global financial markets.
Strong Ratings activity, expanding margins, early AI monetization and a larger repurchase program all strengthened the company’s long-term outlook this month. |
|
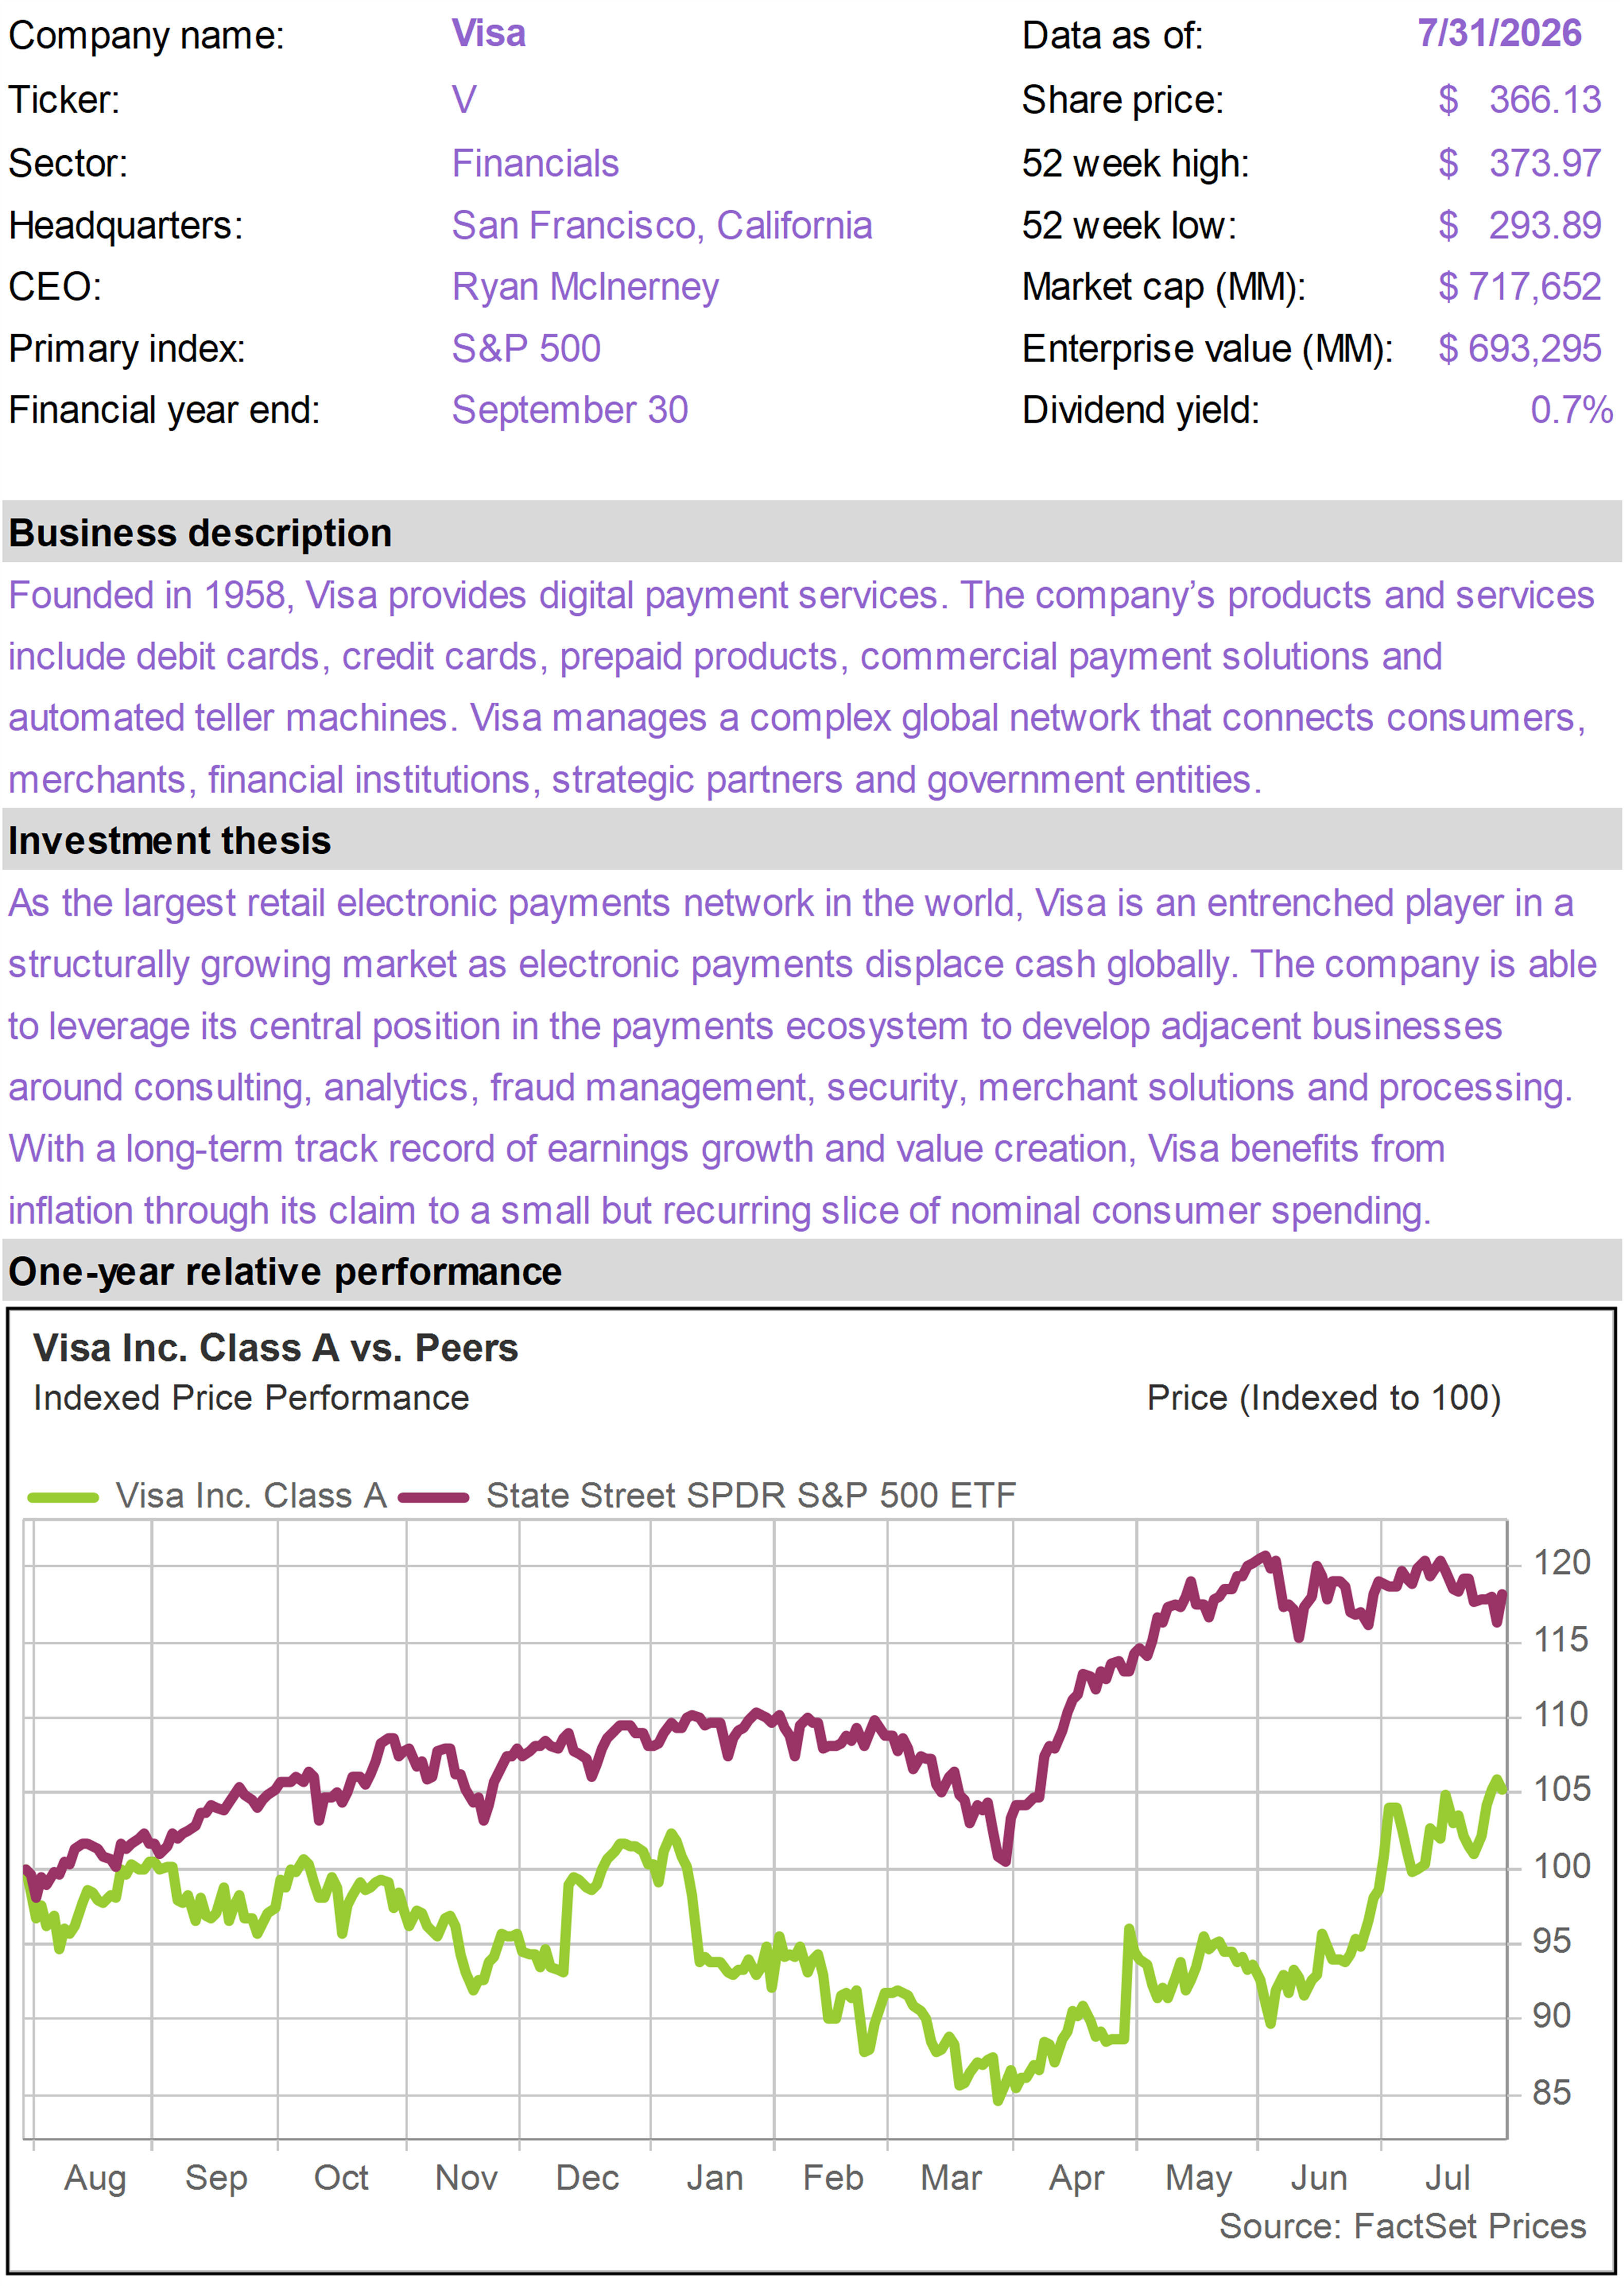
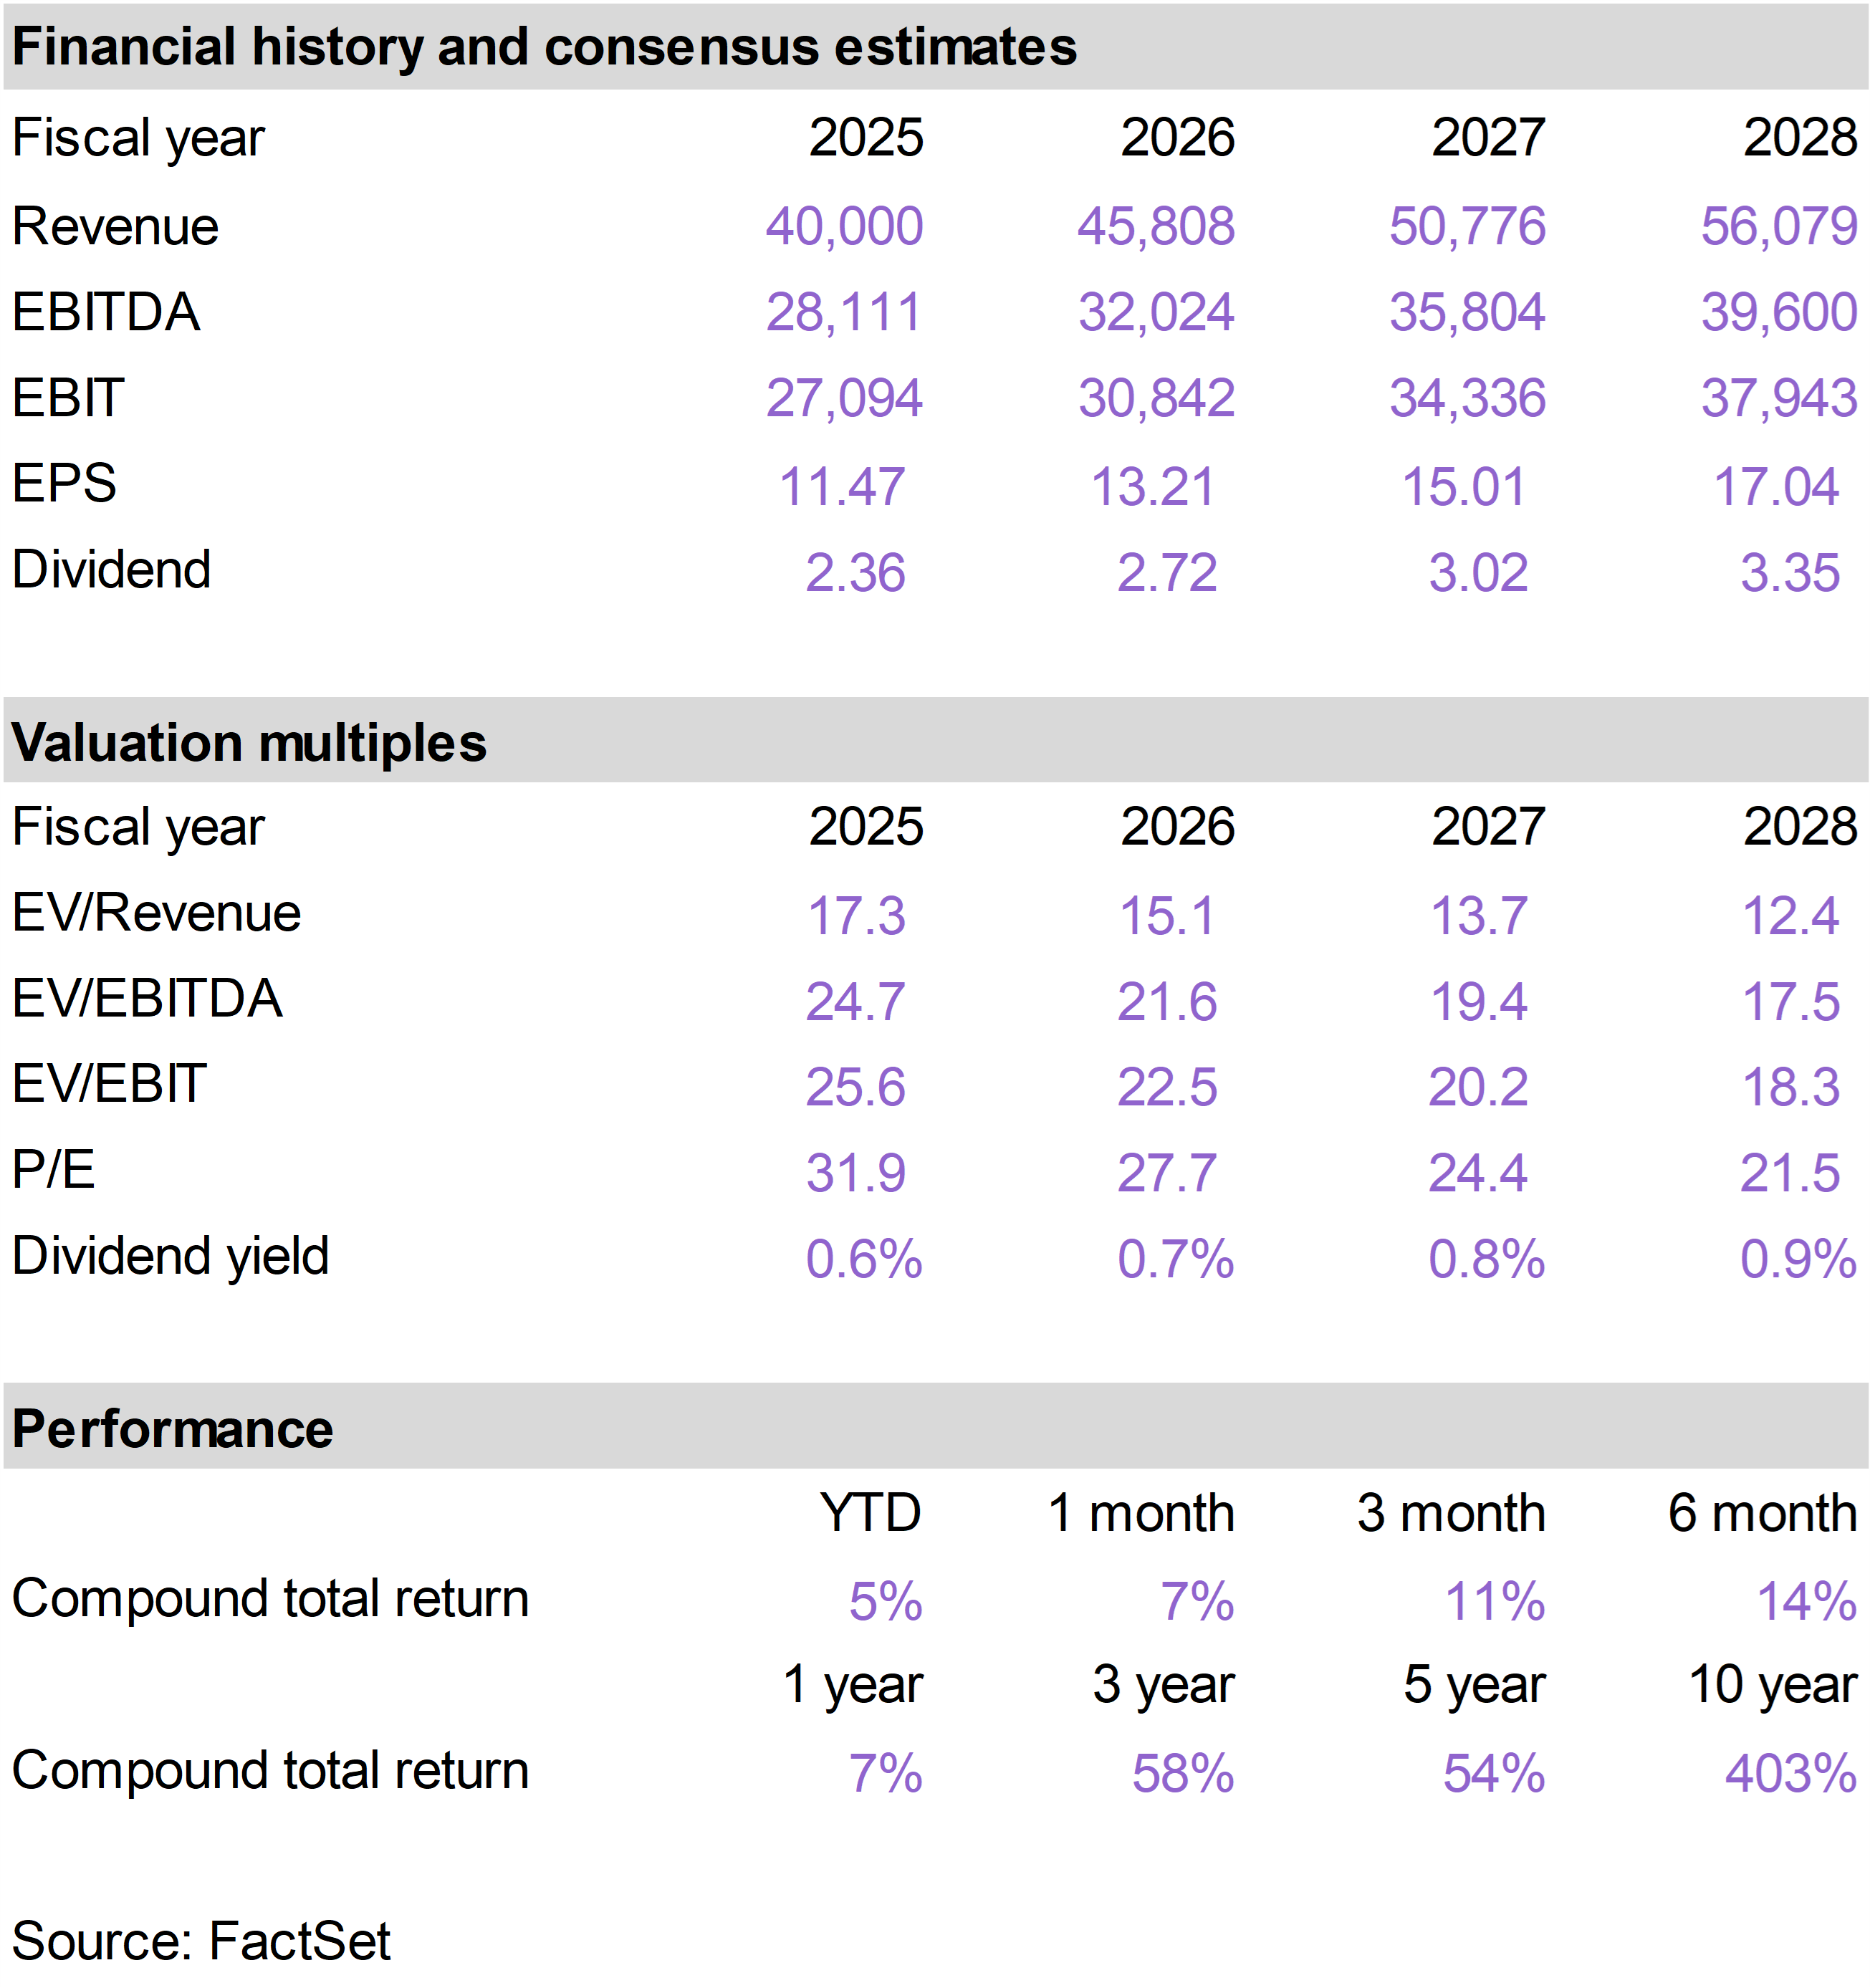
| | Shares of V performed well in July after the company reported strong fiscal third-quarter results that reinforced the durability of consumer spending and the long-term growth outlook.
Revenue increased approximately 13% on a constant-currency basis, while adjusted earnings per share rose 11% to $3.32 and exceeded expectations. The company also raised its full-year revenue outlook and slightly increased its expectation for organic, constant-currency earnings growth.
Consumer activity remained healthy despite elevated interest rates and geopolitical uncertainty.
U.S. payment volume increased approximately 10%, while cross-border volume excluding transactions within Europe rose roughly 12%. Notably, management reported no meaningful deterioration among lower-income consumers.
The Value-Added Services business was the quarter’s standout with revenue growth of 34%. Issuing, acceptance, and risk and security products have each generated growth above 20% for four consecutive quarters.
The results were especially encouraging given investor concerns about stablecoins, account-to-account payment systems and AI-enabled commerce.
We continue to believe these developments are more likely to expand V’s opportunity than undermine it. Most consumer transactions initiated by AI agents will still require secure payment credentials, fraud protection and global acceptance. V is also building infrastructure to participate in stablecoin settlement and cross-border business payments.
Alternative payment networks may gain share in certain markets, but they generally lack V’s global reach, transaction data and sophisticated risk-management capabilities. These advantages become more valuable—not less—as payments become increasingly automated.
V also announced a workforce reduction concentrated largely in technology and product roles. While the decision produced a sizable severance charge, it reflects an effort to improve efficiency and redirect investment toward the company’s highest-growth opportunities.
V continues to benefit from the global migration from cash to electronic payments, resilient consumer spending, cross-border travel and rapid growth in value-added services.
Strong payment volumes, accelerating service revenue and higher guidance demonstrated that the company remains capable of generating double-digit revenue growth and mid-teens earnings growth despite an uncertain macroeconomic environment. |
|
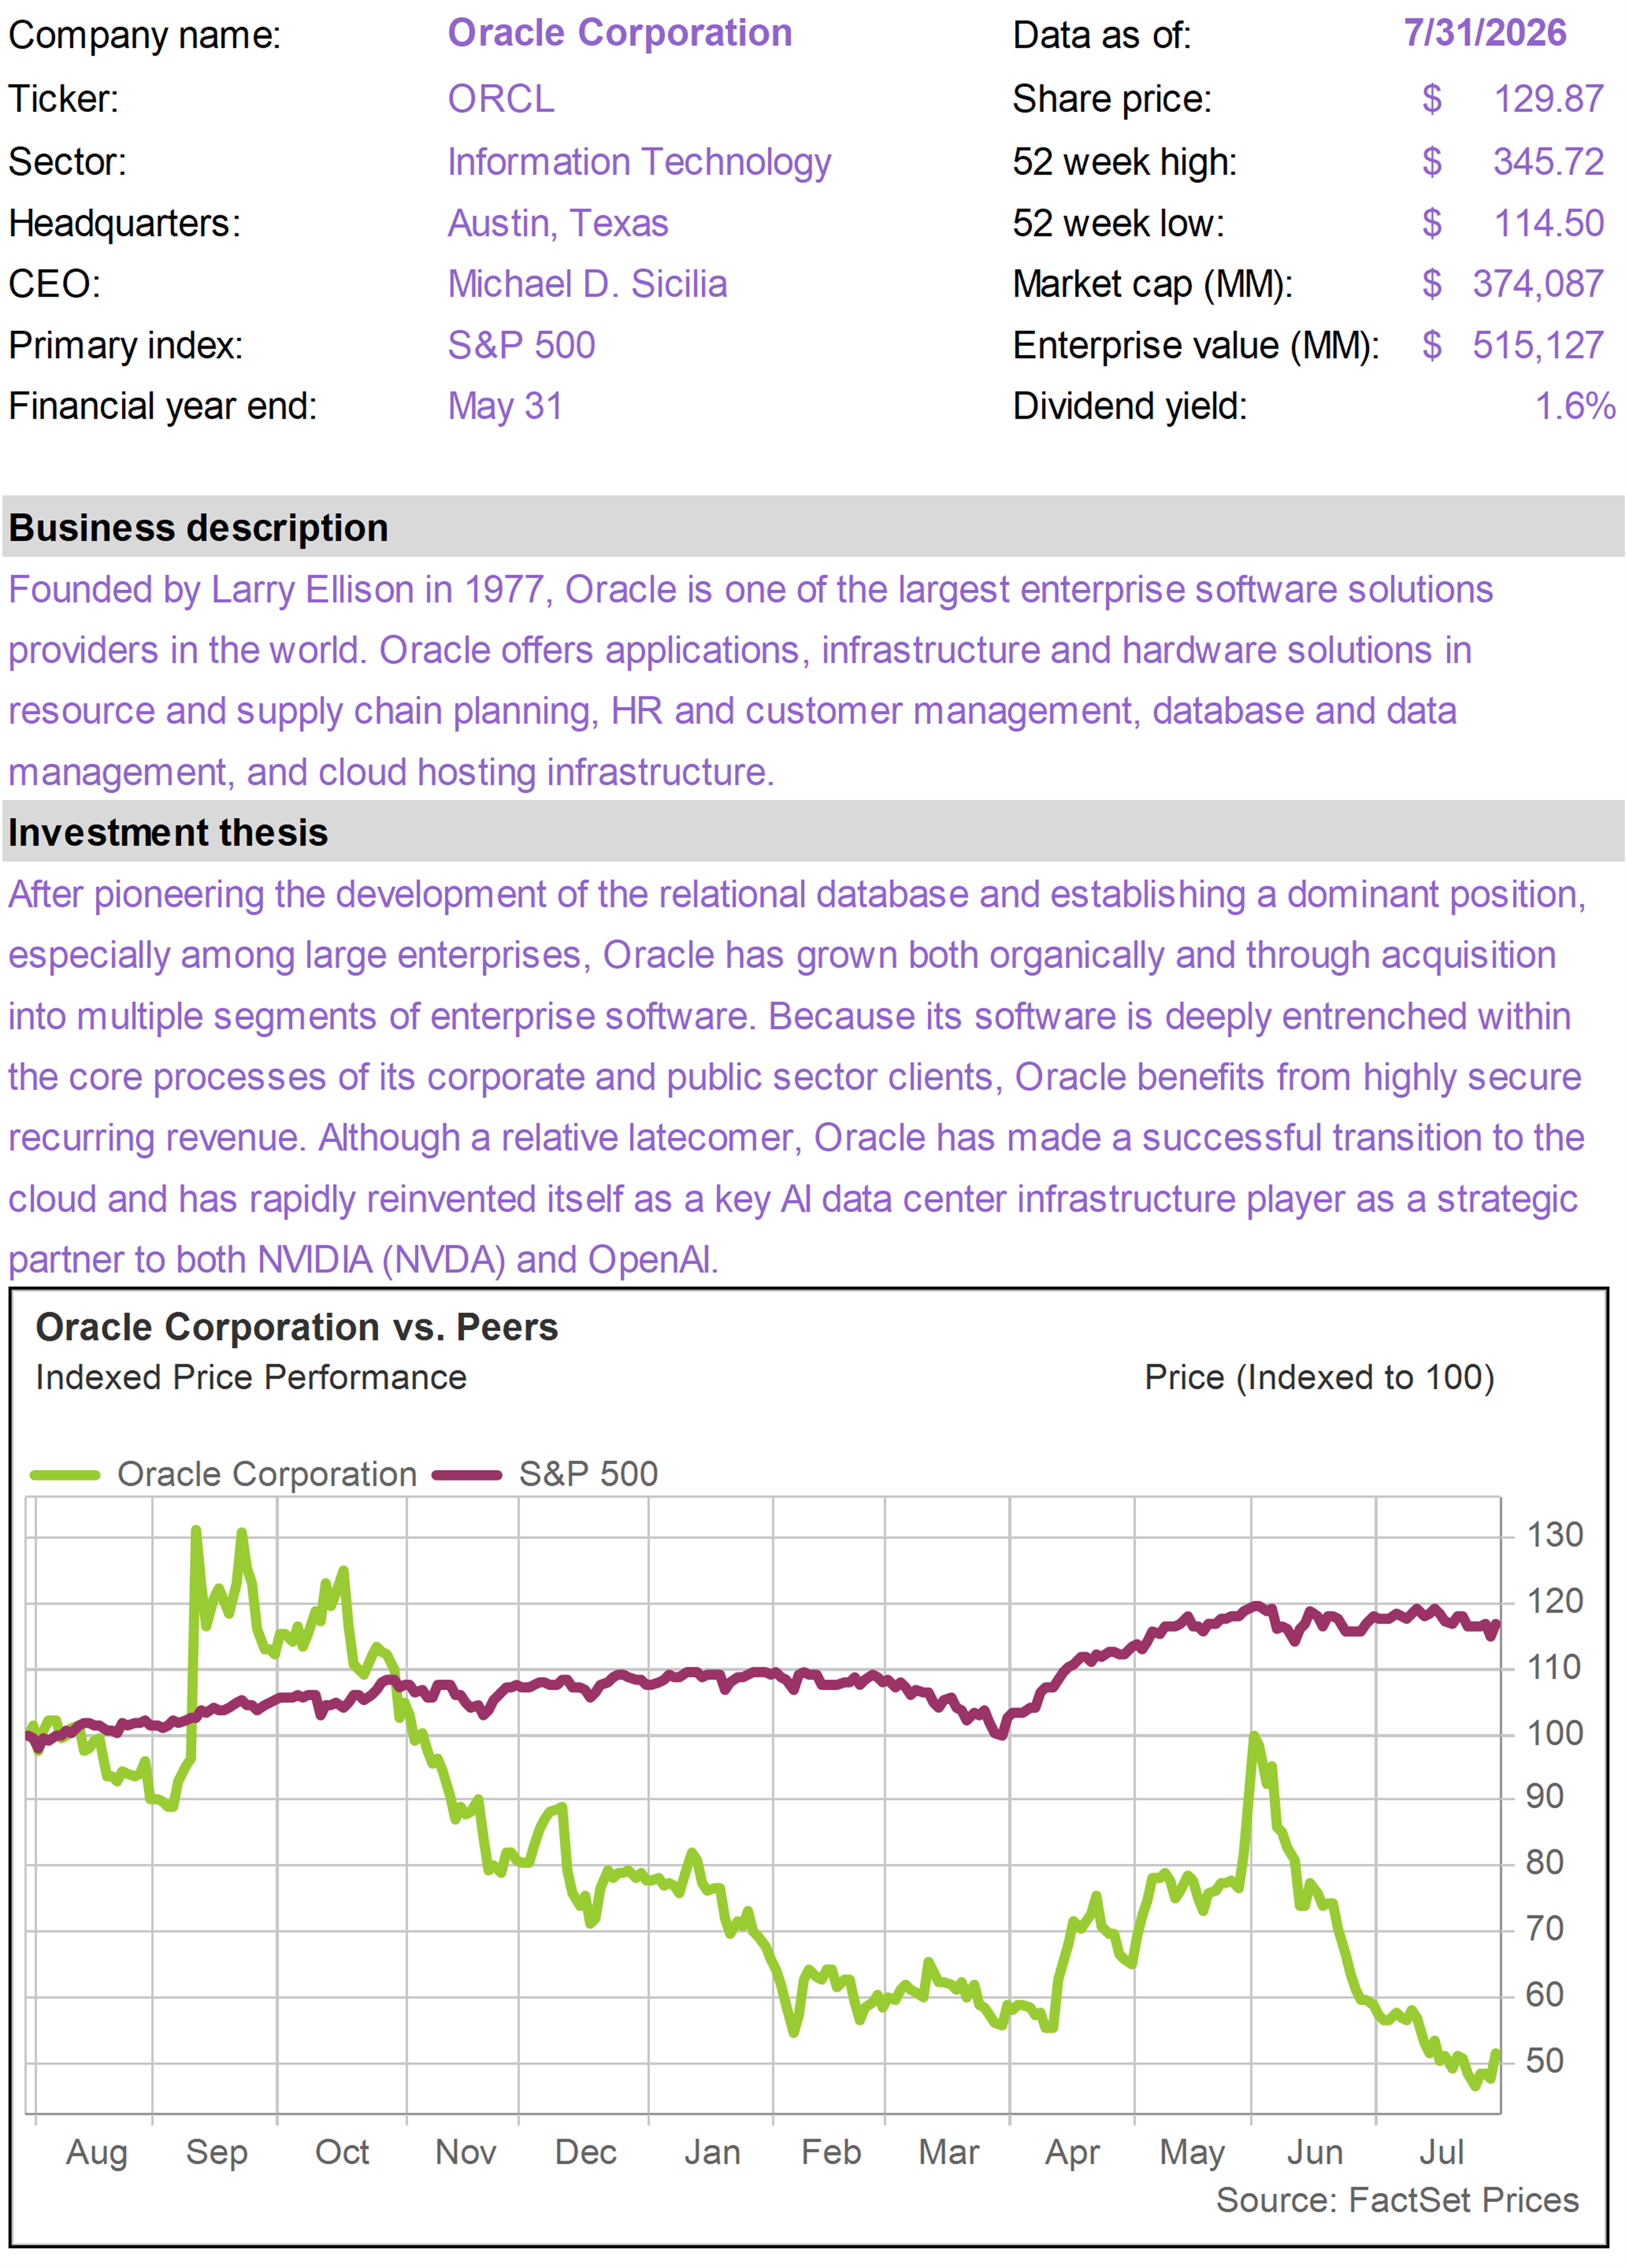
| | ORCL remained under pressure in July as negative Technology sentiment compounded concerns about the cost of its AI infrastructure buildout.
Investors remain focused on the company’s capital-spending requirements, financing needs, leverage and negative near-term free cash flow. Higher interest rates and growing skepticism toward AI spending intensified these concerns.
Yet the fundamental upside case remains substantial.
ORCL expects approximately one gigawatt of computing capacity to come online in the first quarter of fiscal 2027—nearly as much as it delivered during all of fiscal 2026. As this capacity becomes operational, contracted demand should convert into rapidly accelerating cloud revenue.
Demand does not appear to be the problem. Remaining performance obligations reached approximately $638 billion, supported by several contracts exceeding $8 billion and a growing number of smaller agreements.
ORCL secured a ten-year federal contract worth up to $7 billion in July. The agreement provides durable, difficult-to-displace revenue and could create future opportunities as government systems migrate to the cloud.
The longer-term opportunity extends beyond AI model training. ORCL’s databases contain mission-critical enterprise data, positioning its cloud infrastructure business to host recurring inference and agentic workloads close to where that data already resides.
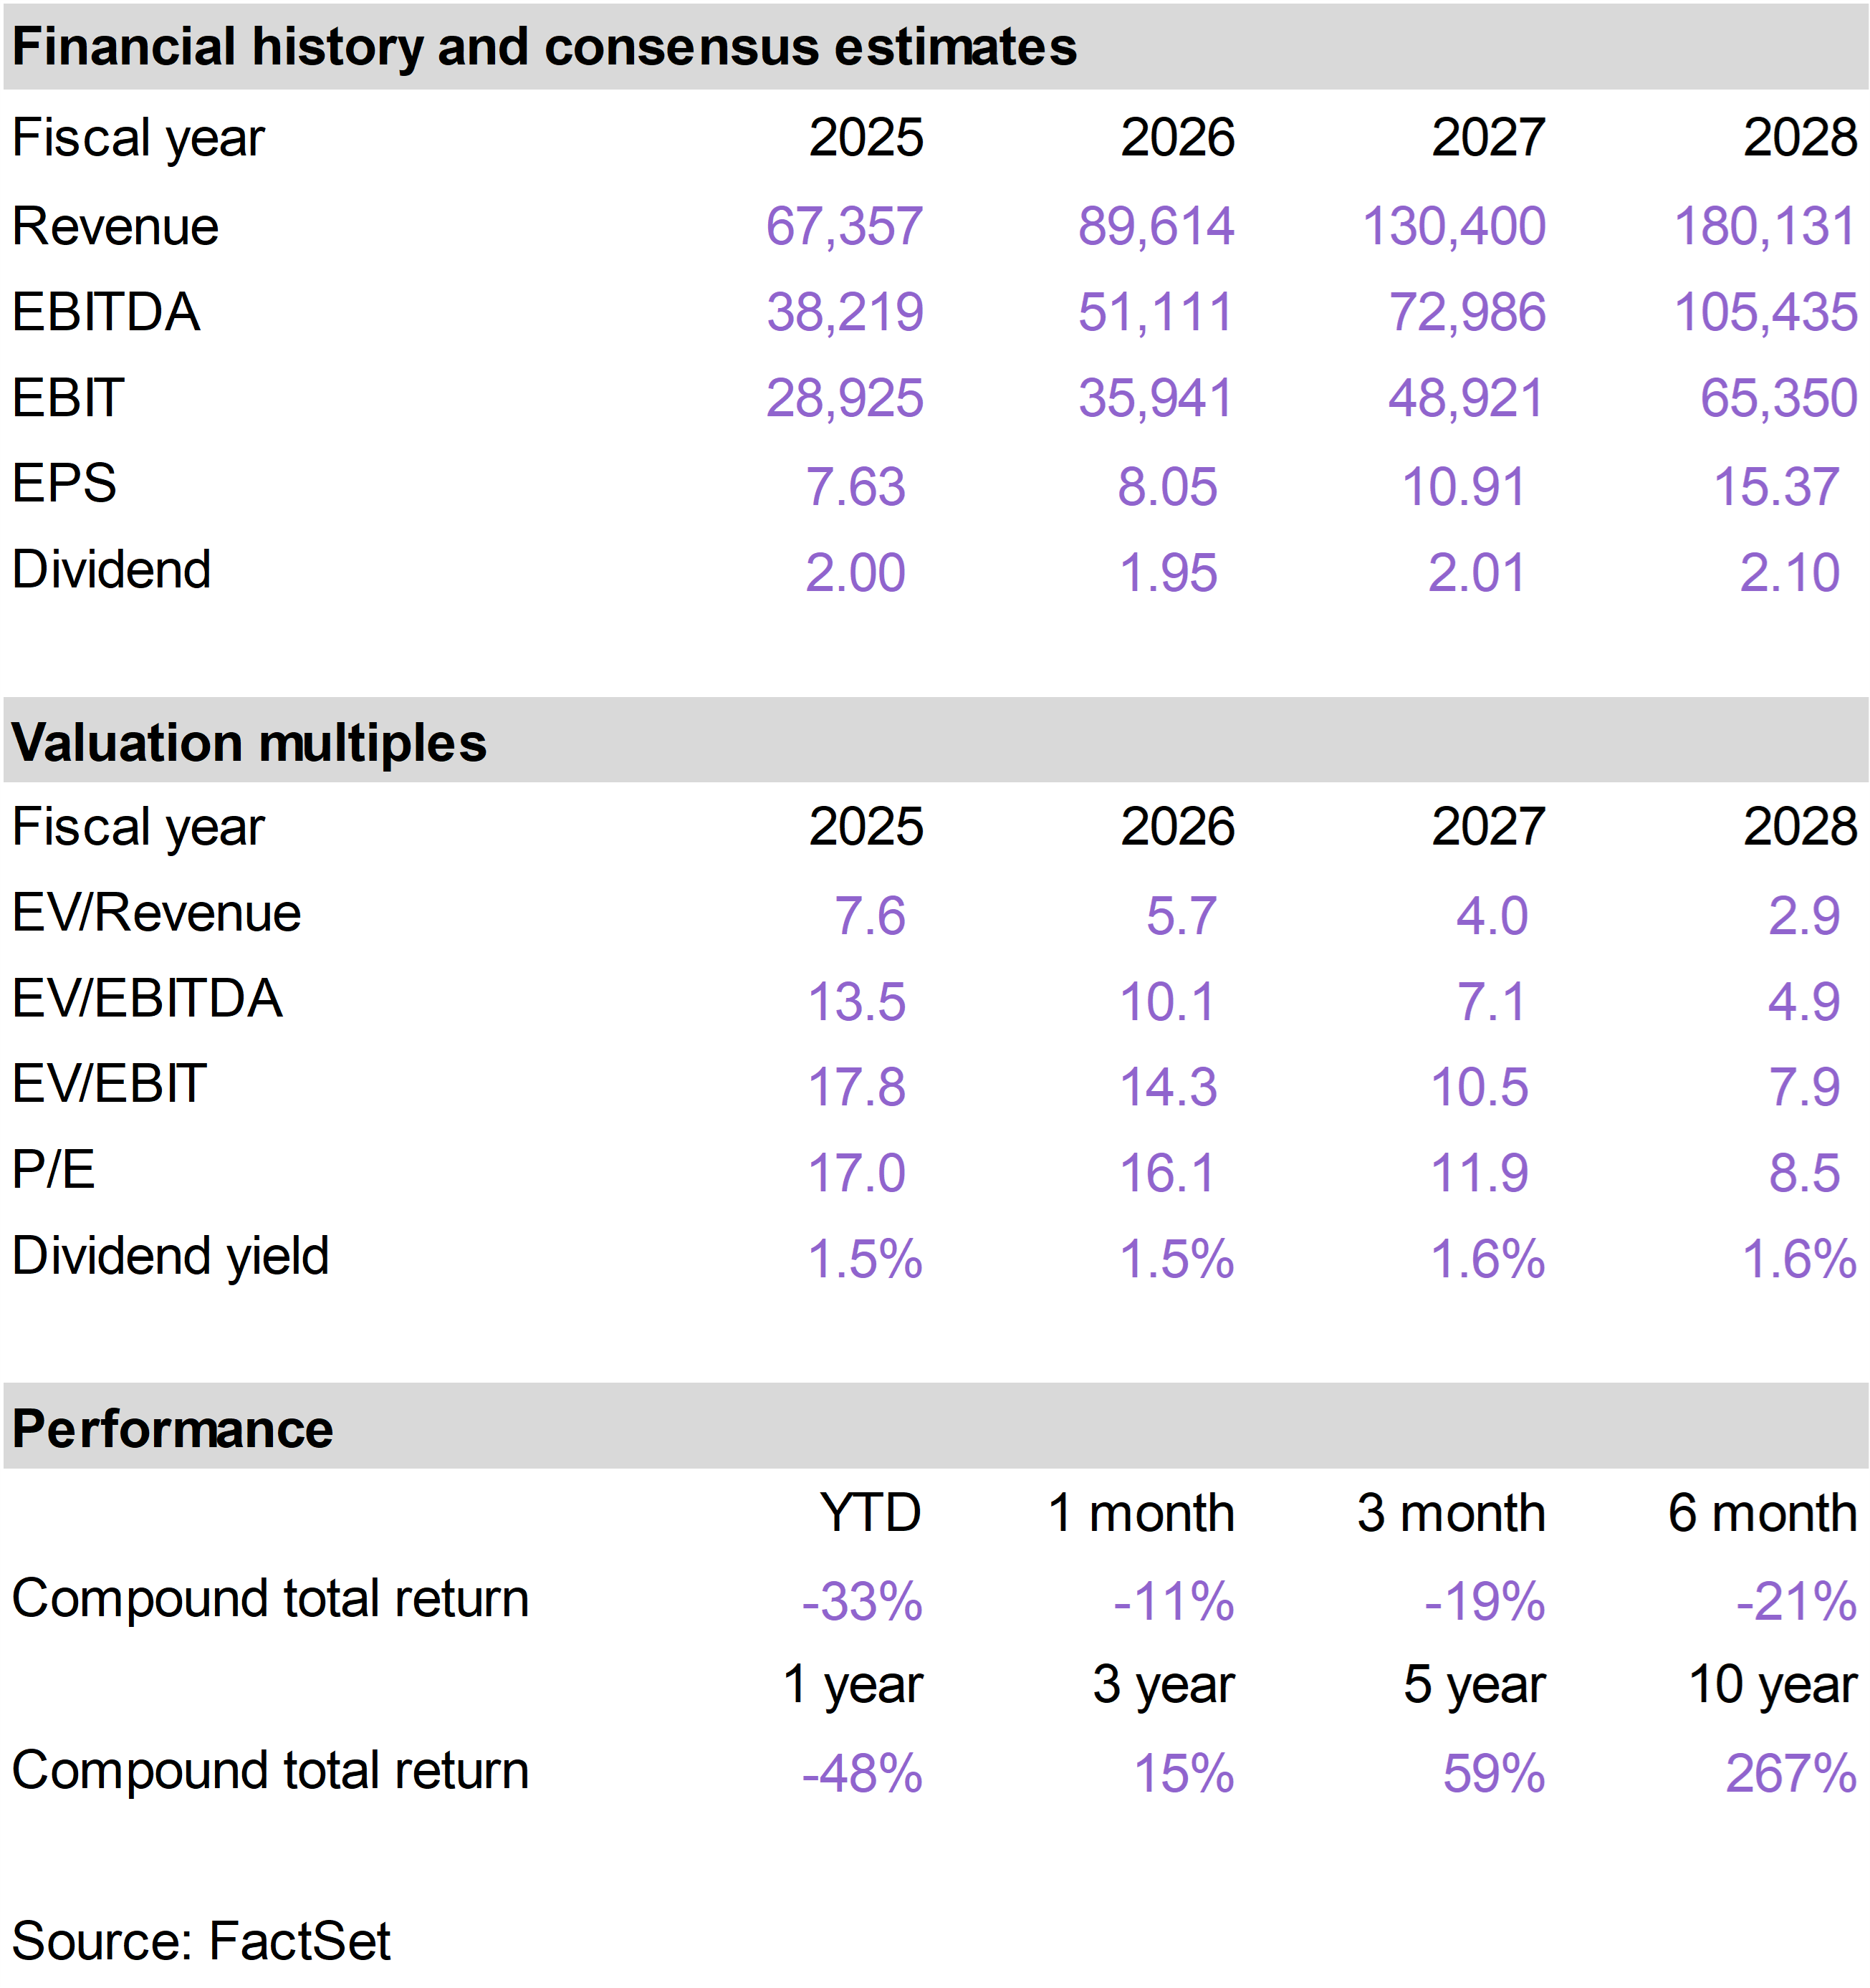
The risks are real, and investors may remain cautious until ORCL proves that it can deliver capacity without compromising its credit profile. But the stock now trades at a substantial discount to other large cloud providers despite the potential for significantly faster revenue growth.
July’s weakness therefore reflected financing and capital-intensity concerns—not deteriorating demand. As new capacity comes online, ORCL retains meaningful upside from earnings growth and a potential valuation recovery. |
|
| | VMC declined in July, with much of the weakness occurring around its second quarter earnings report and the resolution of its long-running dispute with Mexico.
Second quarter revenue increased approximately 3% to $2.16 billion, exceeding expectations, while adjusted earnings rose to $2.59 per share. Aggregates shipments increased 1%, despite heavy rainfall in Texas and several southeastern markets.
Pricing remained the most important strength. Mix-adjusted aggregates prices increased 5%, while cash gross profit per ton exceeded $12 and improved from the prior year.
Adjusted EBITDA was approximately unchanged at $654 million despite nearly $40 million of energy-related headwinds. Management reiterated its full-year adjusted EBITDA guidance of $2.4 billion to $2.6 billion.
The negative market reaction likely reflected the absence of an upward guidance revision, along with continued concern about elevated diesel costs, weak residential construction and the timing of shipment growth.
The results were solid, but investors appeared to want clearer evidence that pricing and improving demand would produce stronger second-half earnings.
The disappointing outcome of VMC’s arbitration against Mexico also weighed on sentiment. The tribunal found that Mexico had violated NAFTA in several respects but awarded only negligible damages, eliminating a potential recovery that some investors had viewed as a source of upside.
The underlying outlook remains constructive. Public infrastructure awards in the company’s markets are up approximately 20%, while highway awards are growing at a double-digit rate.
Data centers, power infrastructure, LNG facilities and manufacturing projects are also creating significant aggregates demand.
VMC’s strong pricing power, scarce quarry assets and attractive Sunbelt footprint remain central to the investment thesis. Near-term fuel and weather pressures may create earnings volatility, but the company is well positioned to benefit as infrastructure and large private projects translate into higher shipments. |
|
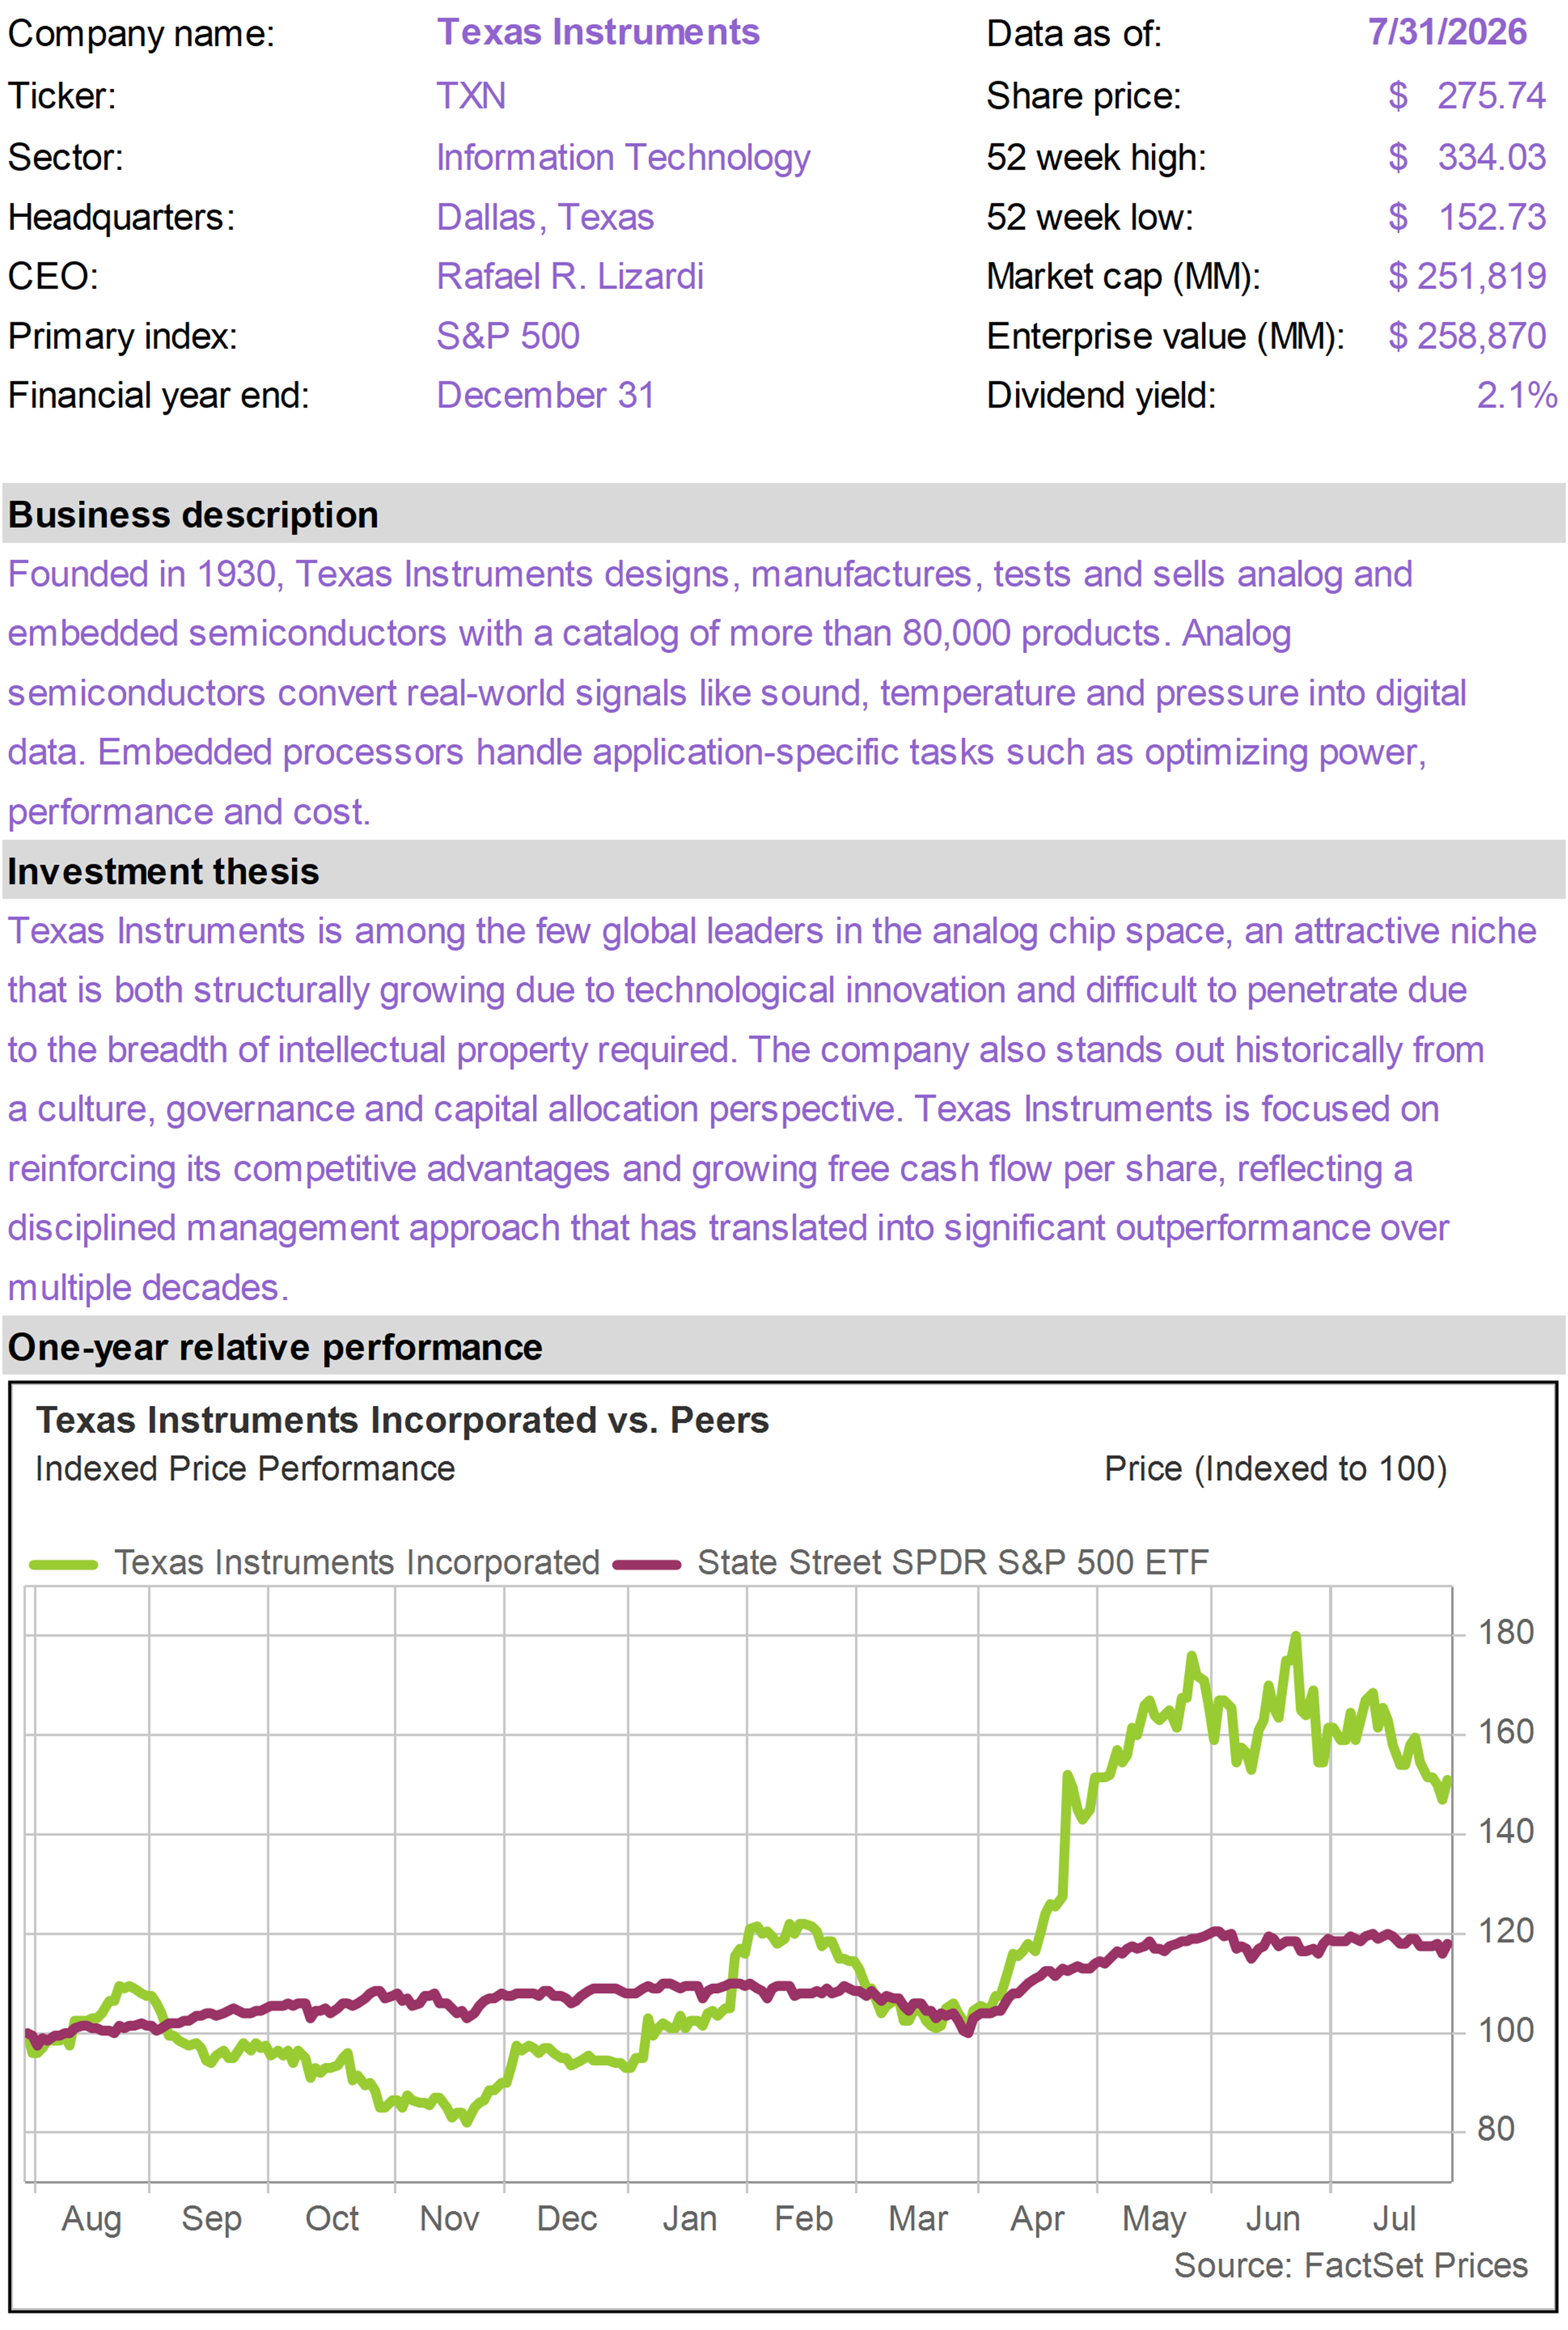
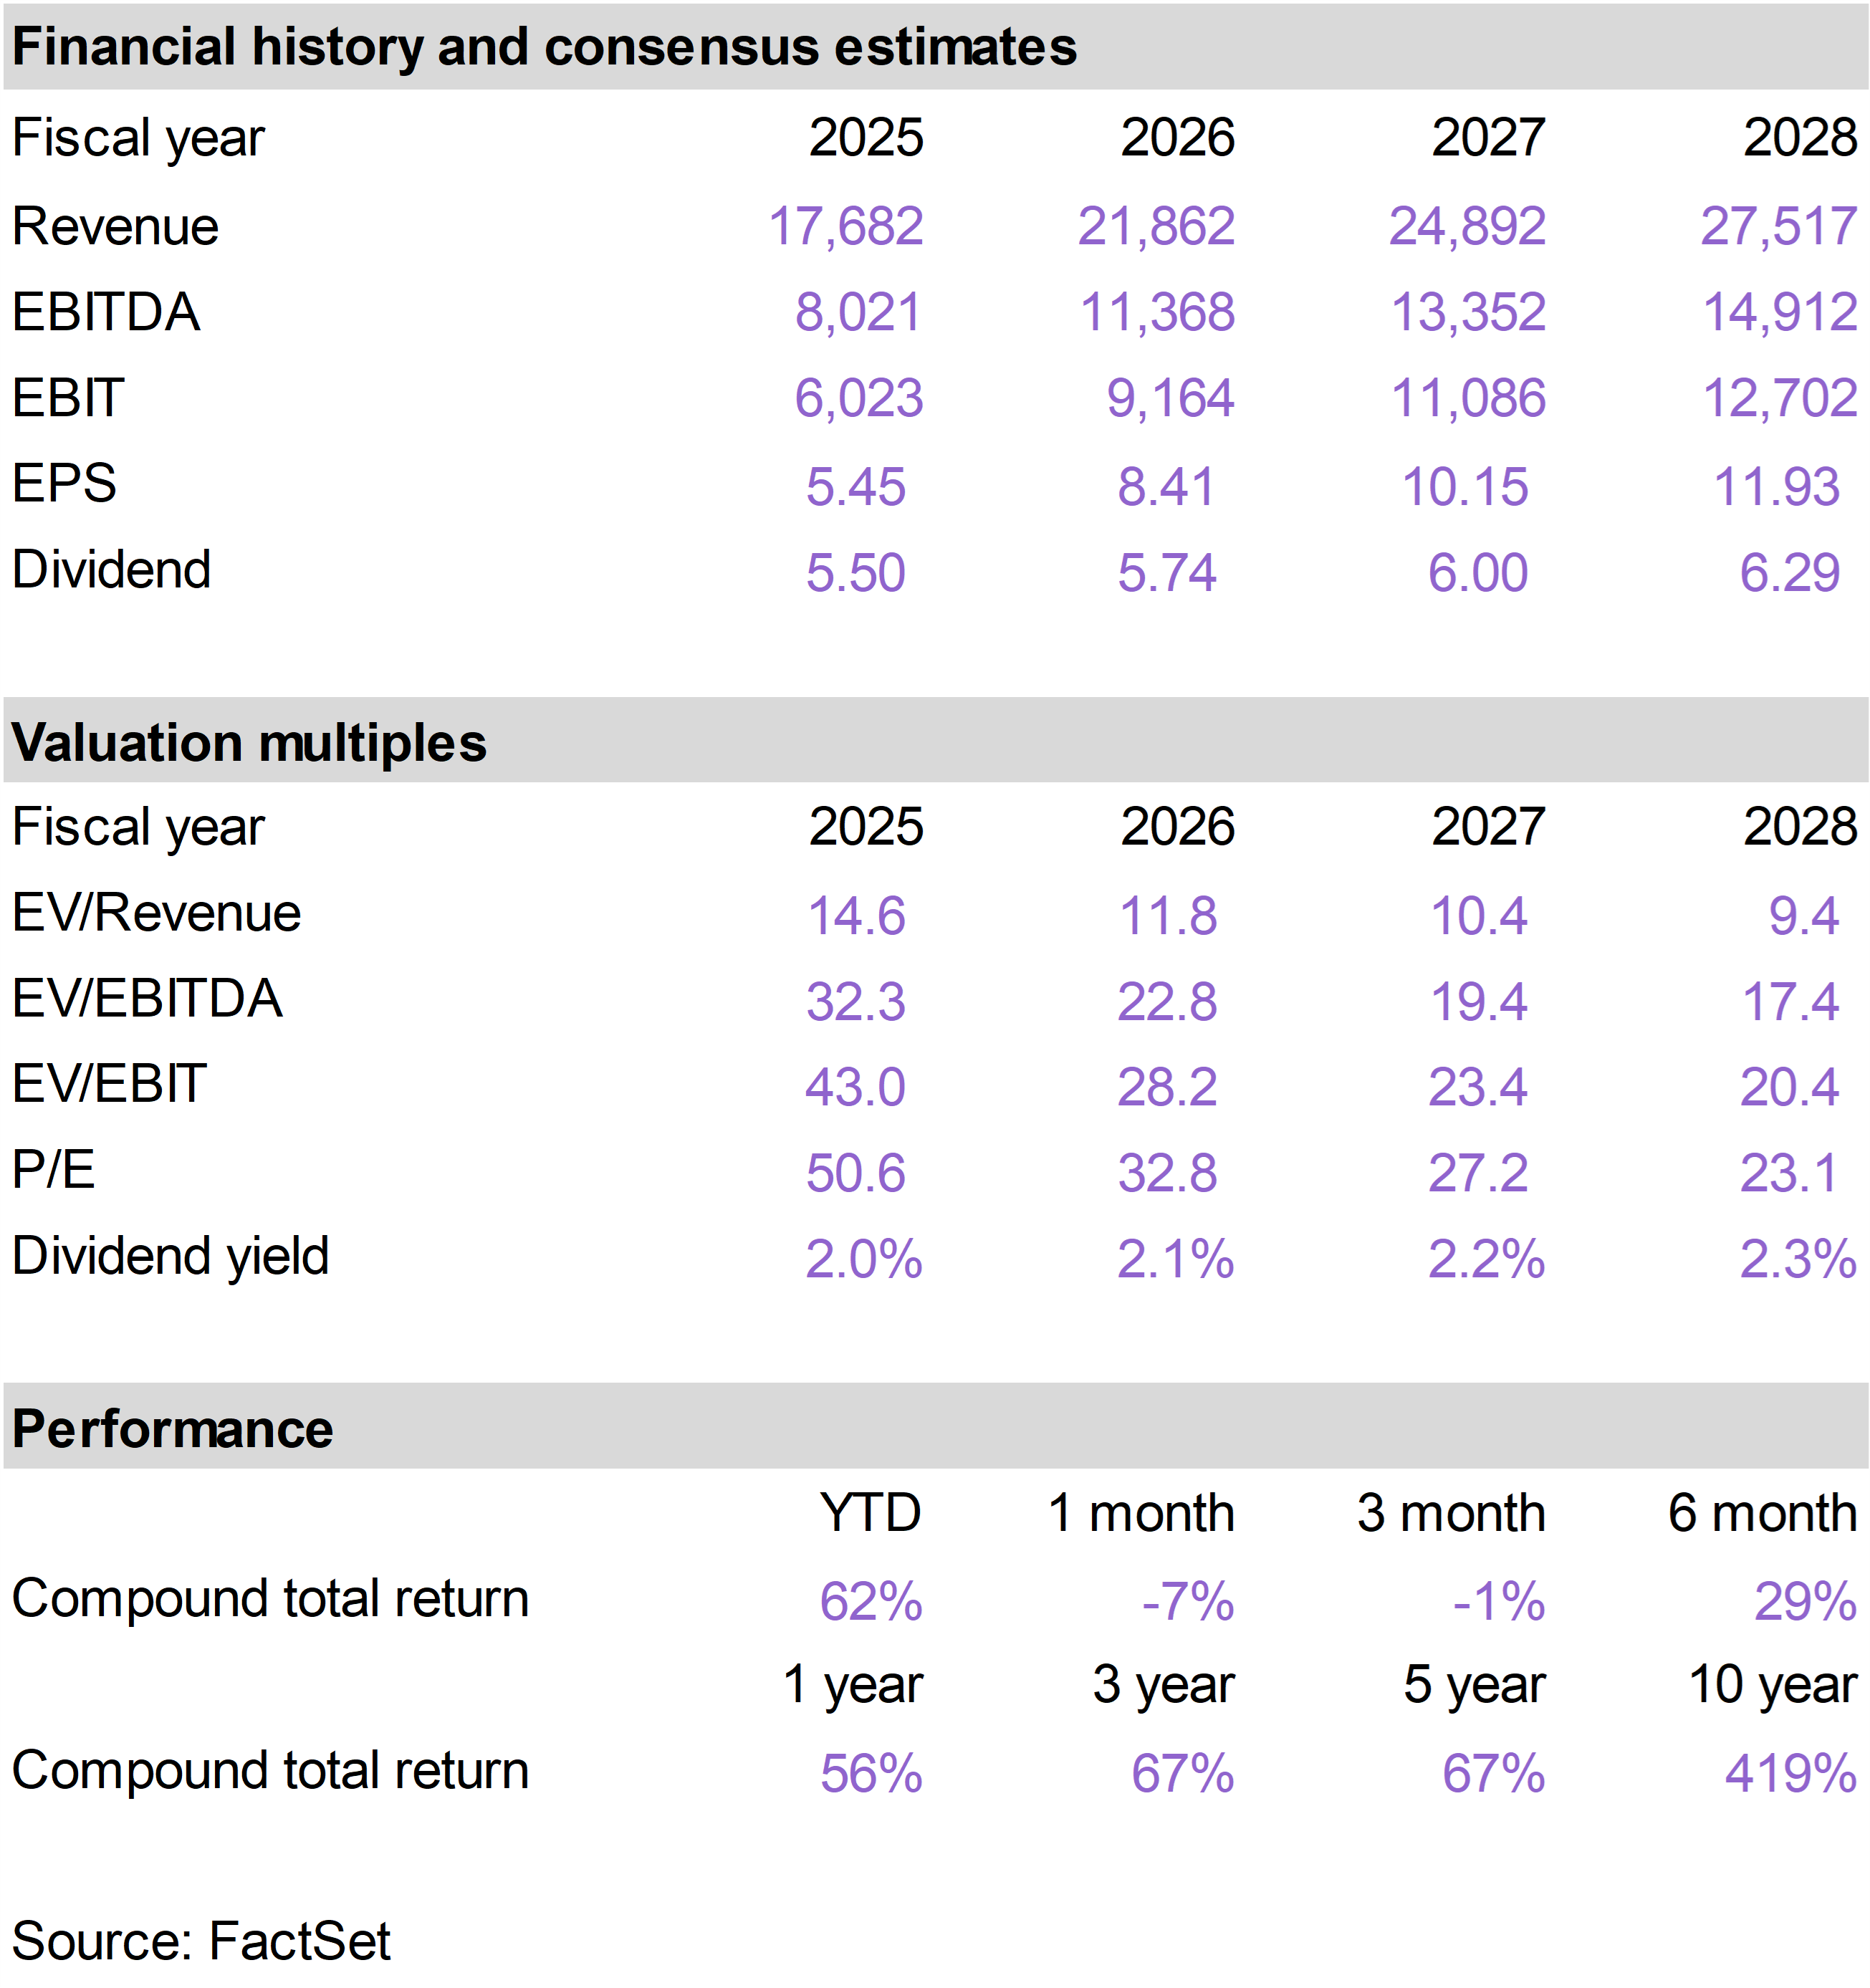
| | TXN declined in July, broadly in line with the weakness across Technology and semiconductor stocks. But the share price move contrasted with substantial progress in the underlying business.
Second quarter revenue increased 23% year-over-year to $5.46 billion, exceeding the high end of management’s guidance. Earnings per share reached $2.14, ahead of expectations, while gross and operating margins also came in stronger than anticipated.
Management’s third quarter outlook was similarly encouraging. The midpoint of revenue guidance implies approximately 8% sequential growth—above normal seasonal patterns—while projected earnings were roughly 10% ahead of prior consensus expectations.
The recovery is also becoming increasingly broad-based.
Industrial revenue increased approximately 30% year-over-year, supported by aerospace and defense, energy infrastructure and test-and-measurement demand. Automotive revenue grew at a mid-teens rate as inventories at several customers became increasingly lean, particularly within electric and hybrid vehicles.
Data centers represent an especially promising growth opportunity. Revenue from this market approximately doubled from the prior year and increased 20% sequentially.
TXN supplies power-management chips that regulate and distribute electricity throughout servers and AI computing systems, giving the company meaningful exposure to the AI infrastructure buildout without competing directly in advanced processors.
The financial outlook is also improving as TXN emerges from a multi-year investment cycle. Trailing free cash flow increased to approximately $6.5 billion from $1.8 billion a year earlier.
Capital spending is declining from the unusually elevated levels of recent years, while revenue growth allows the company to absorb the fixed costs associated with its expanded domestic manufacturing footprint.
TXN may continue to trade with the broader semiconductor sector in the short term, particularly after its strong advance earlier in the year. But July’s results demonstrated that the company is gaining share, benefiting from recoveries in Industrial and Automotive, and developing a meaningful AI-related data-center business.
The combination of accelerating revenue, improving margins and a transition toward substantially higher free cash flow defines the long-term investment case. |
|
| | |
| | |
| | |
| | | Oracle Corporation (ORCL) |
|
|
|
| | |
|
| | |
|
| | |
|
| | Arch Capital Group (ACGL) |
|
|
|
| | |
|
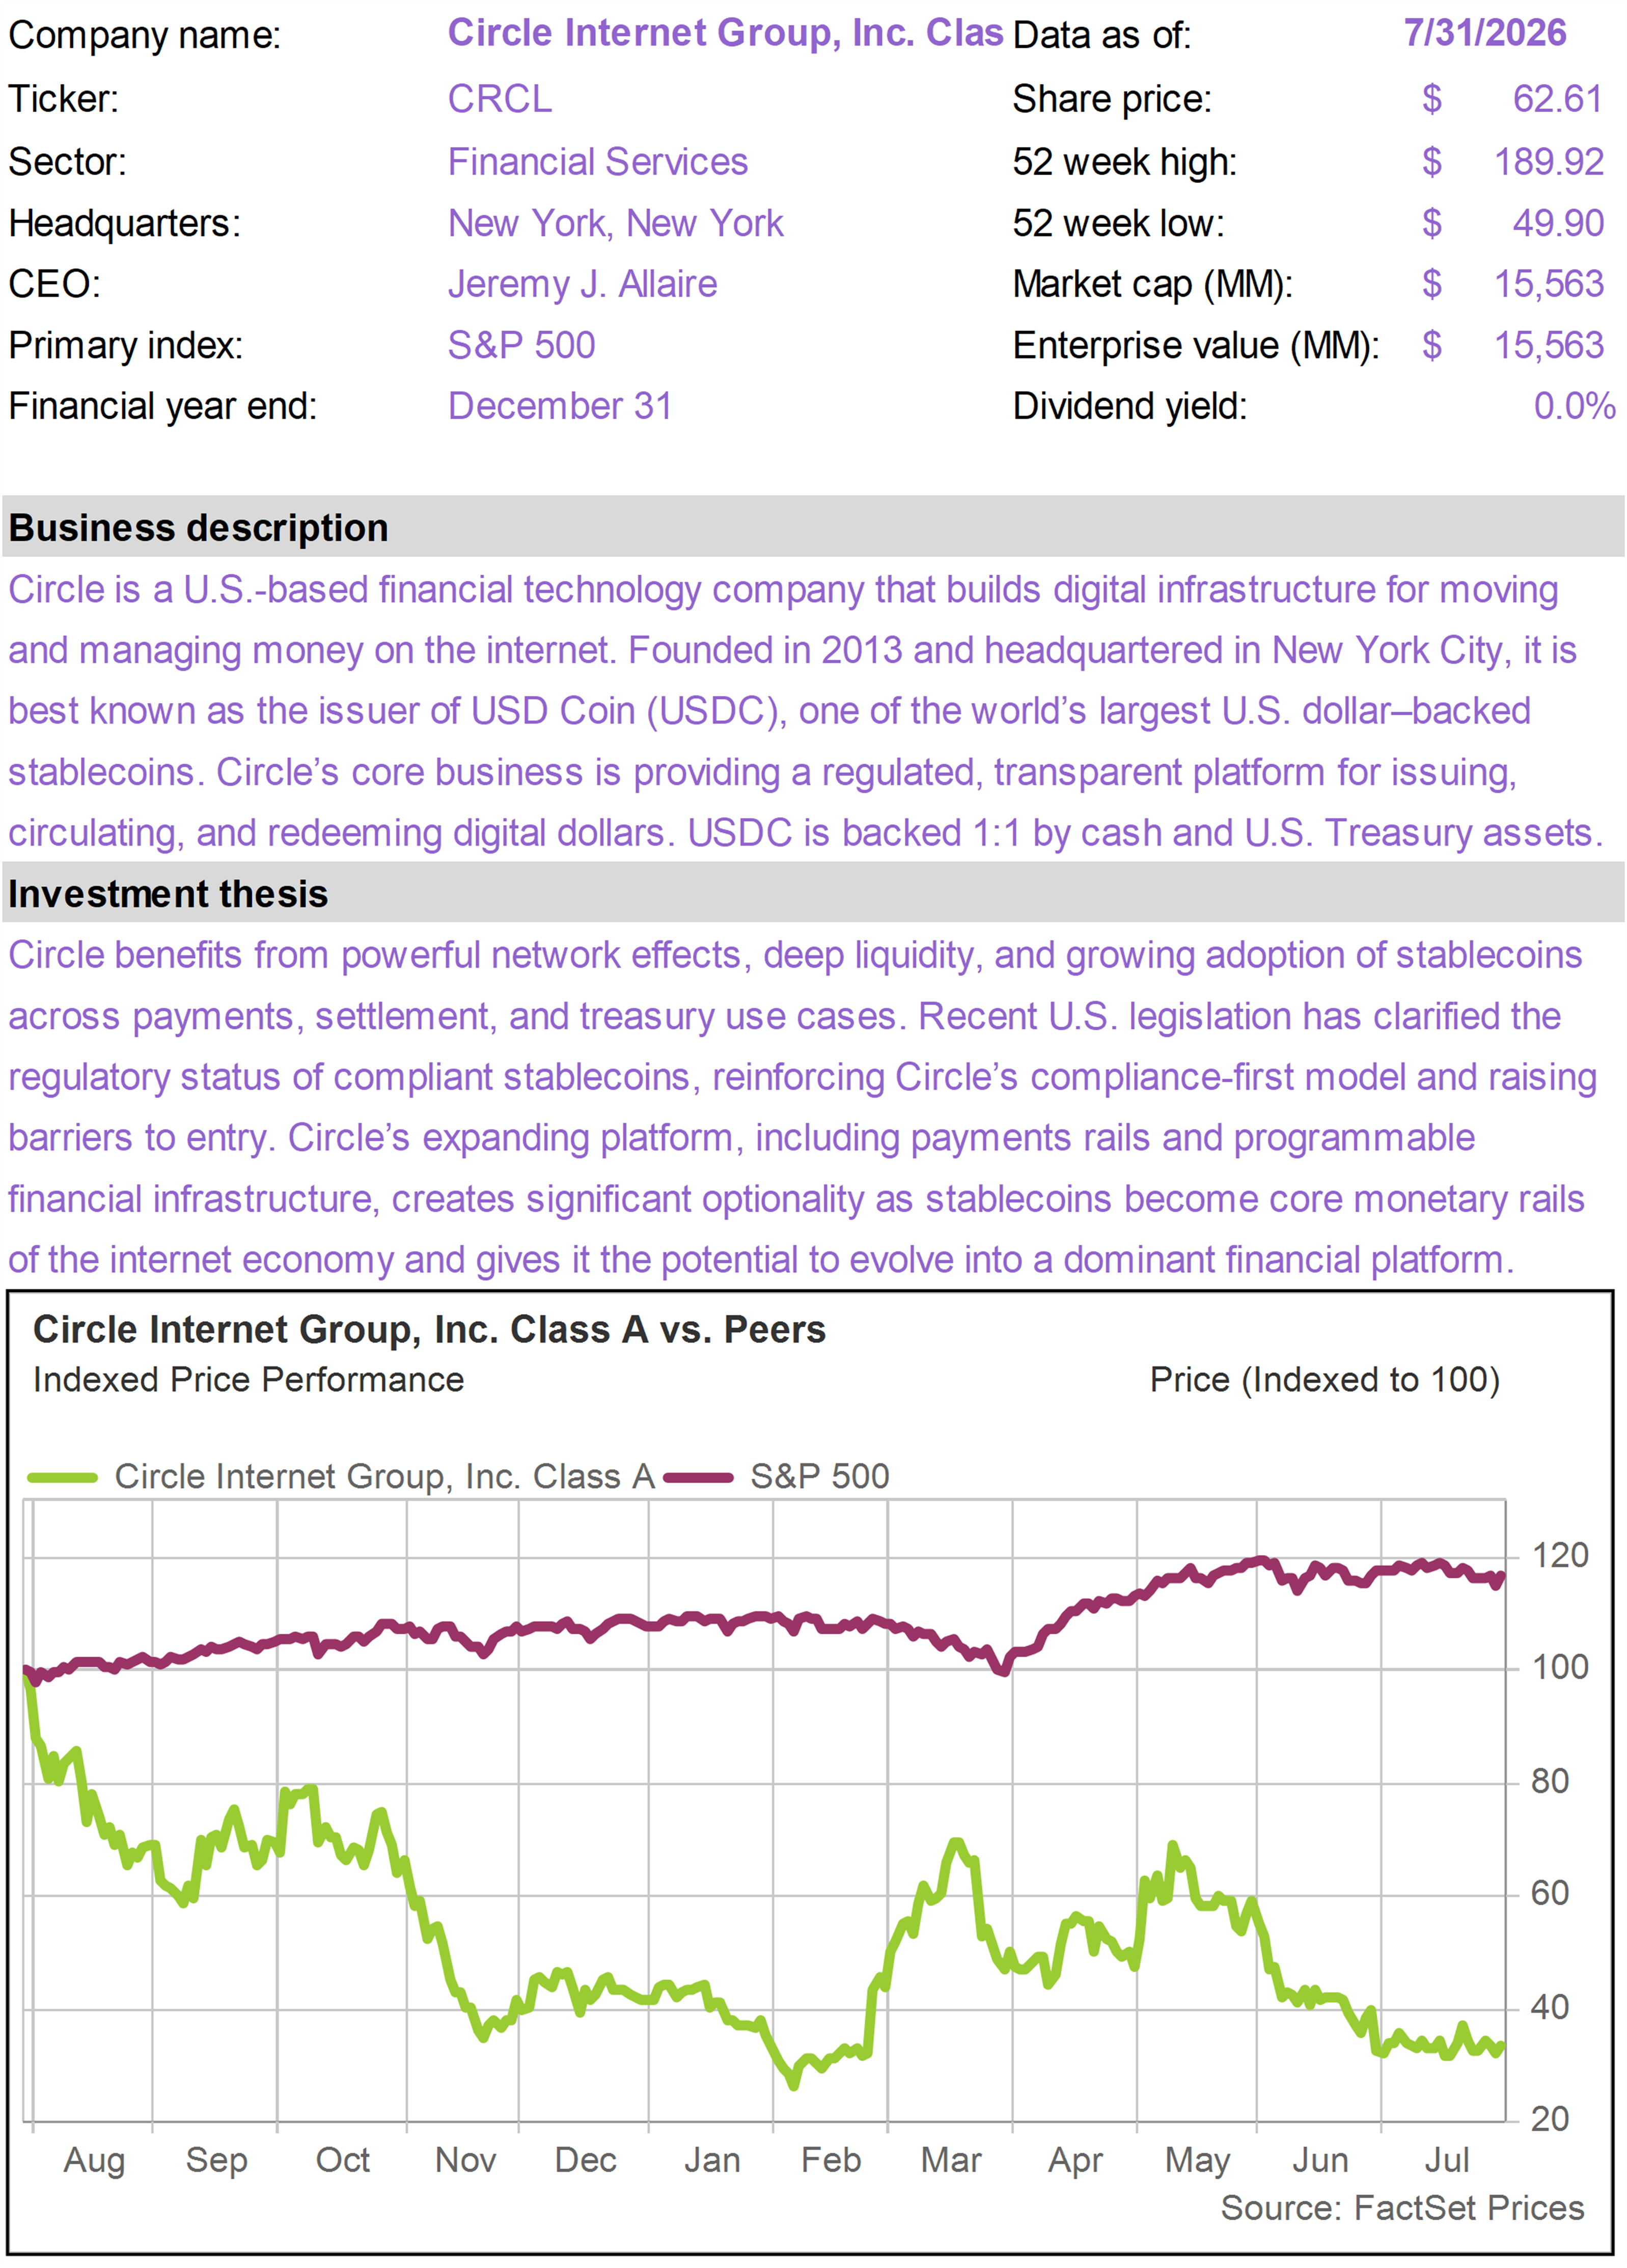
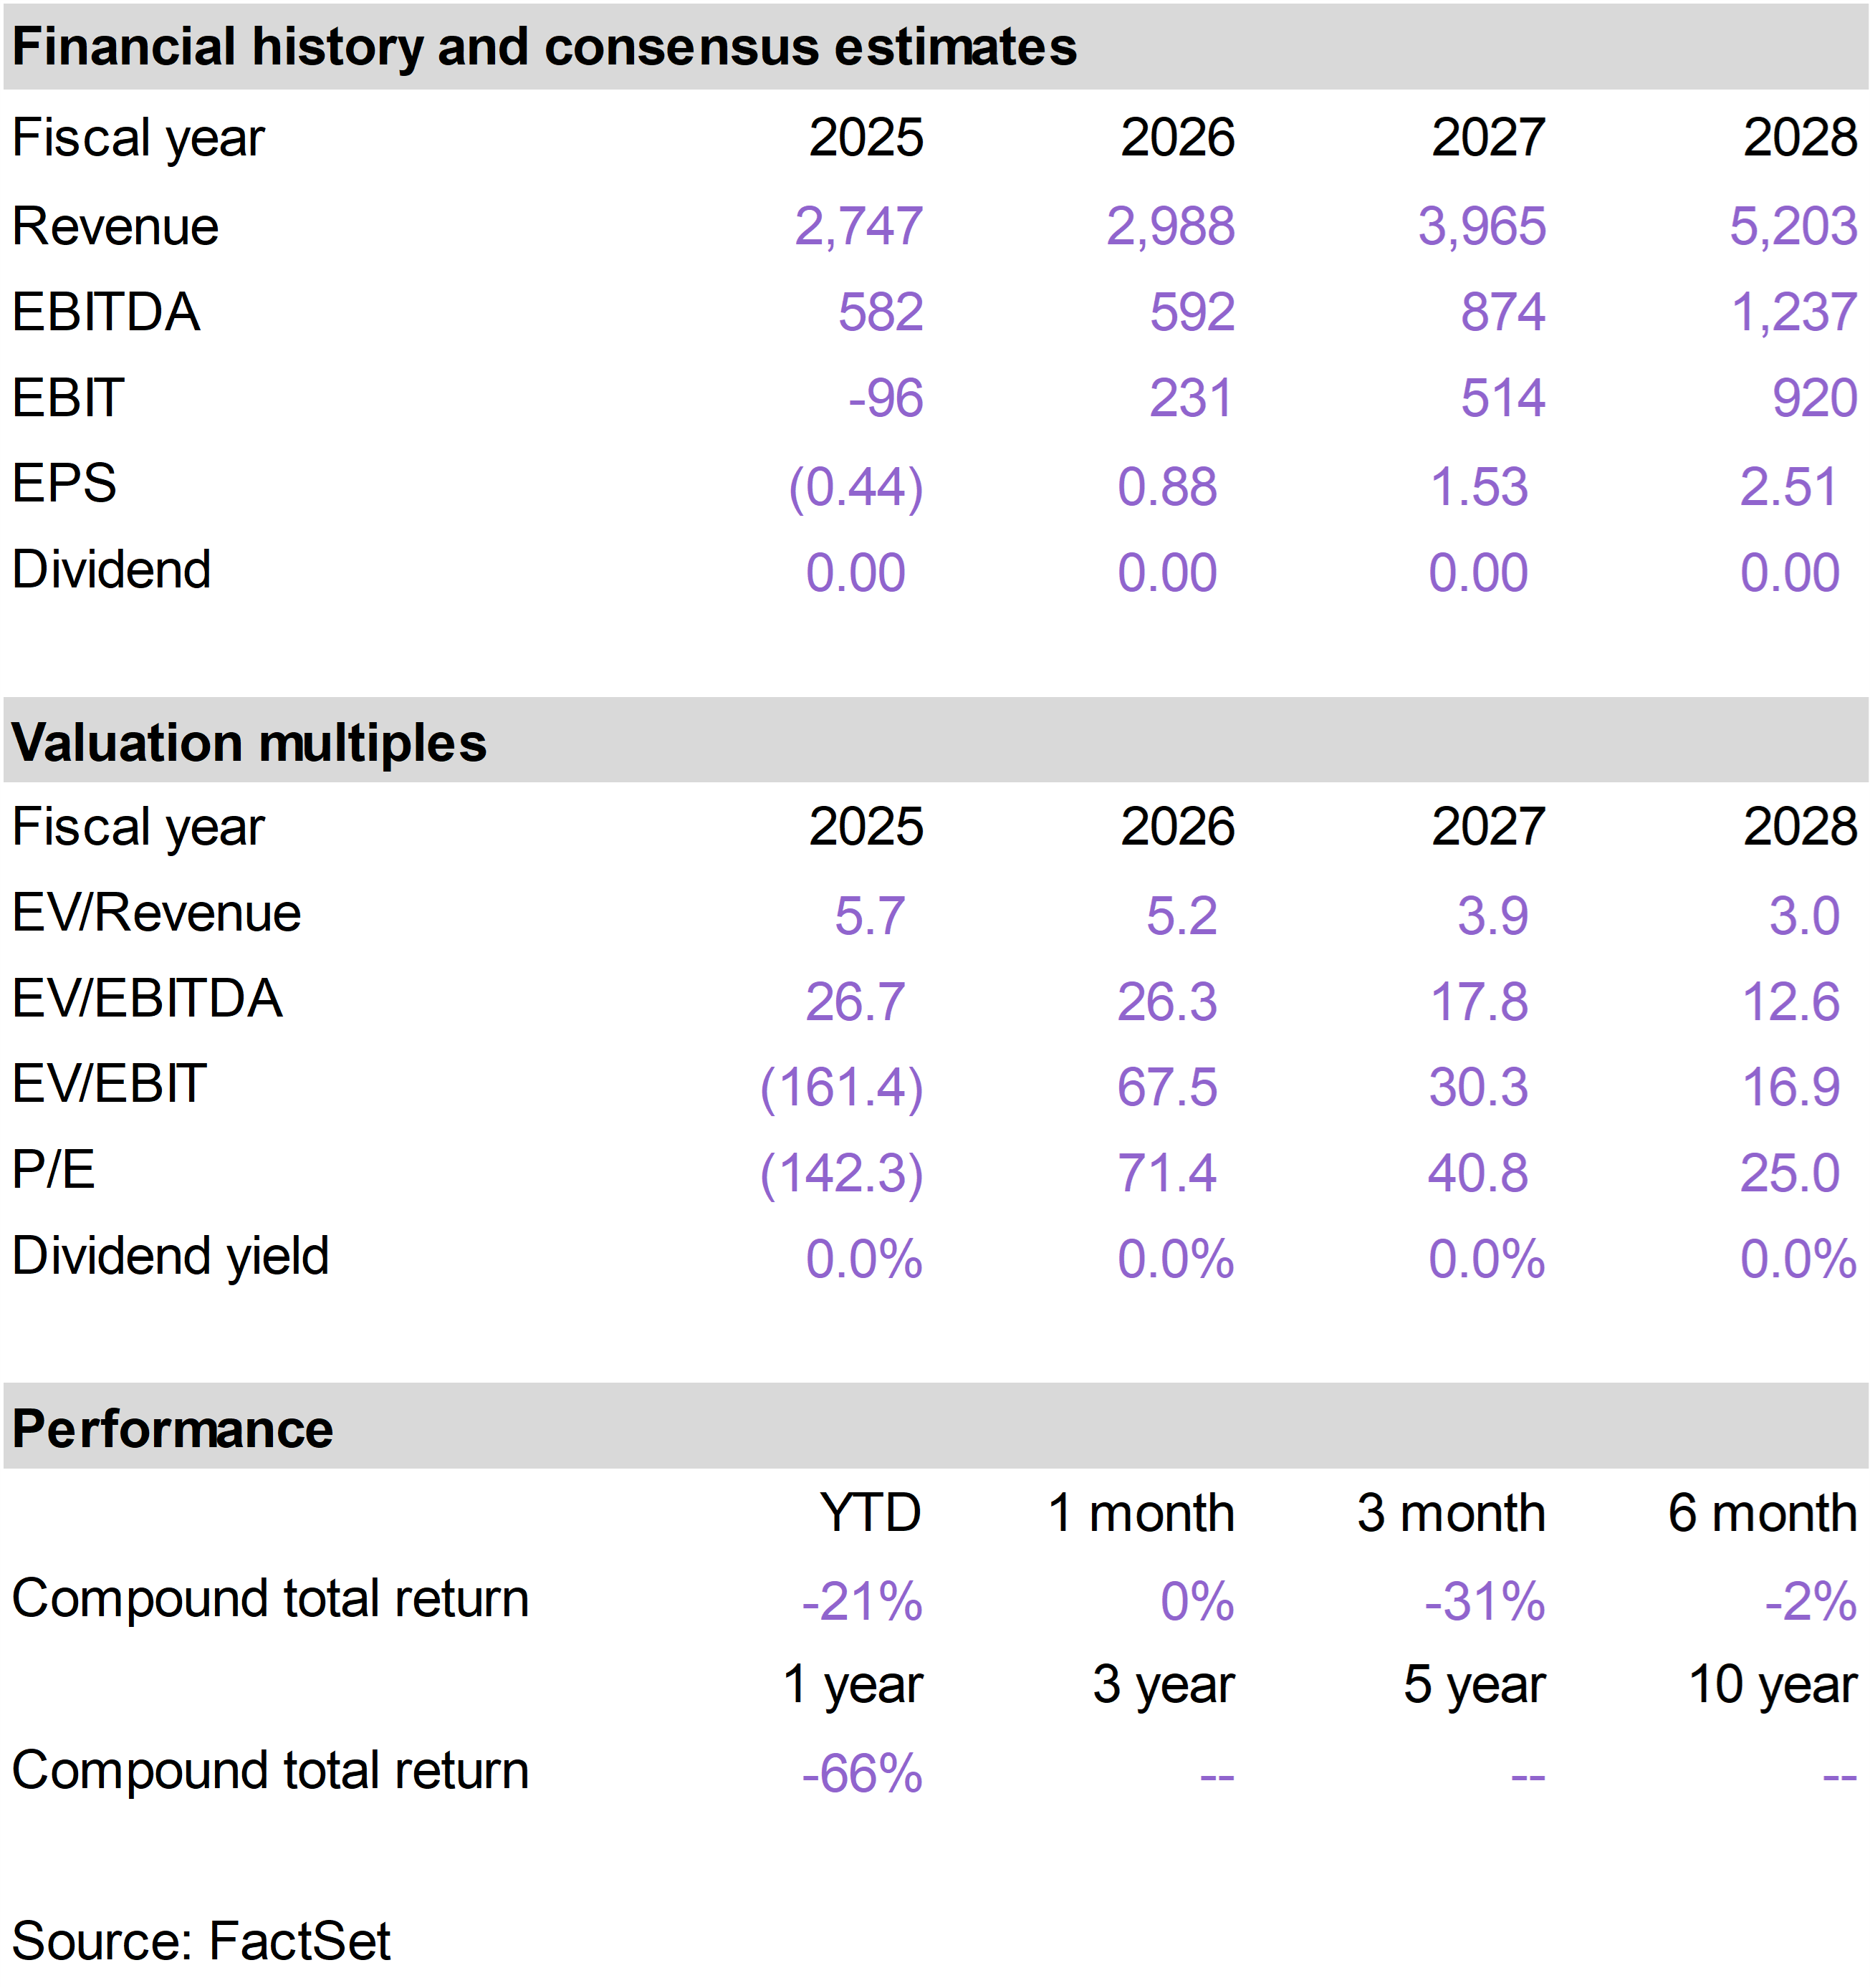
| | Circle Internet Group (CRCL) |
|
|
|
| | |
|
| | |
|
| | |
|
| | |
|
| | Thermo Fisher Scientific (TMO) |
|
|
|
| | |
|
| | |
|
| | |
|
| | |
|
| | The 76research American Resilience Model Portfolio is designed to provide exposure to growth businesses that operate with competitive advantages in structurally attractive markets. The objective is to identify businesses that can survive and thrive across different macroeconomic environments and whatever geopolitical crises may unfold. The holdings are intended as long-term investments to drive portfolio compounding with minimal need to realize taxable gains. Emphasis is placed on critical markers of business quality such as barriers to entry, physical scarcity of assets, balance sheet strength, effective capital allocation and durable long-term growth drivers. These assessments are paired with careful consideration of valuation and risk. |
|
| | FOR SUBSCRIBER USE ONLY. DO NOT FORWARD OR SHARE. |
|
| | | |
|
|
|
|
|