| Income Builder Model Portfolio |
|
| Monthly Portfolio Review: September 2026Publication date: October 5, 2026 |
|
| | | Current portfolio holdings |
|
|
| | FOR SUBSCRIBER USE ONLY. DO NOT FORWARD OR SHARE. |
|
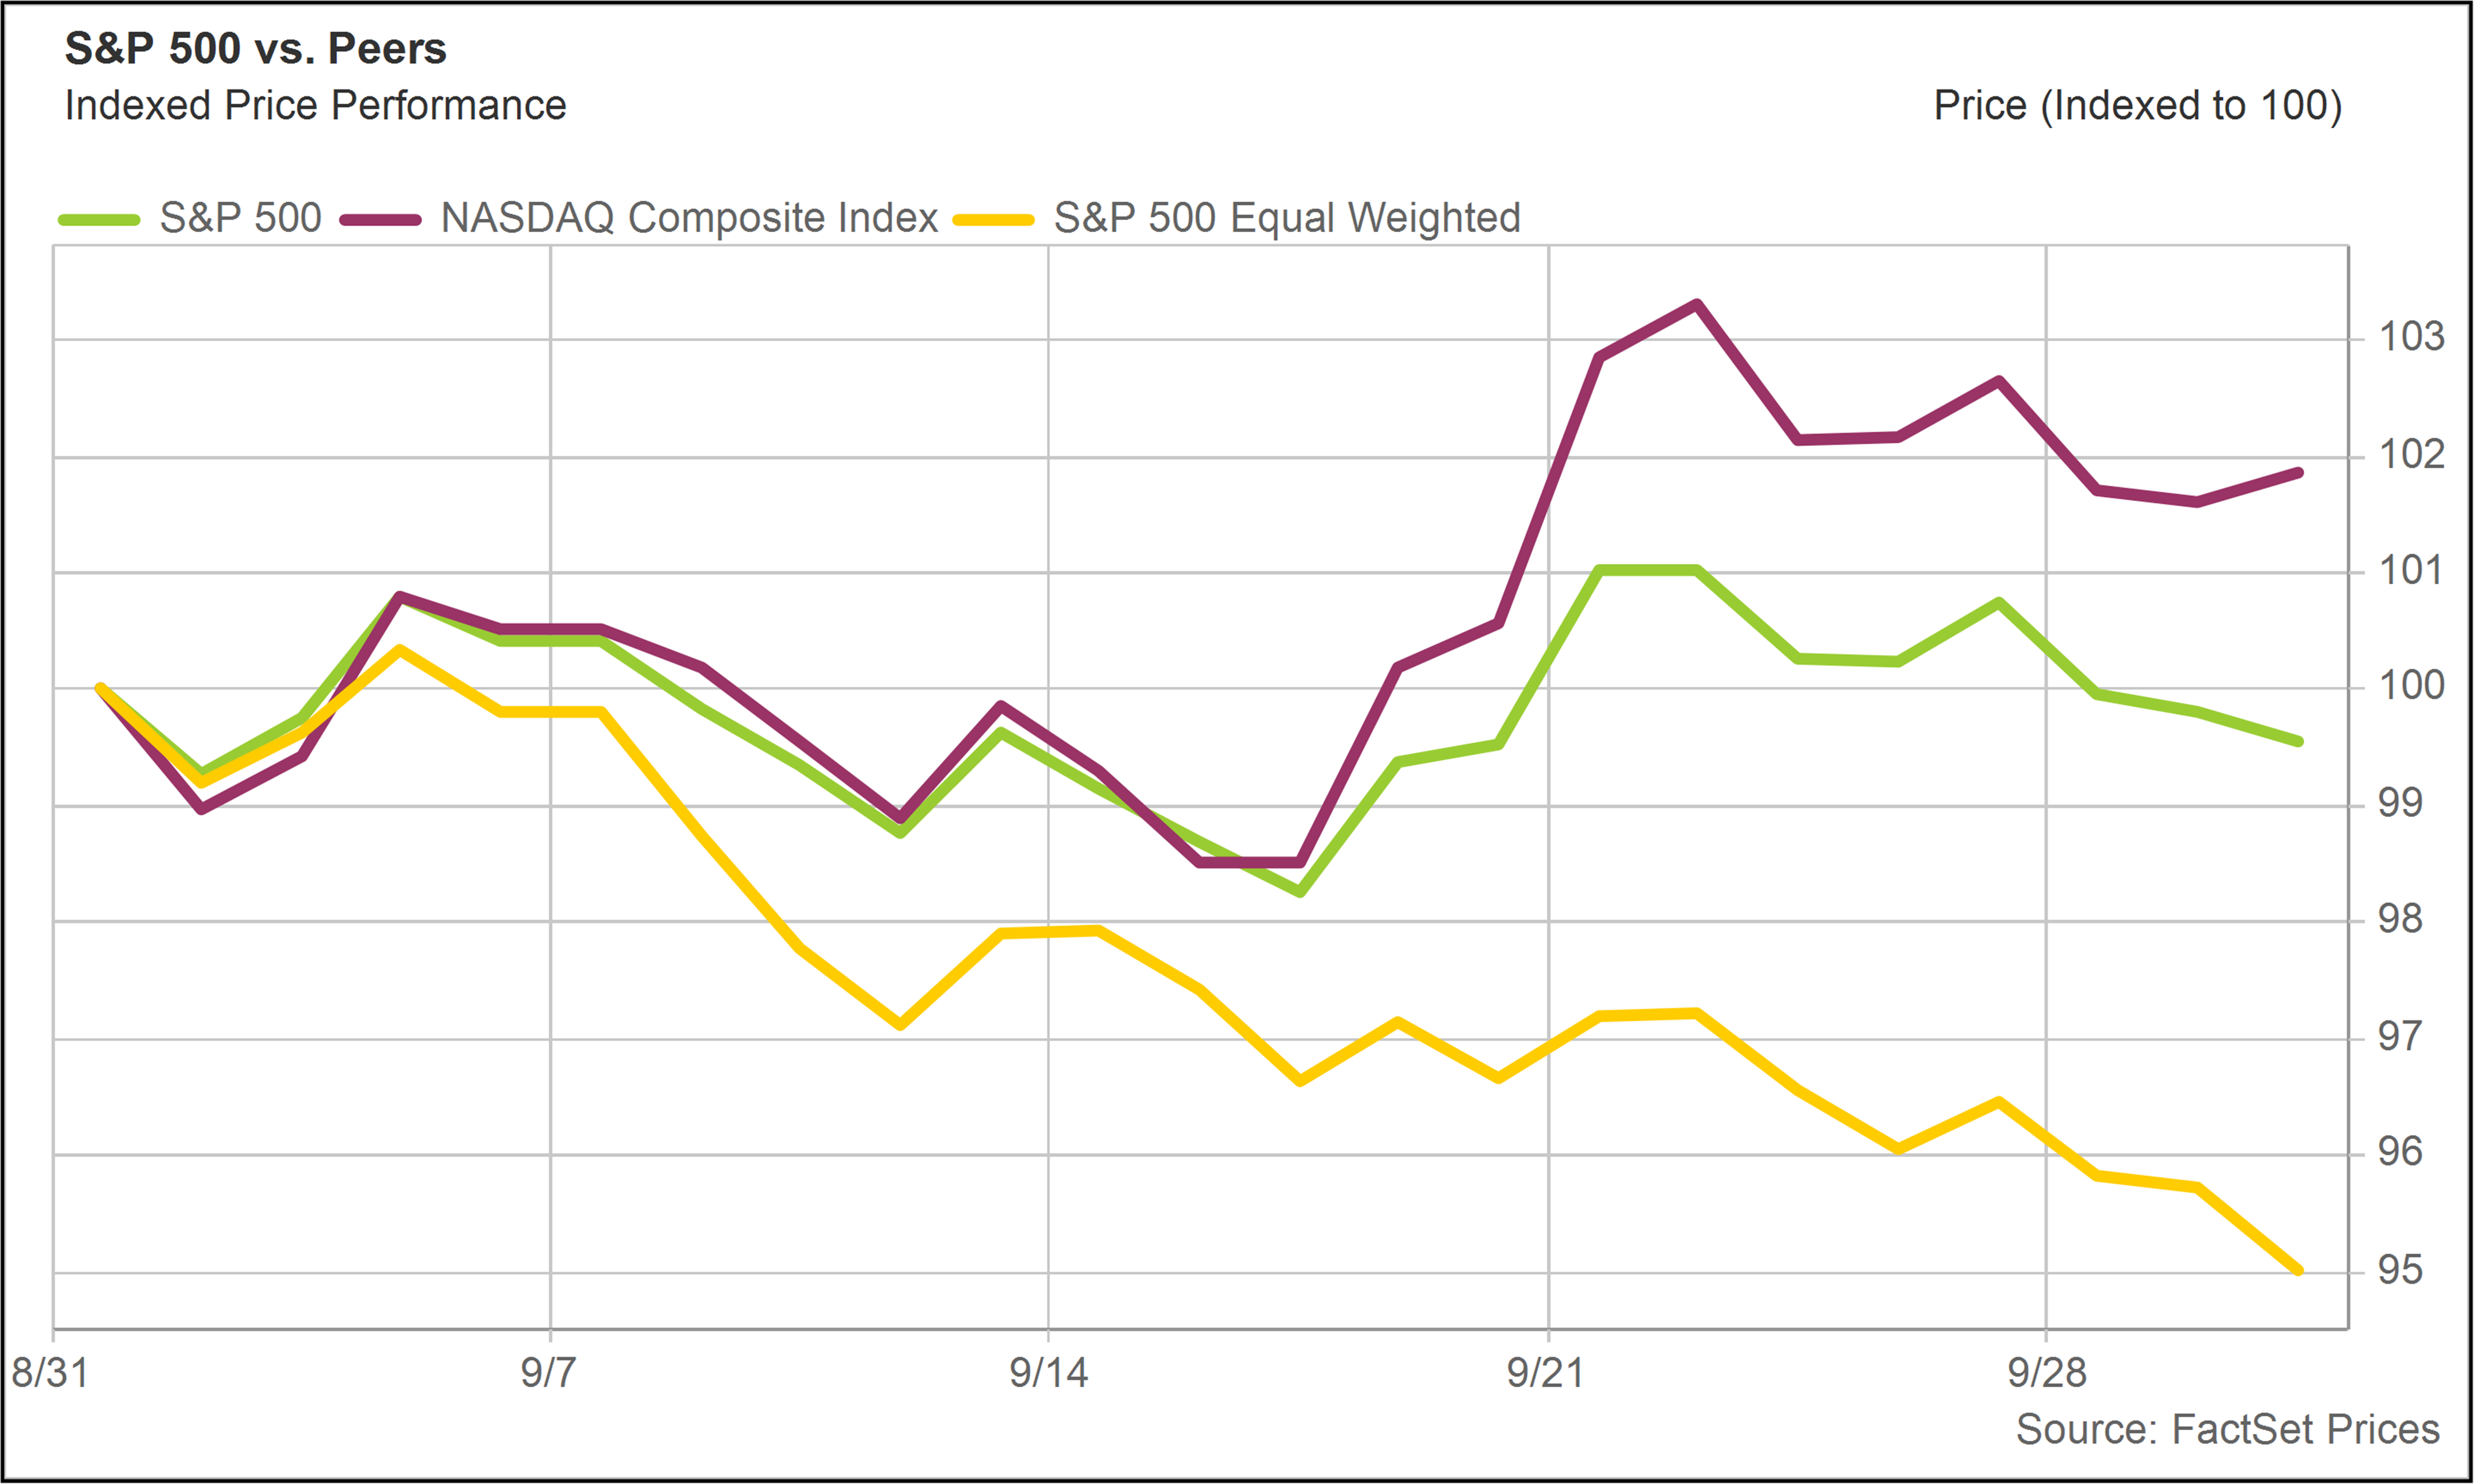
| | | September was a tale of two markets with AI-related Technology names performing well, while other areas suffered. The NASDAQ Composite advanced approximately 1.9%, but the S&P 500 Equal Weight Index declined 4.8%, highlighting the weakness experienced by the typical stock. The sharp increase in both short- and long-term interest rates pressured stocks, especially dividend-oriented sectors like Utilities, REITs, Financials and Infrastructure. The Income Builder portfolio consequently came under pressure during the month, declining 7.3%, with notable weakness in more rate-sensitive holdings. Texas Instruments (TXN) led performance, while Strategy 8% Perpetual Preferred (STRK) shares benefited from balance sheet improvement and a proposed shift to daily dividends. We view September’s weakness as a valuation and sentiment event, not a signal of deteriorating fundamentals. The softer September employment report suggests the market may have become too pessimistic on rates. If long-term yields stabilize or decline, many of the portfolio’s higher-yielding holdings could see meaningful valuation recovery.
|
|
| | |
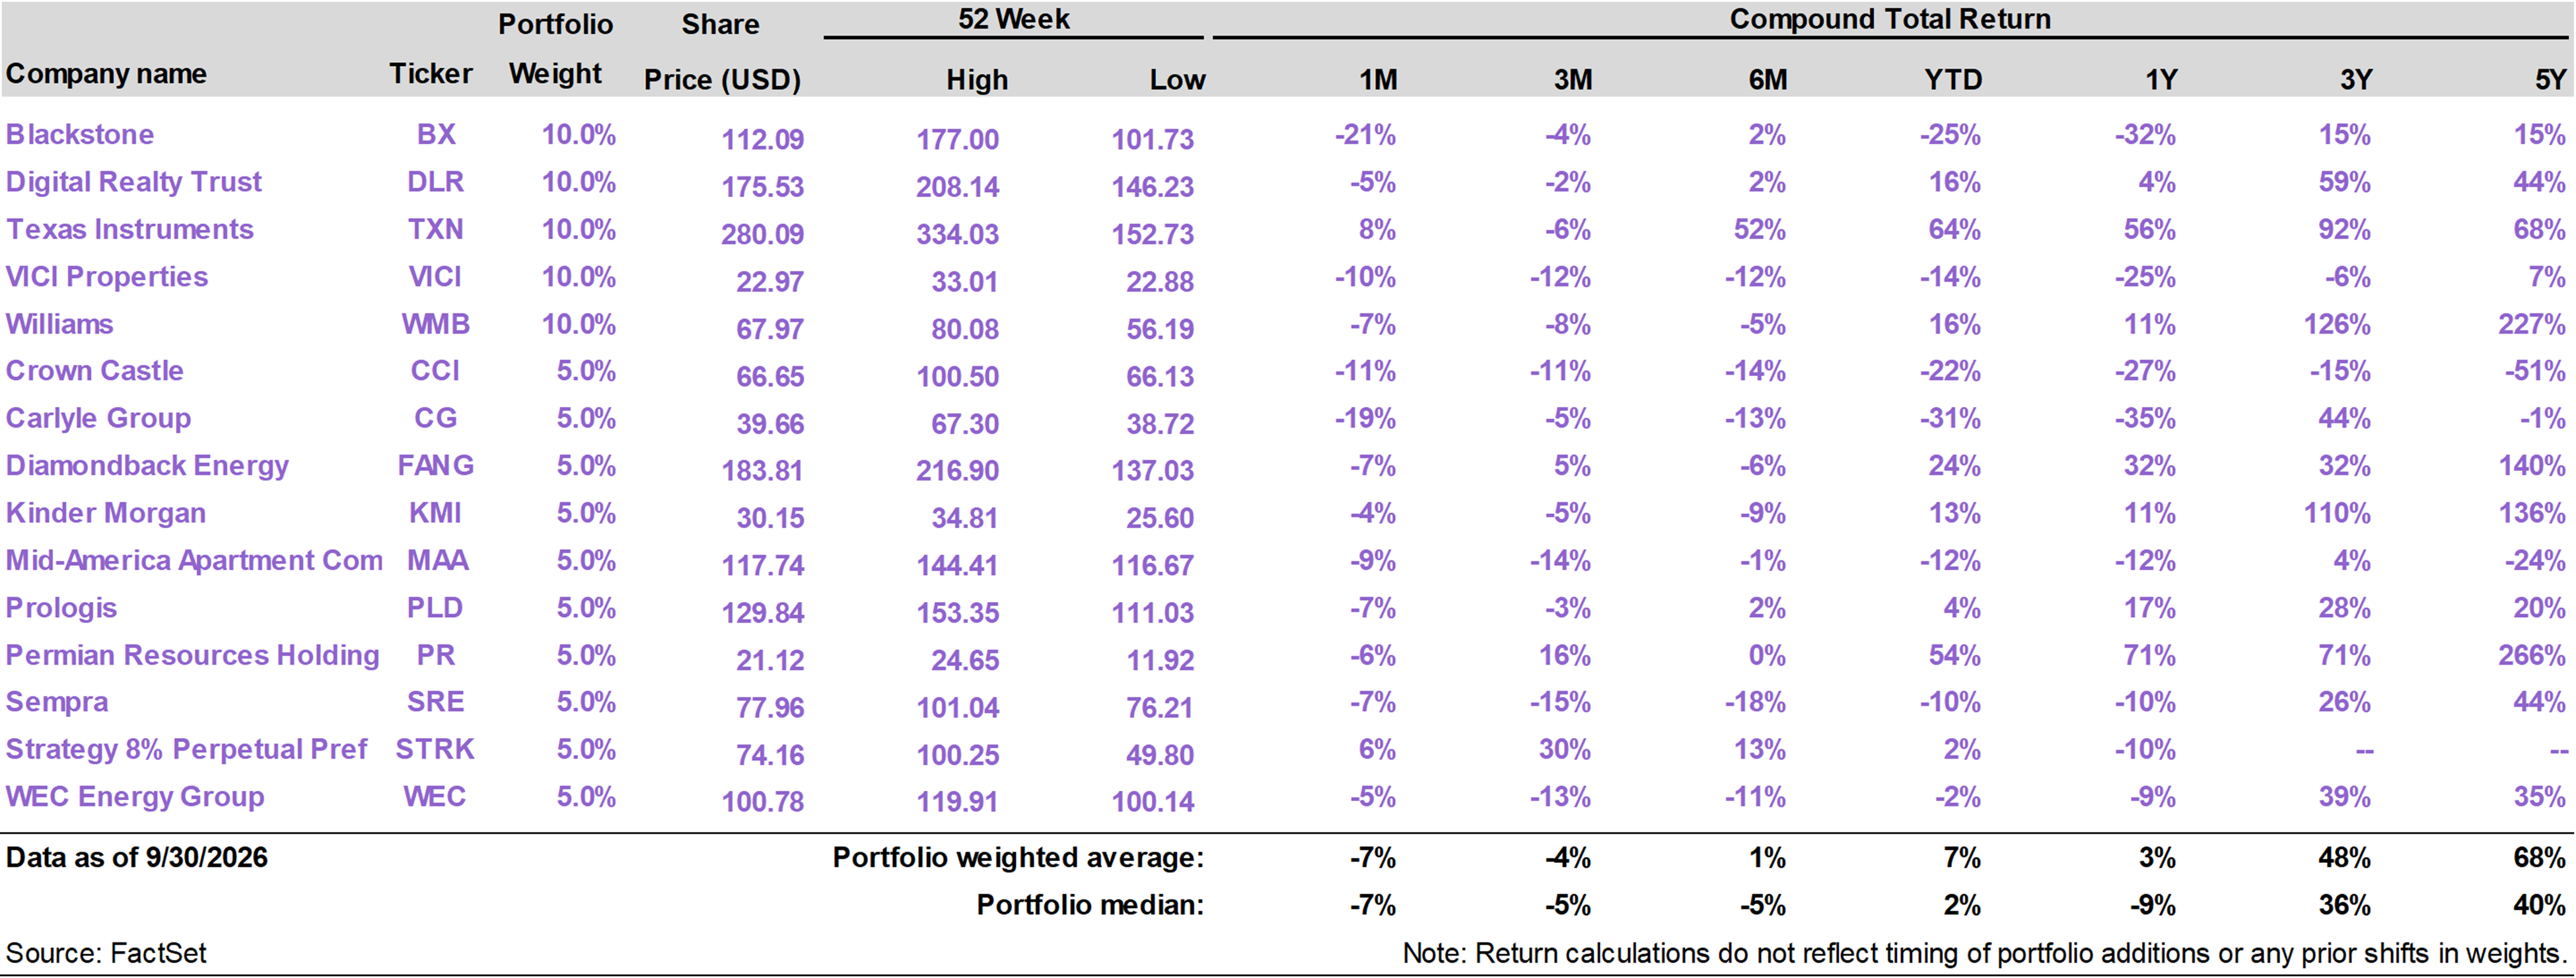
The Income Builder portfolio generated a total return of -7.3% in September, versus the S&P 500 Index return of -0.4%. On a year to date basis through the end of the month, the portfolio has returned 6.2%, versus the 12.7% return of the S&P 500.
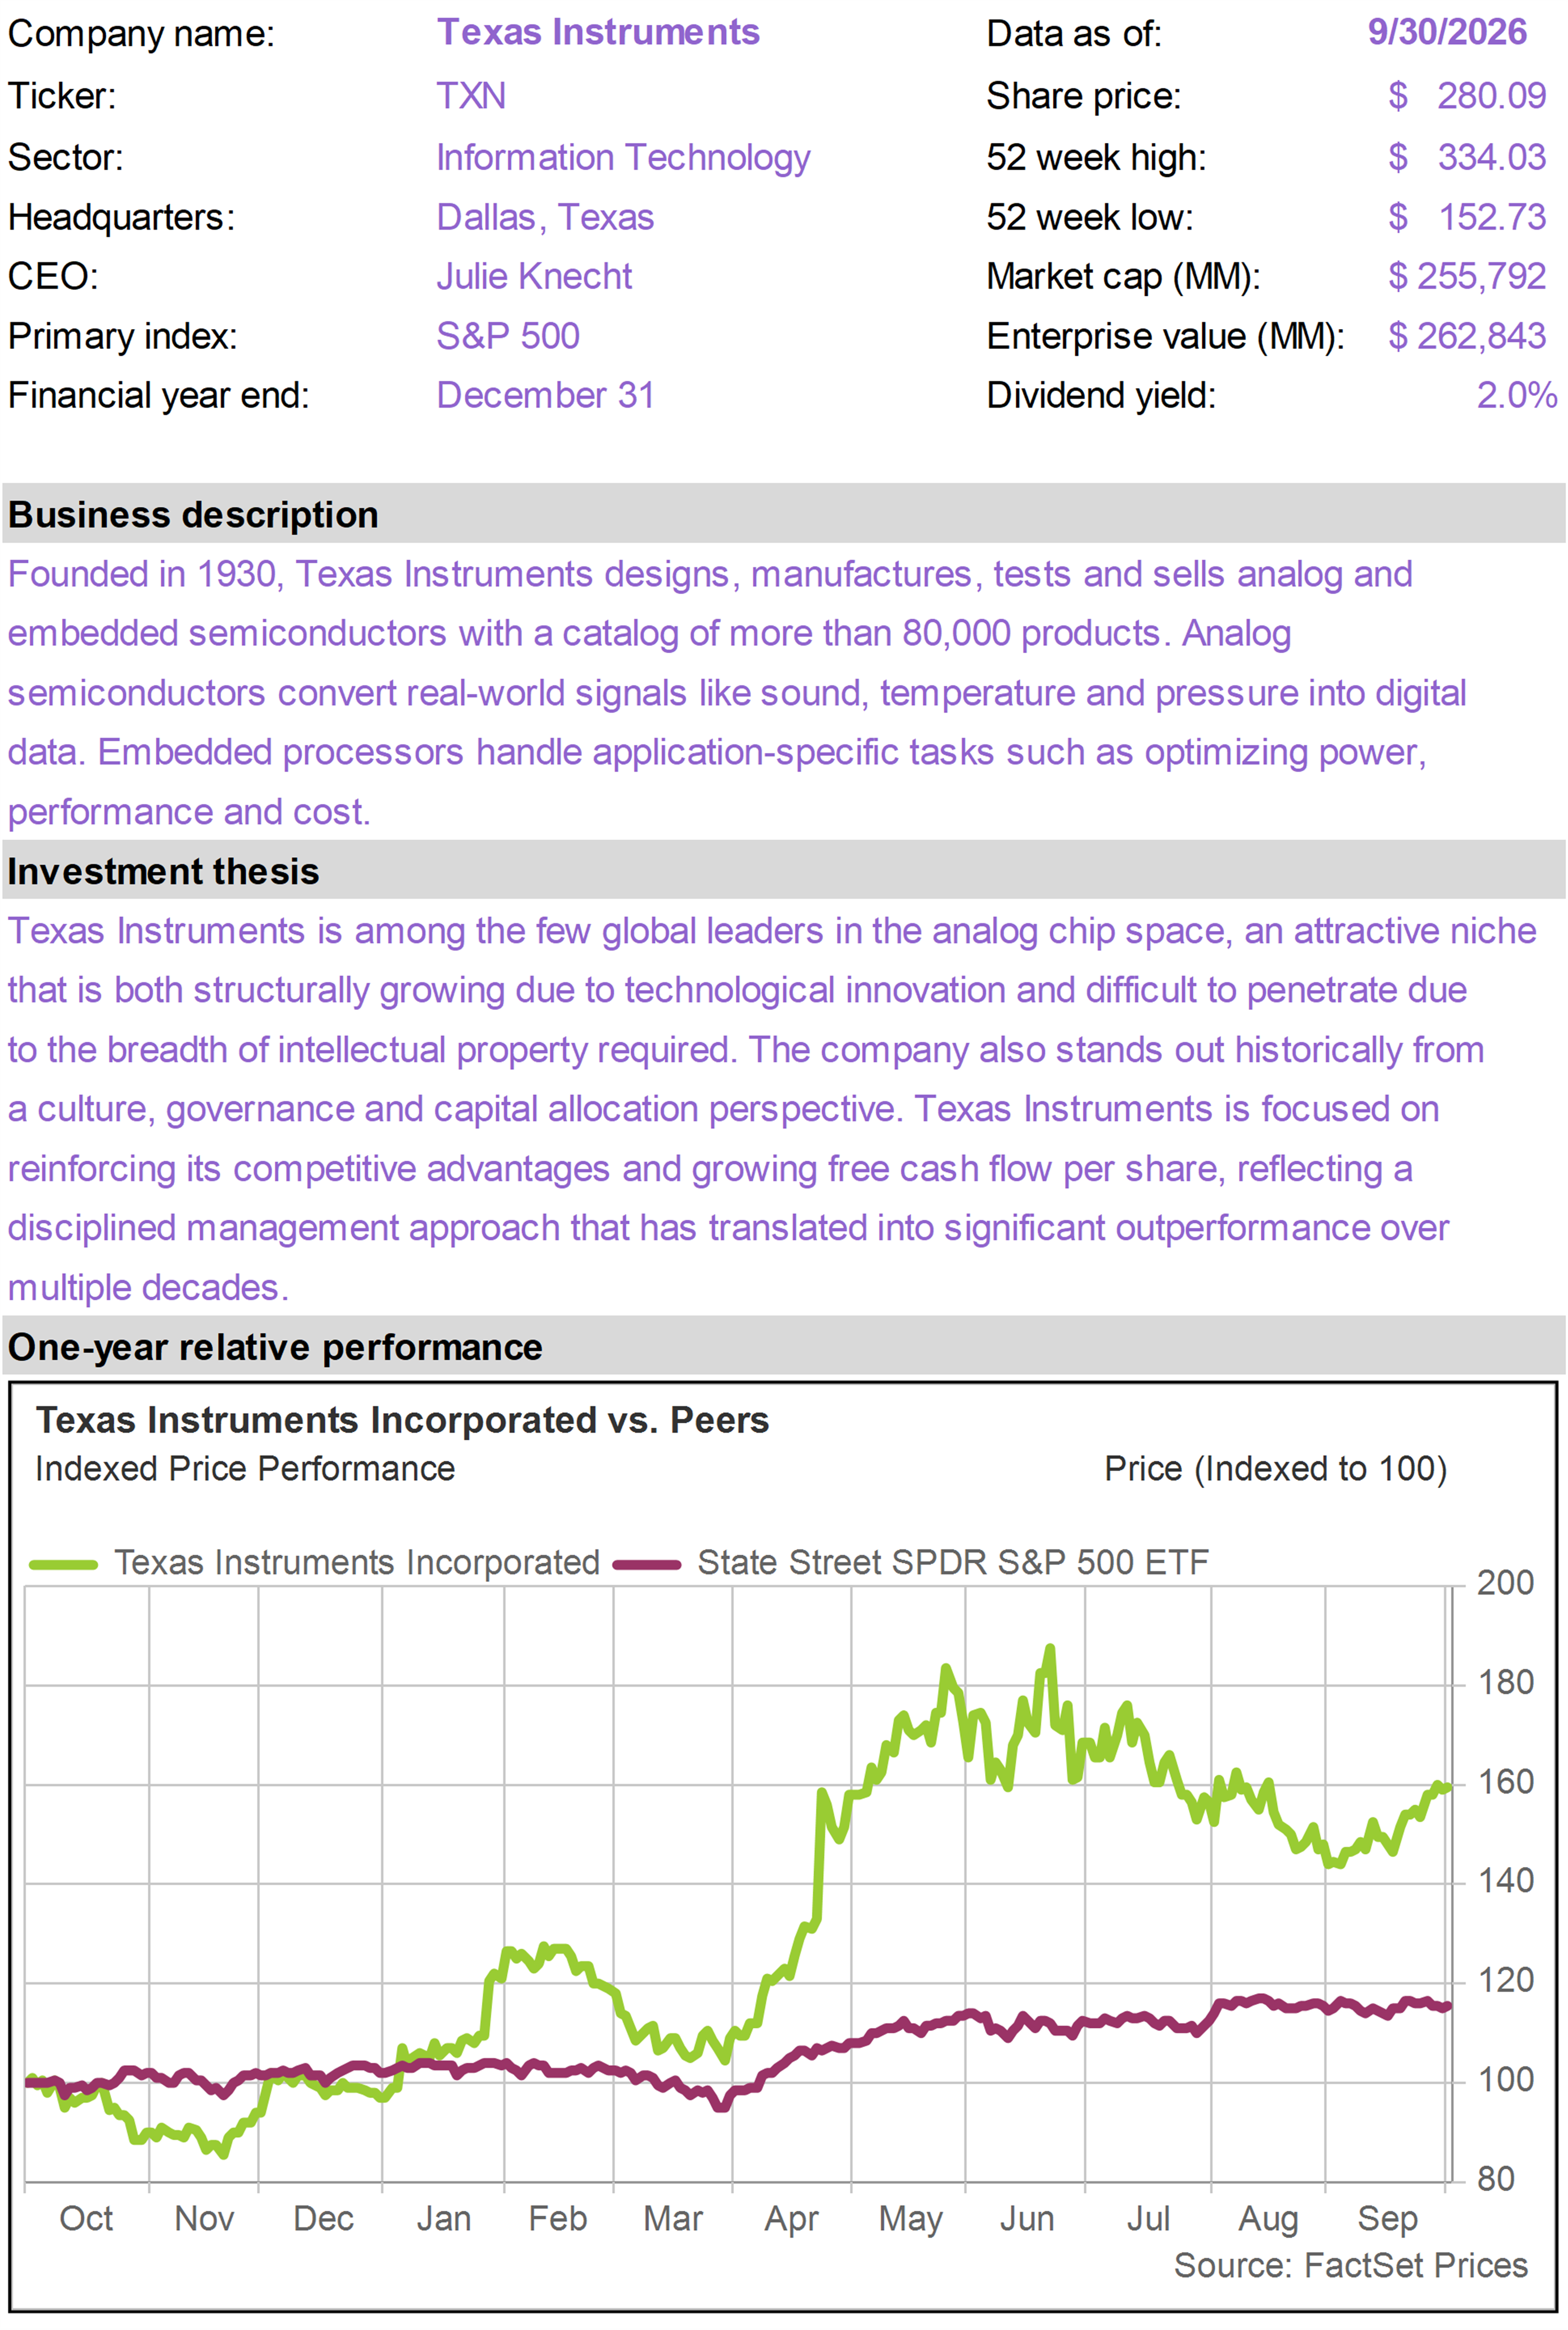
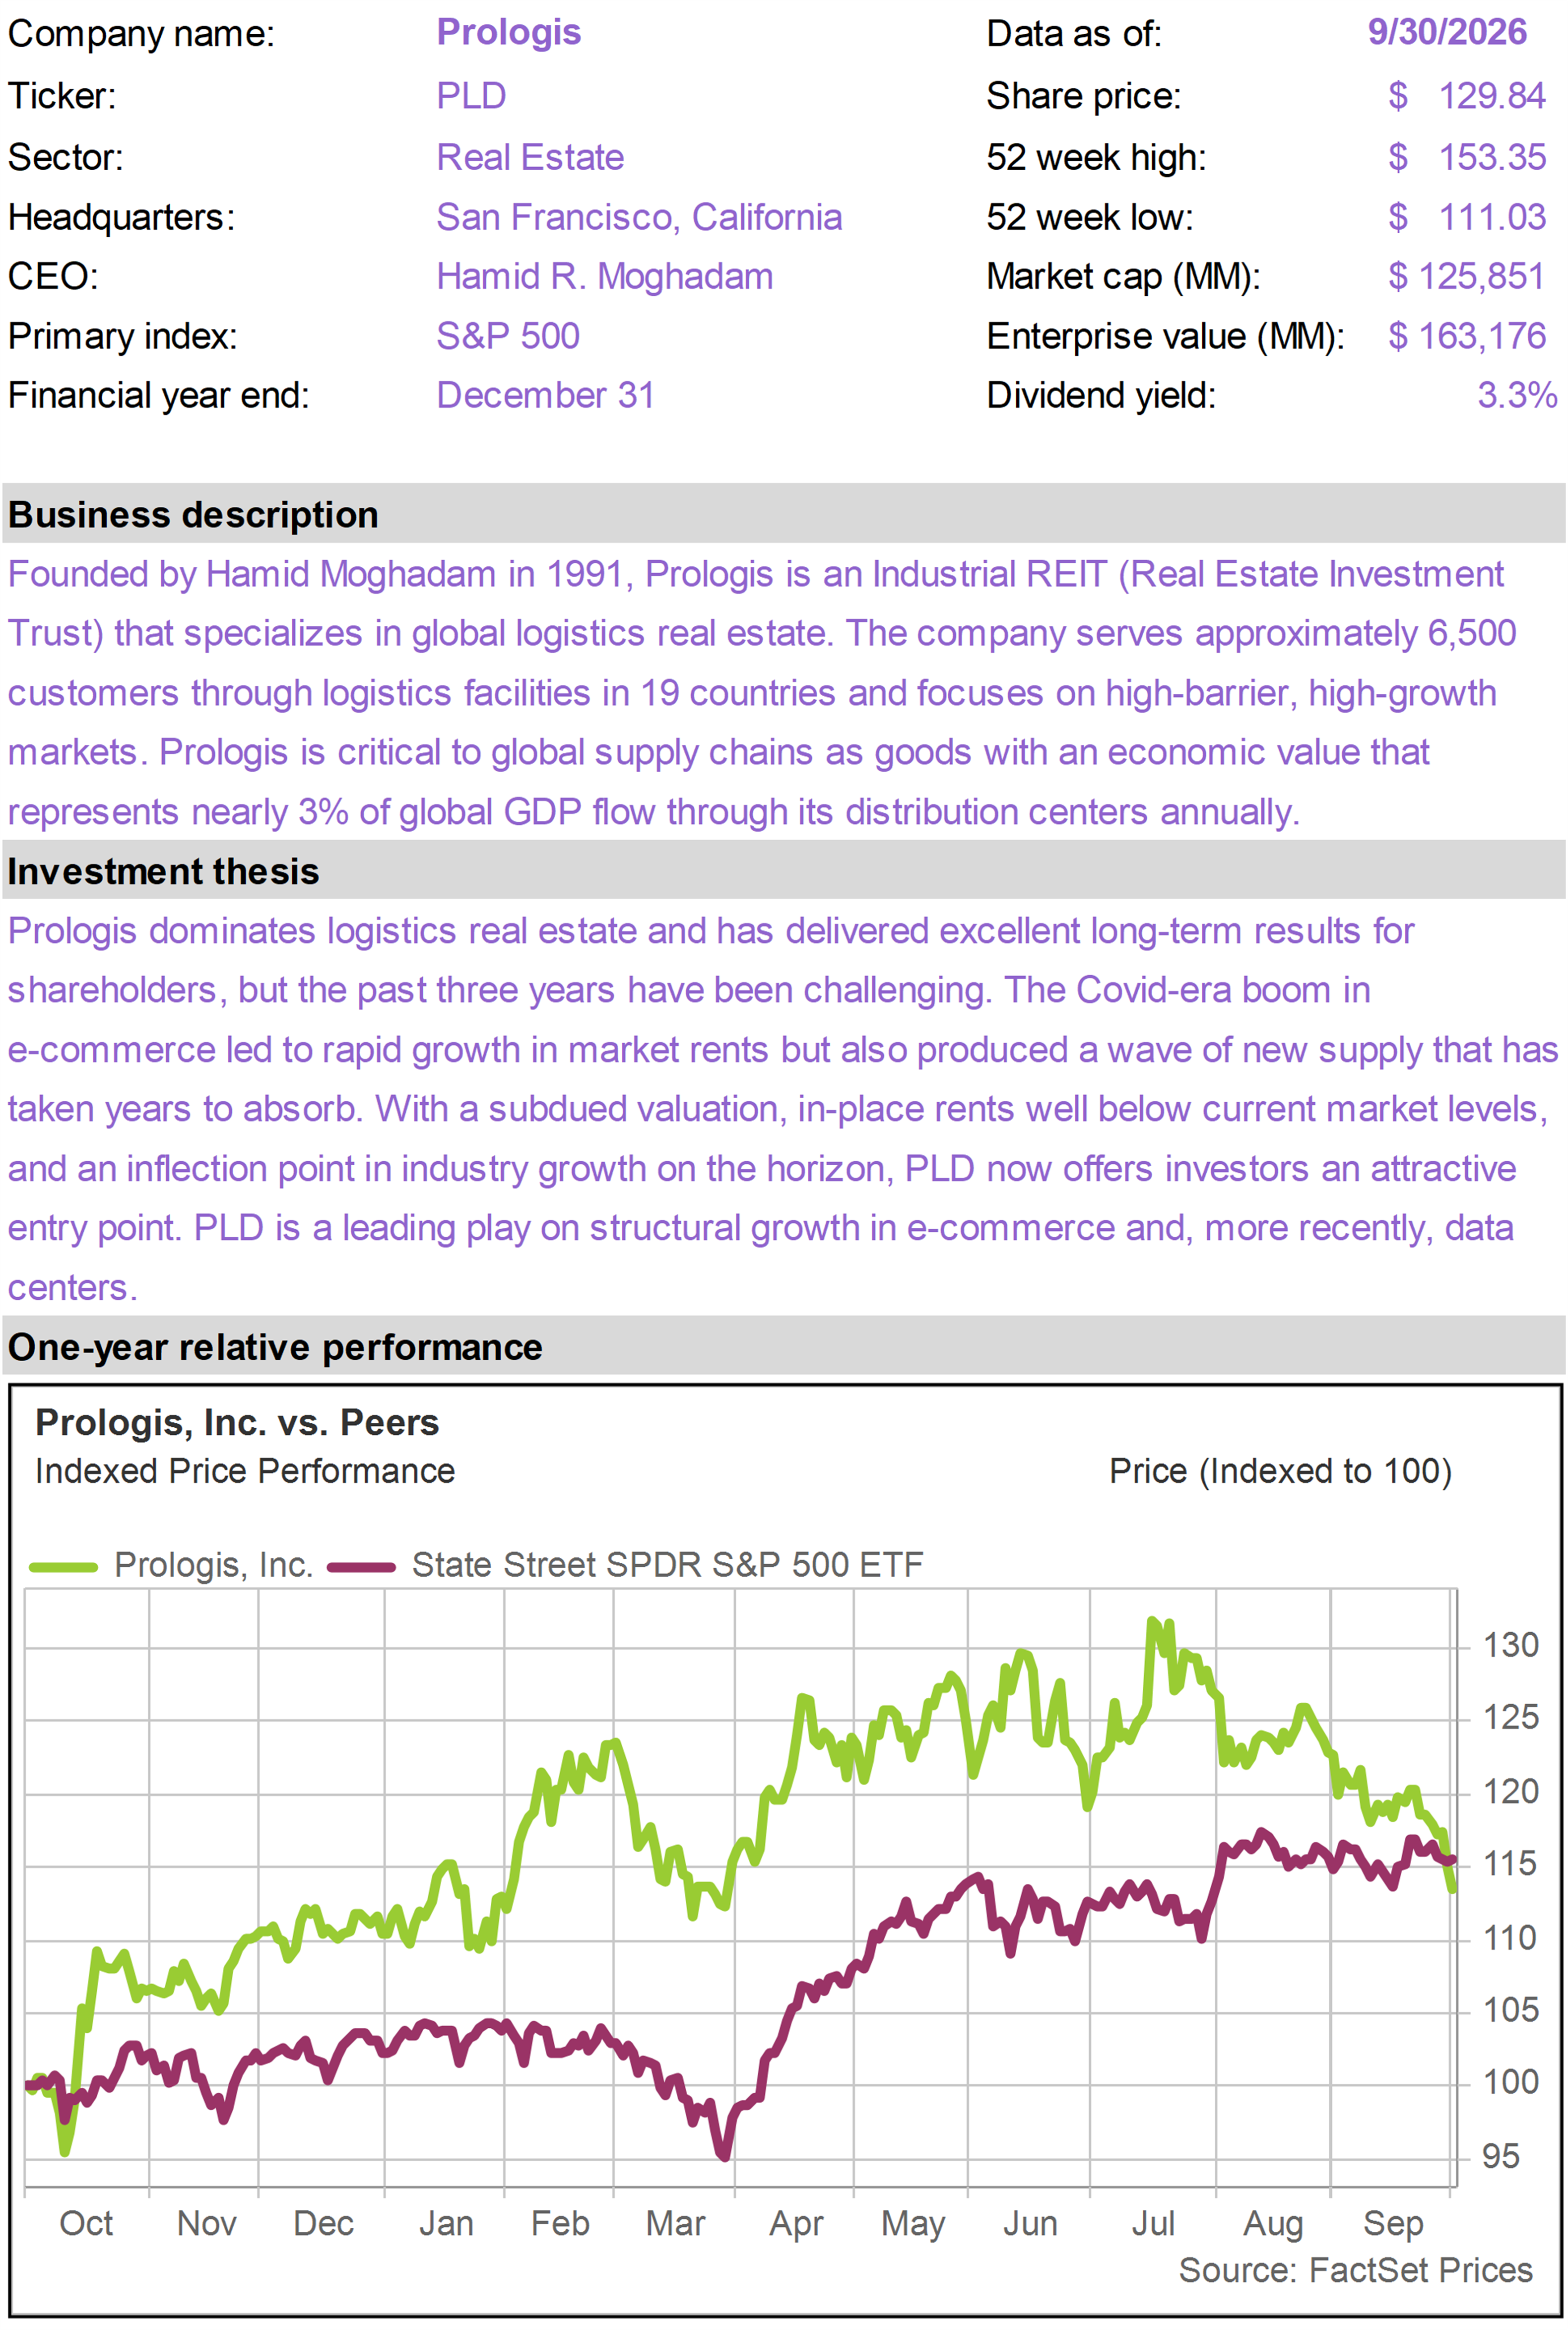
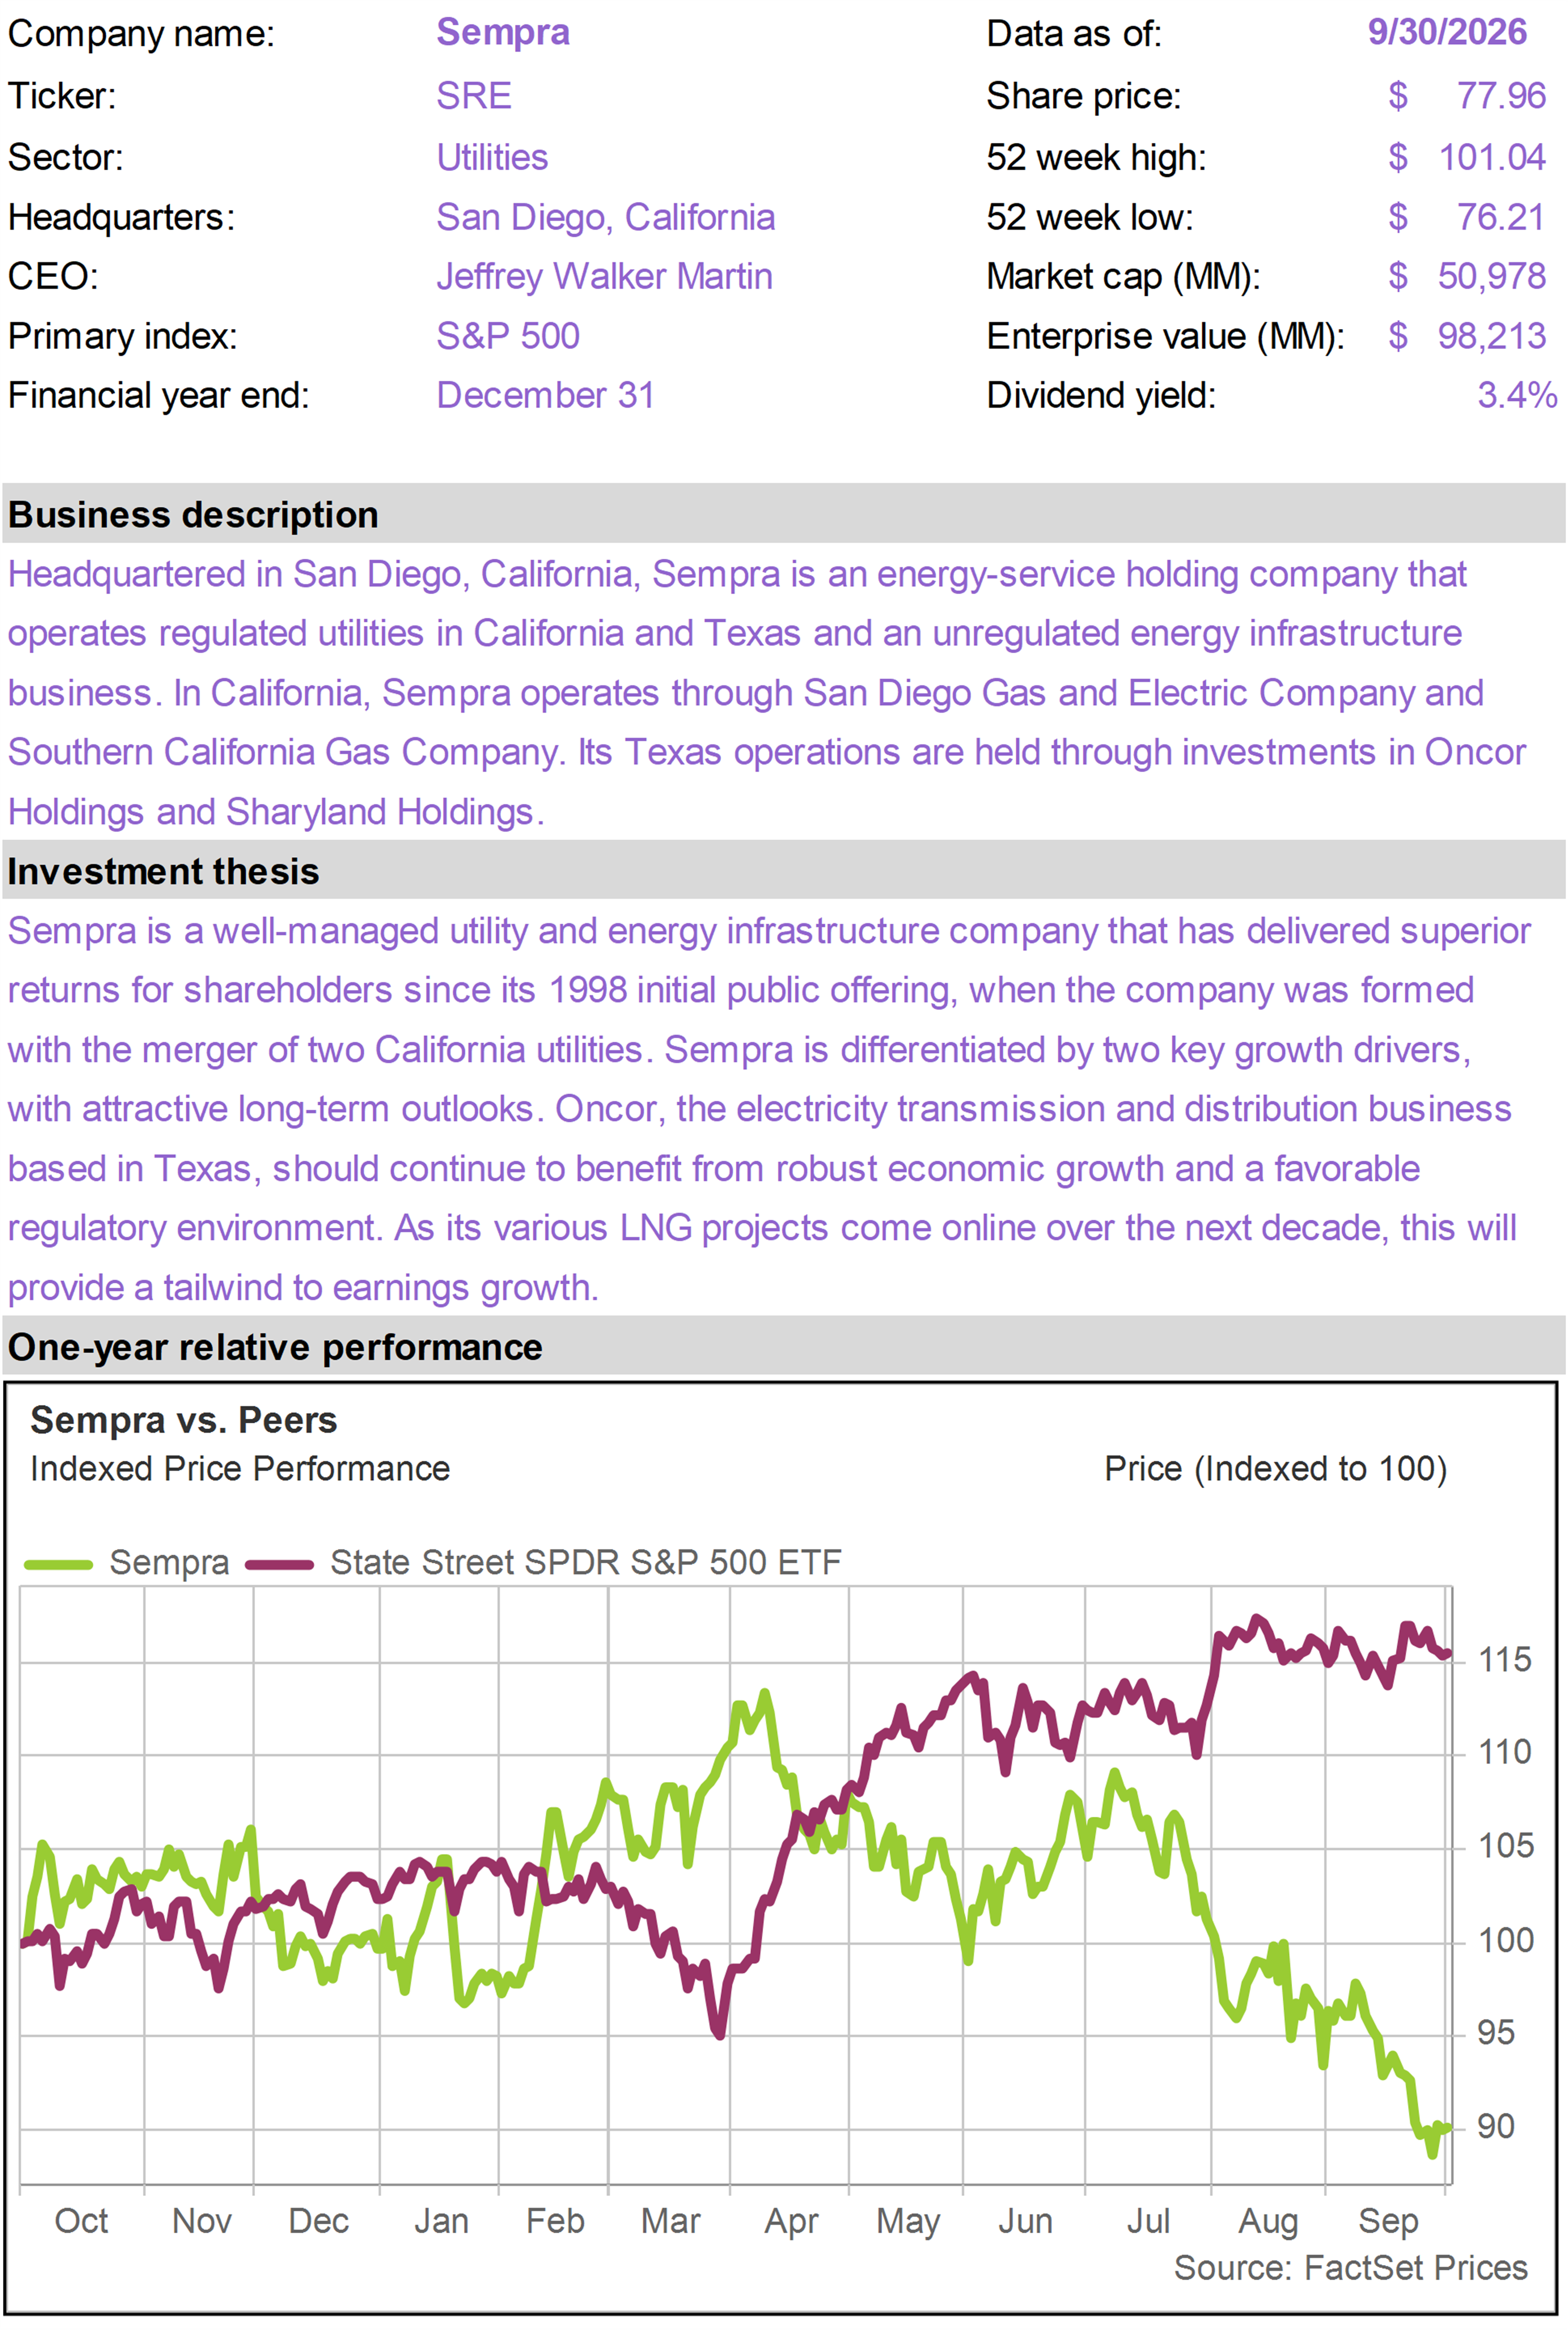
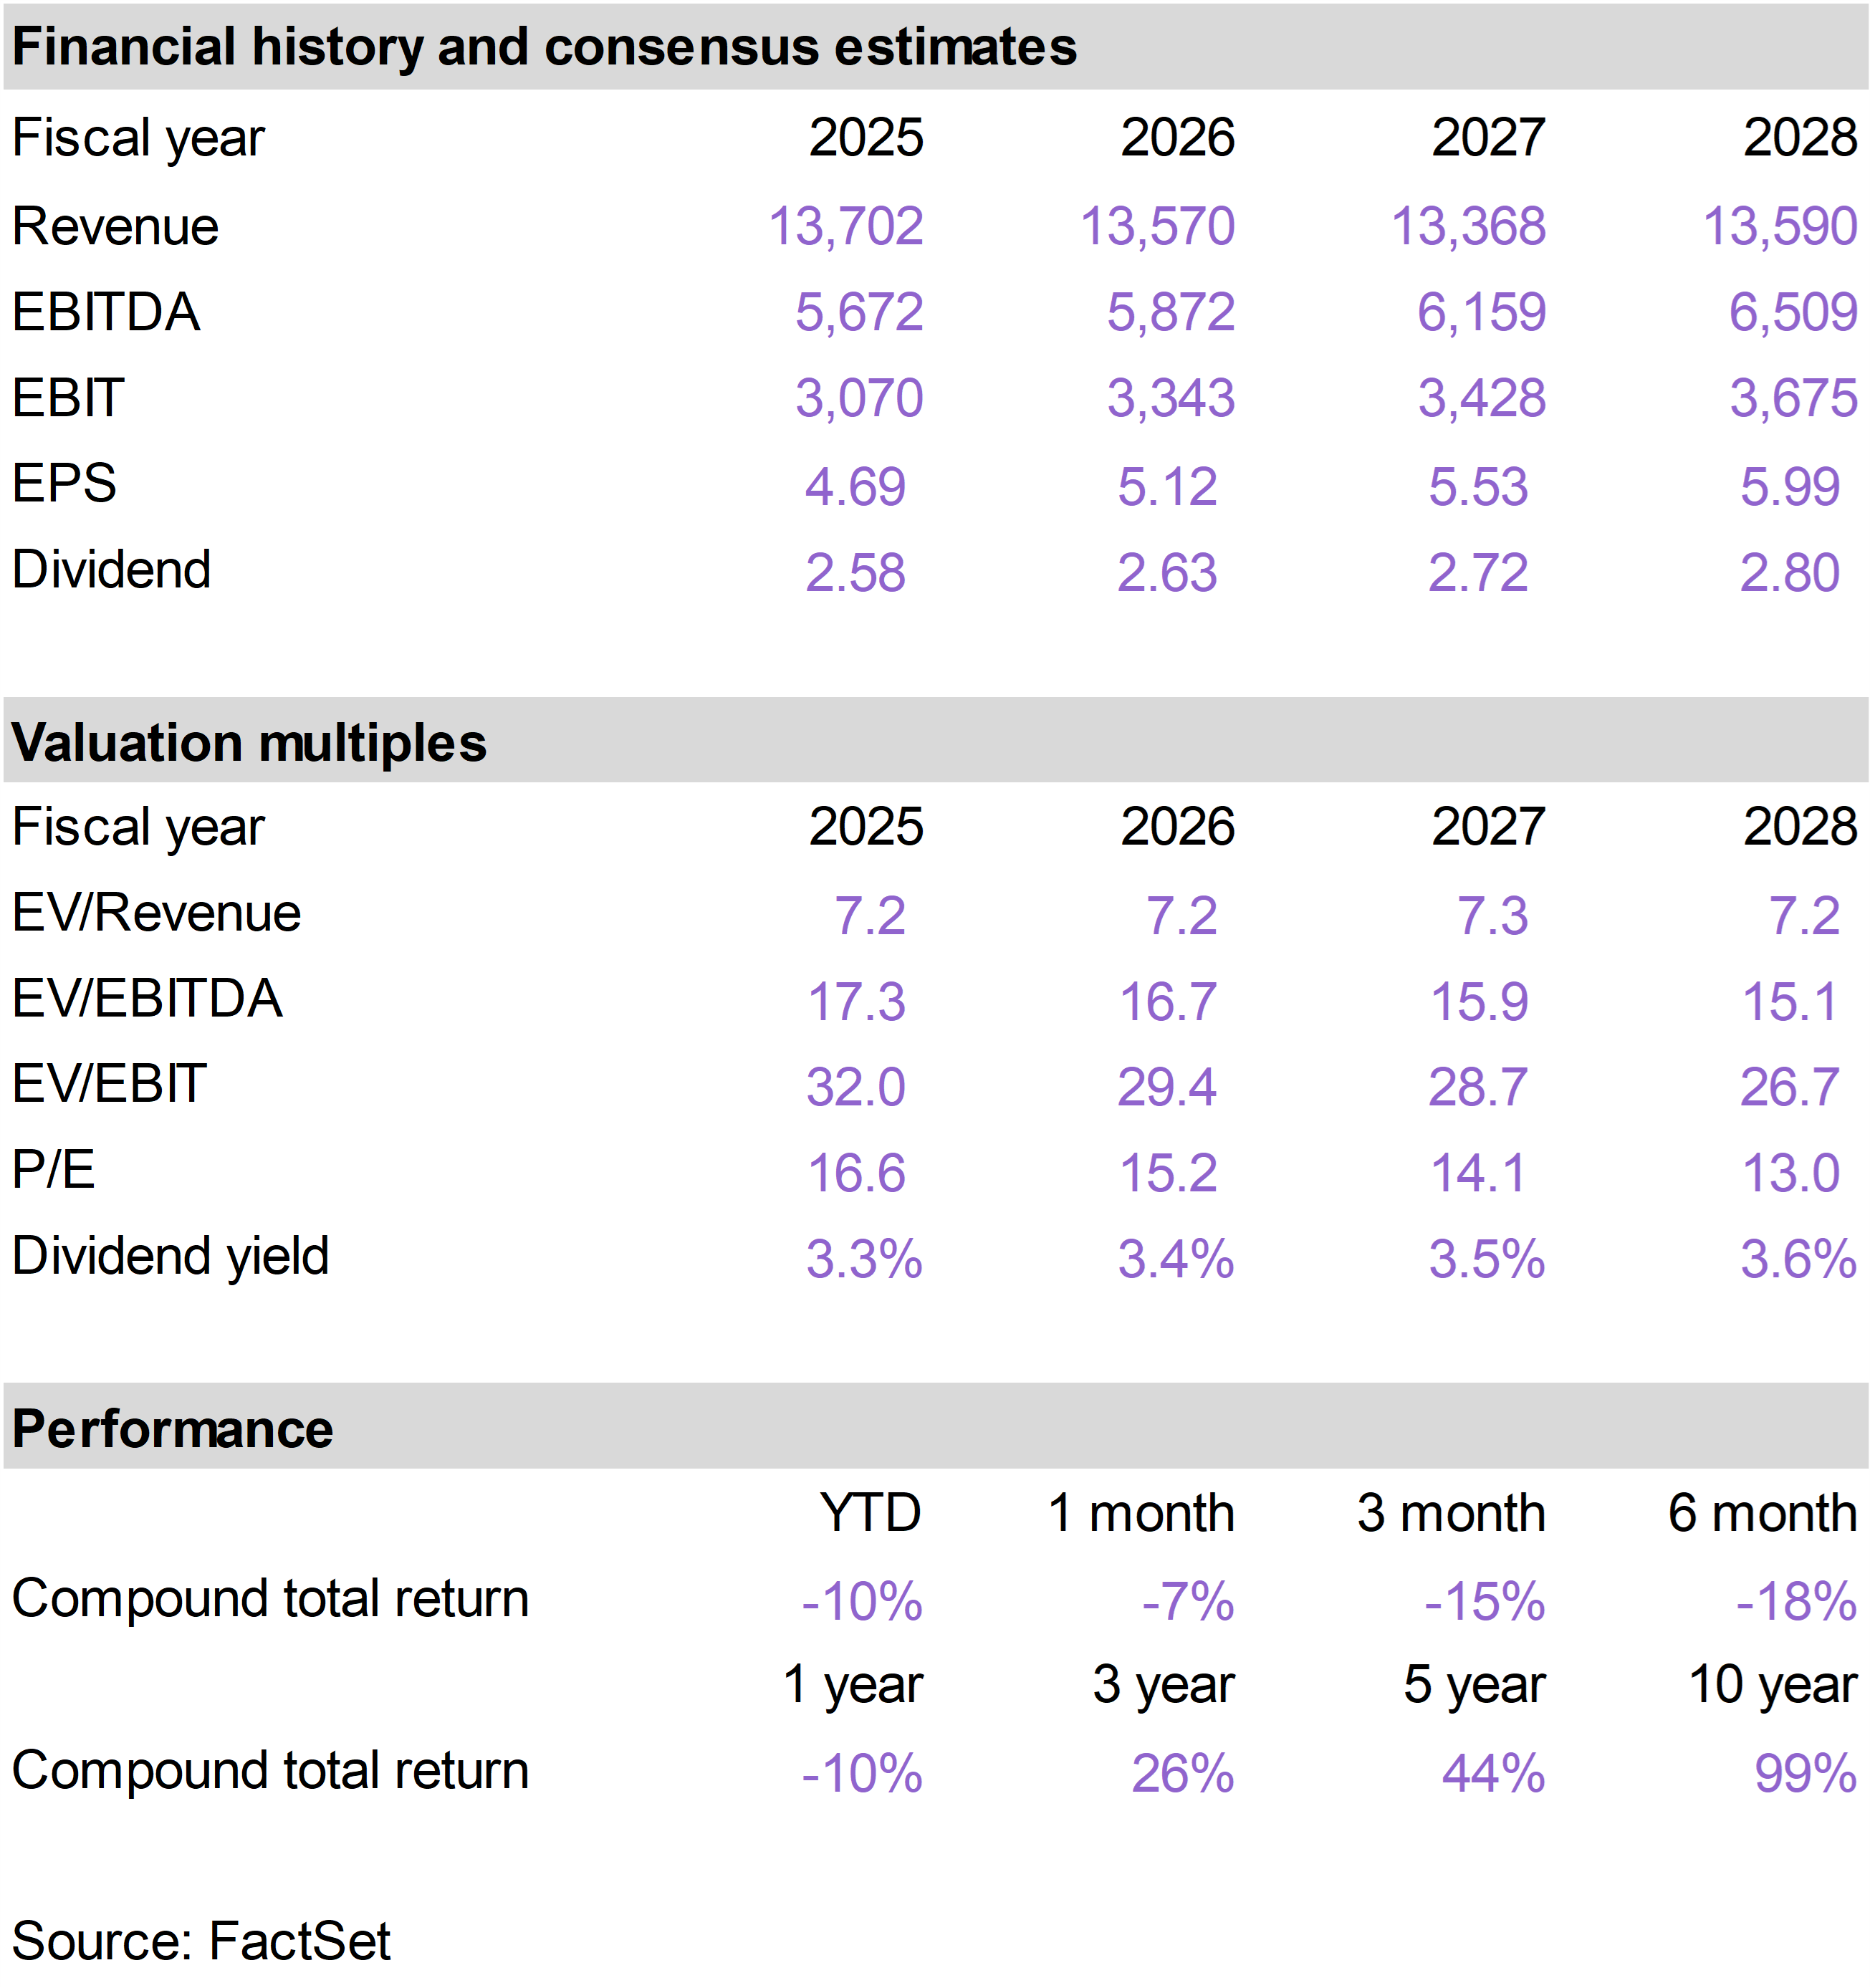
The top performing positions in the portfolio in September were Texas Instruments (TXN), which returned 7%; Strategy 8% Perpetual Preferred (STRK), which returned 5%; and Sempra (SRE), which returned -4%.
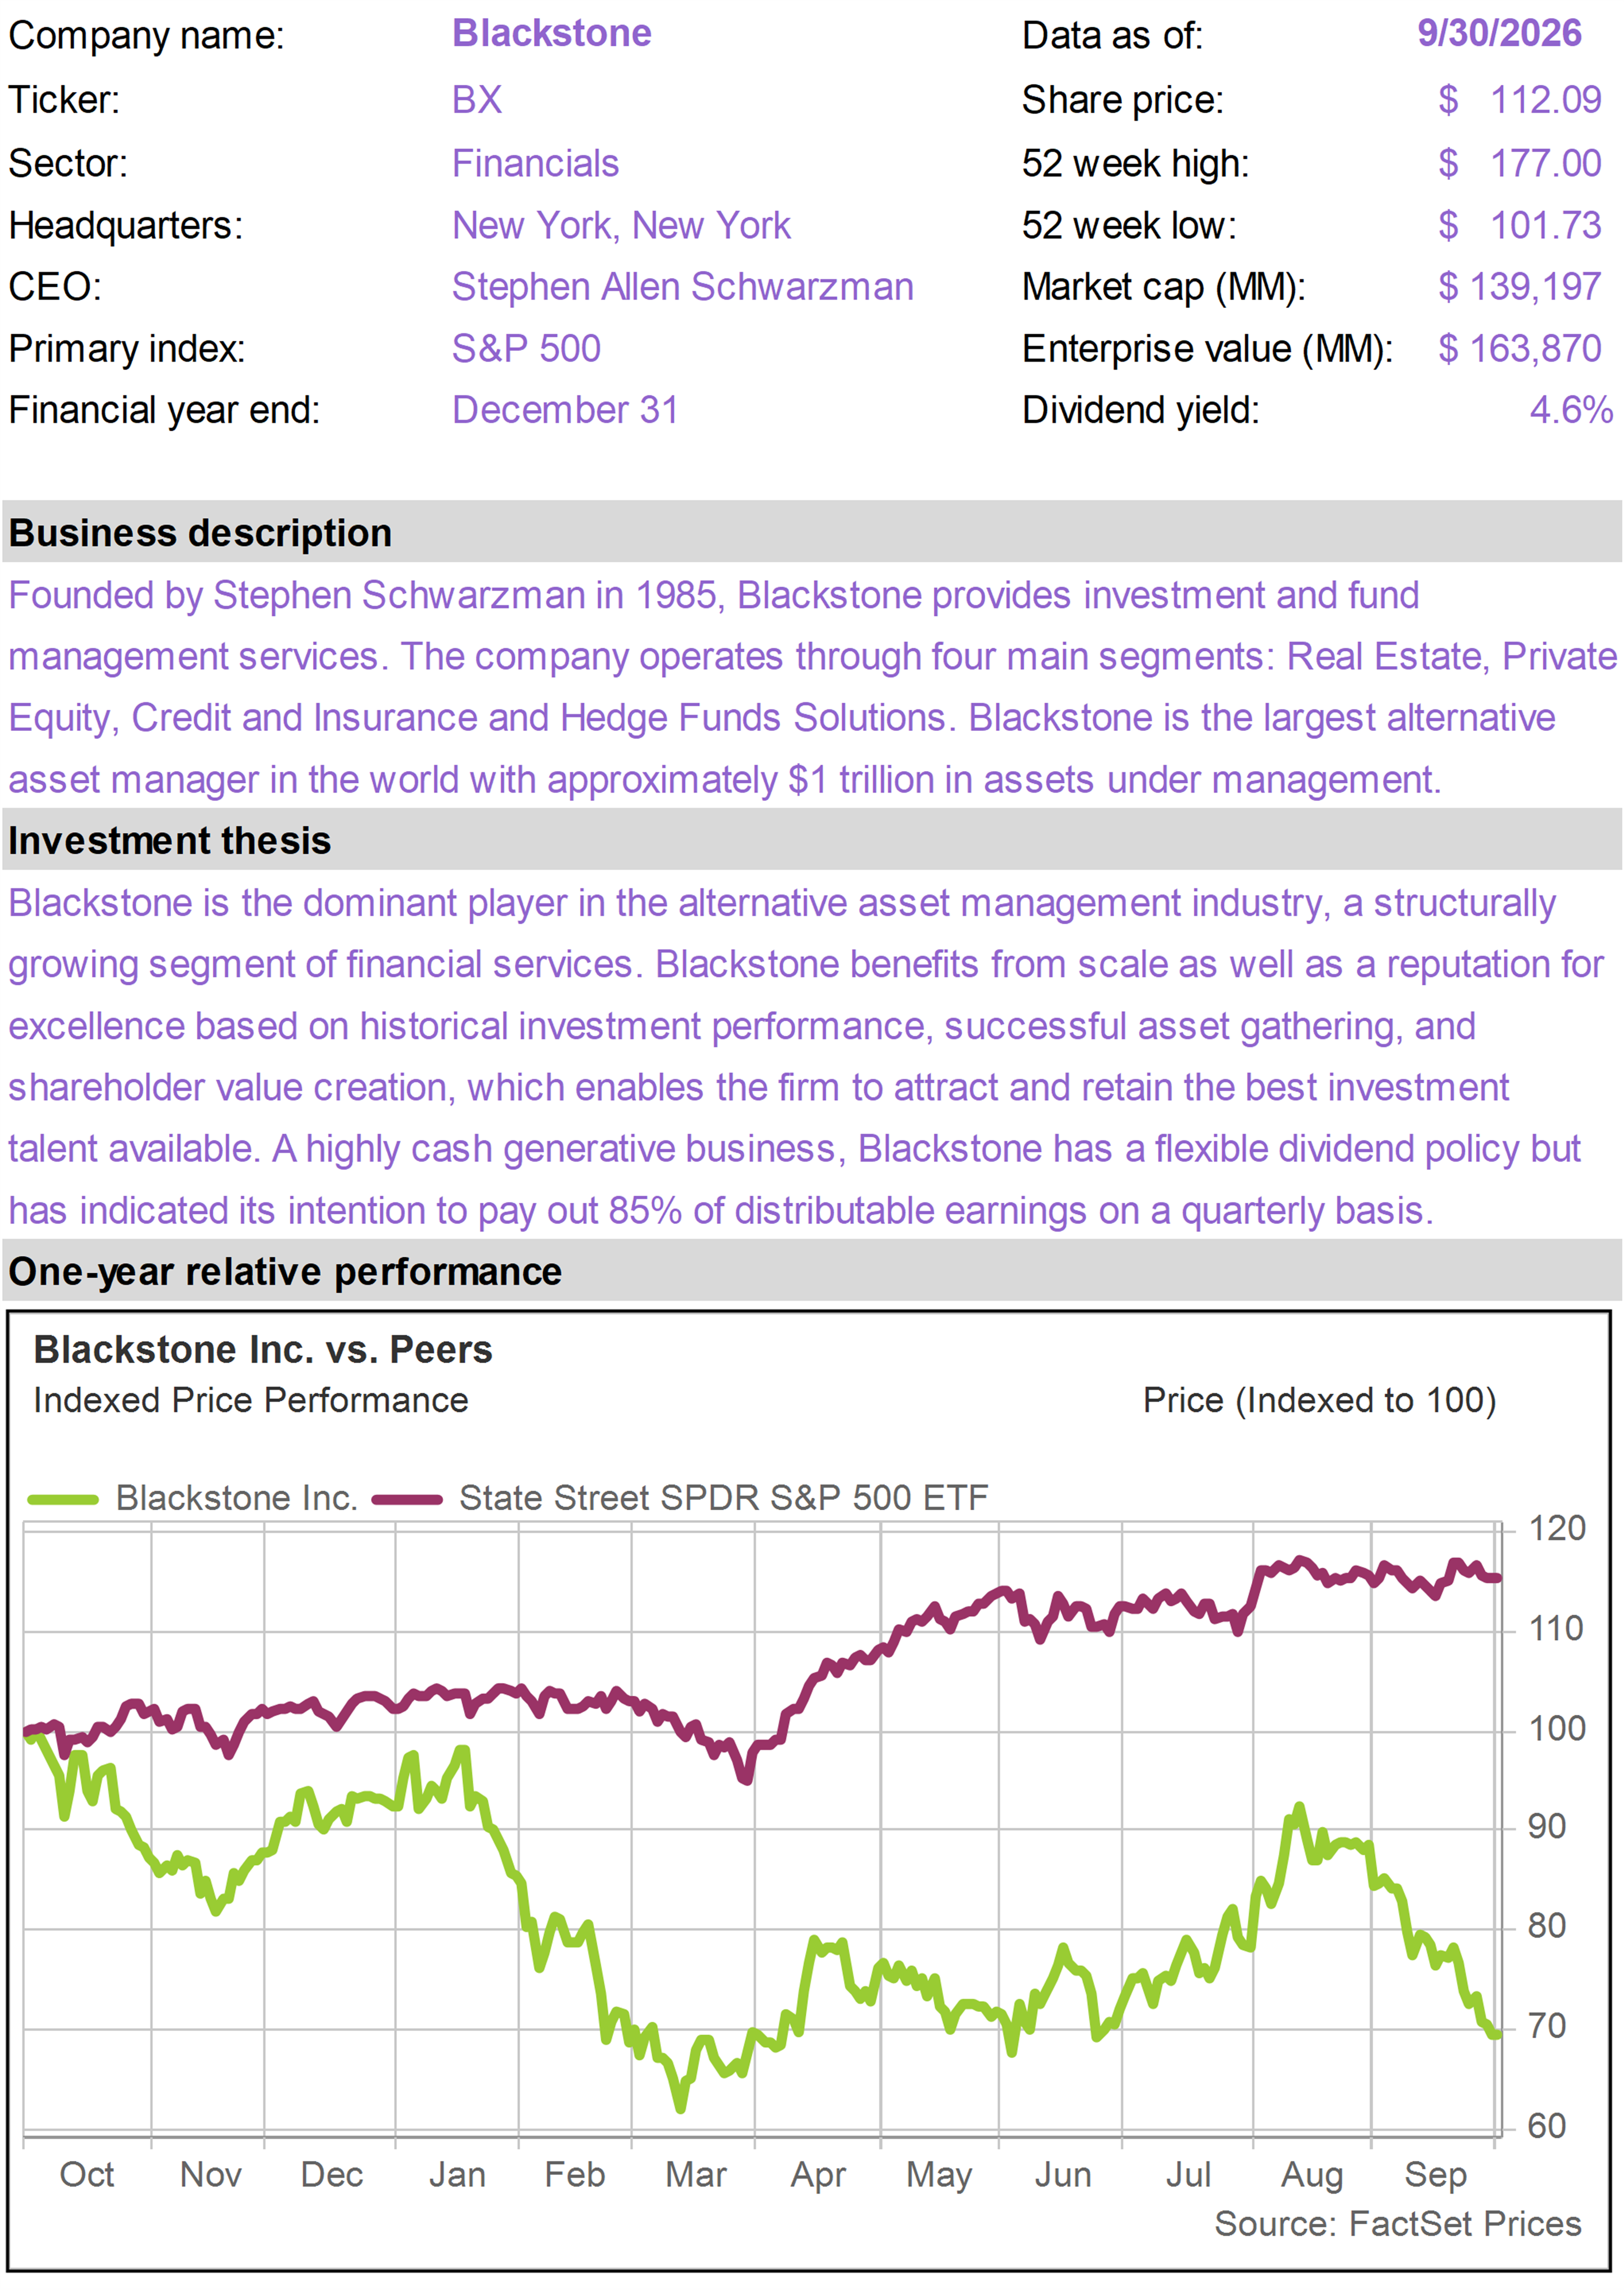
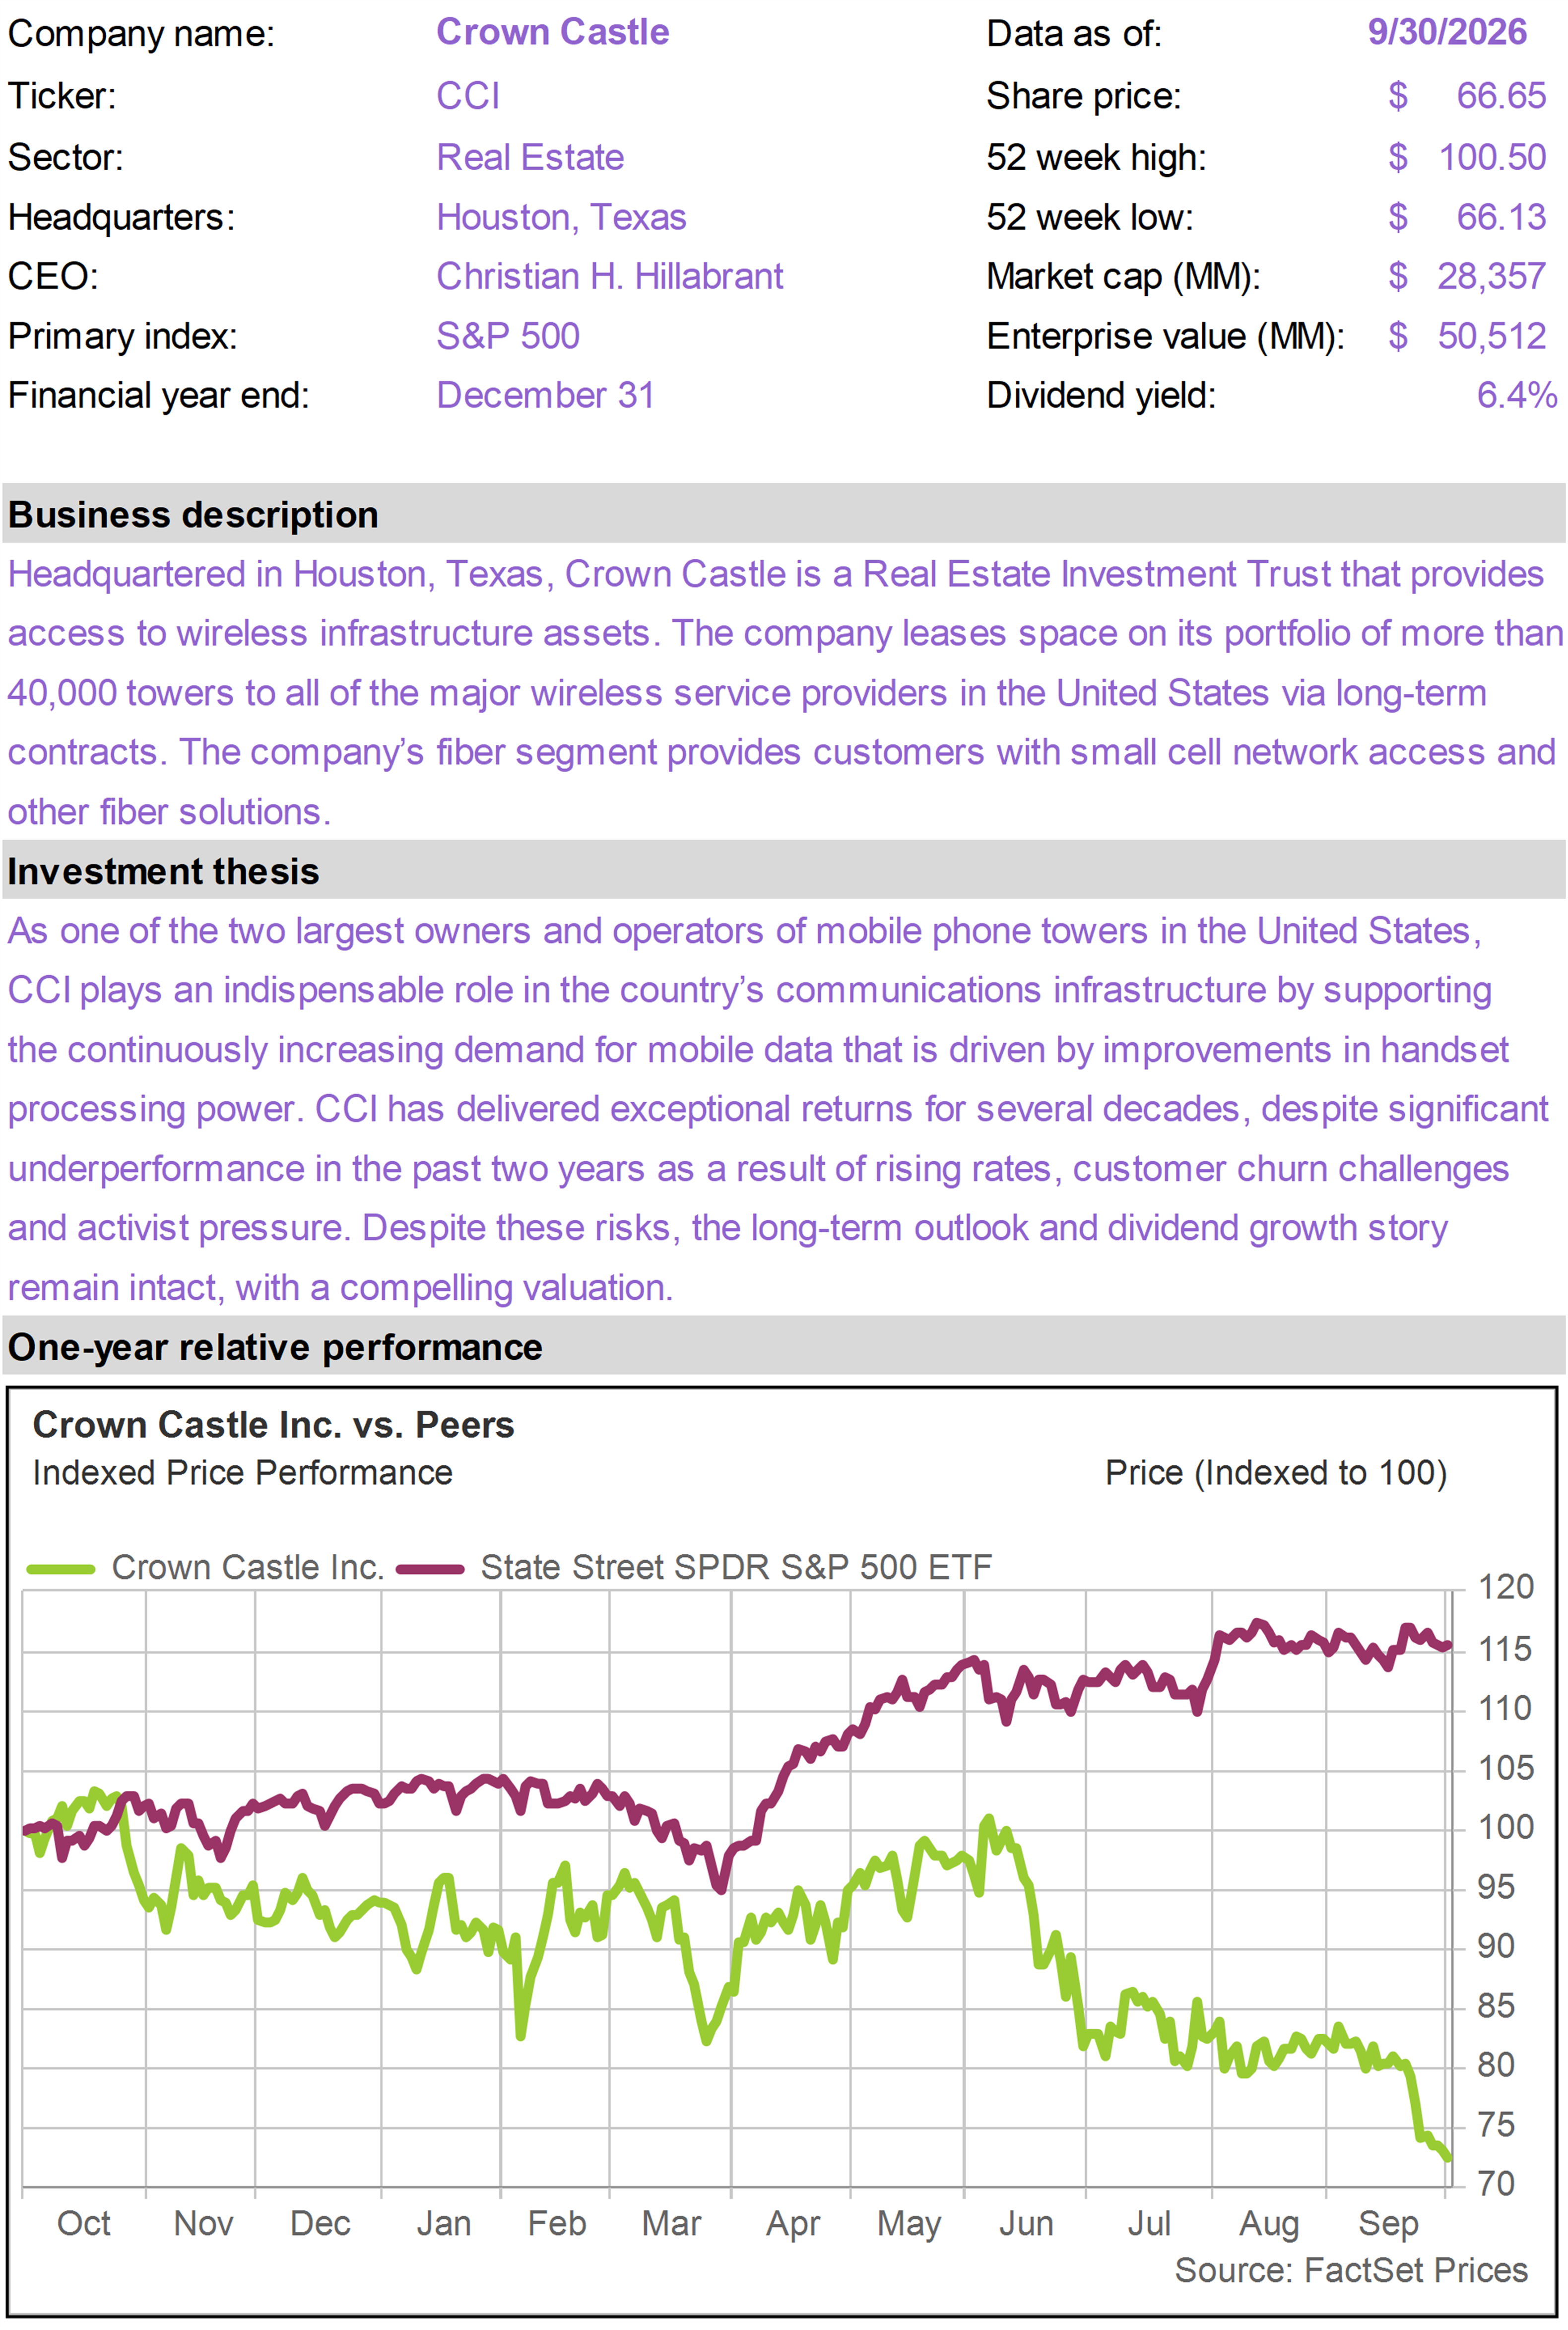
The worst performing positions in the portfolio this month were Blackstone (BX), which returned -22%; Carlyle Group (CG), which returned -18%; and Crown Castle (CCI), which returned -11%. |
|
|
A tale of two markets
September was an unusually divided month for financial markets.
The S&P 500 finished slightly down, giving the appearance of relative stability. The Nasdaq Composite gained 1.9%, supported by continued strength among the largest AI-related stocks.
But those headline indexes concealed much greater weakness beneath the surface.
One of the clearest ways to see this is through the S&P 500 Equal Weight Index. Unlike the S&P 500, which assigns the largest weights to the most valuable companies, the equal-weight index gives the same importance to every constituent.
In that sense, it provides a much better indication of what was happening to the typical S&P 500 stock. In September, the S&P 500 Equal Weight Index generated a total return of -4.8%. |
|
|
|
S&P 500 vs. NASDAQ, S&P 500 Equal Weight(Total Return - September 2026) |
|
|
The deterioration in market breadth tells a similar story.
By the end of September, approximately 83% of S&P 500 constituents were more than 10% below their 52-week highs, while roughly 42% were down more than 20%—even though the capitalization-weighted index itself remained relatively close to its record.
Businesses perceived to be direct beneficiaries of the AI investment cycle continued to attract capital, whereas almost everything else struggled.
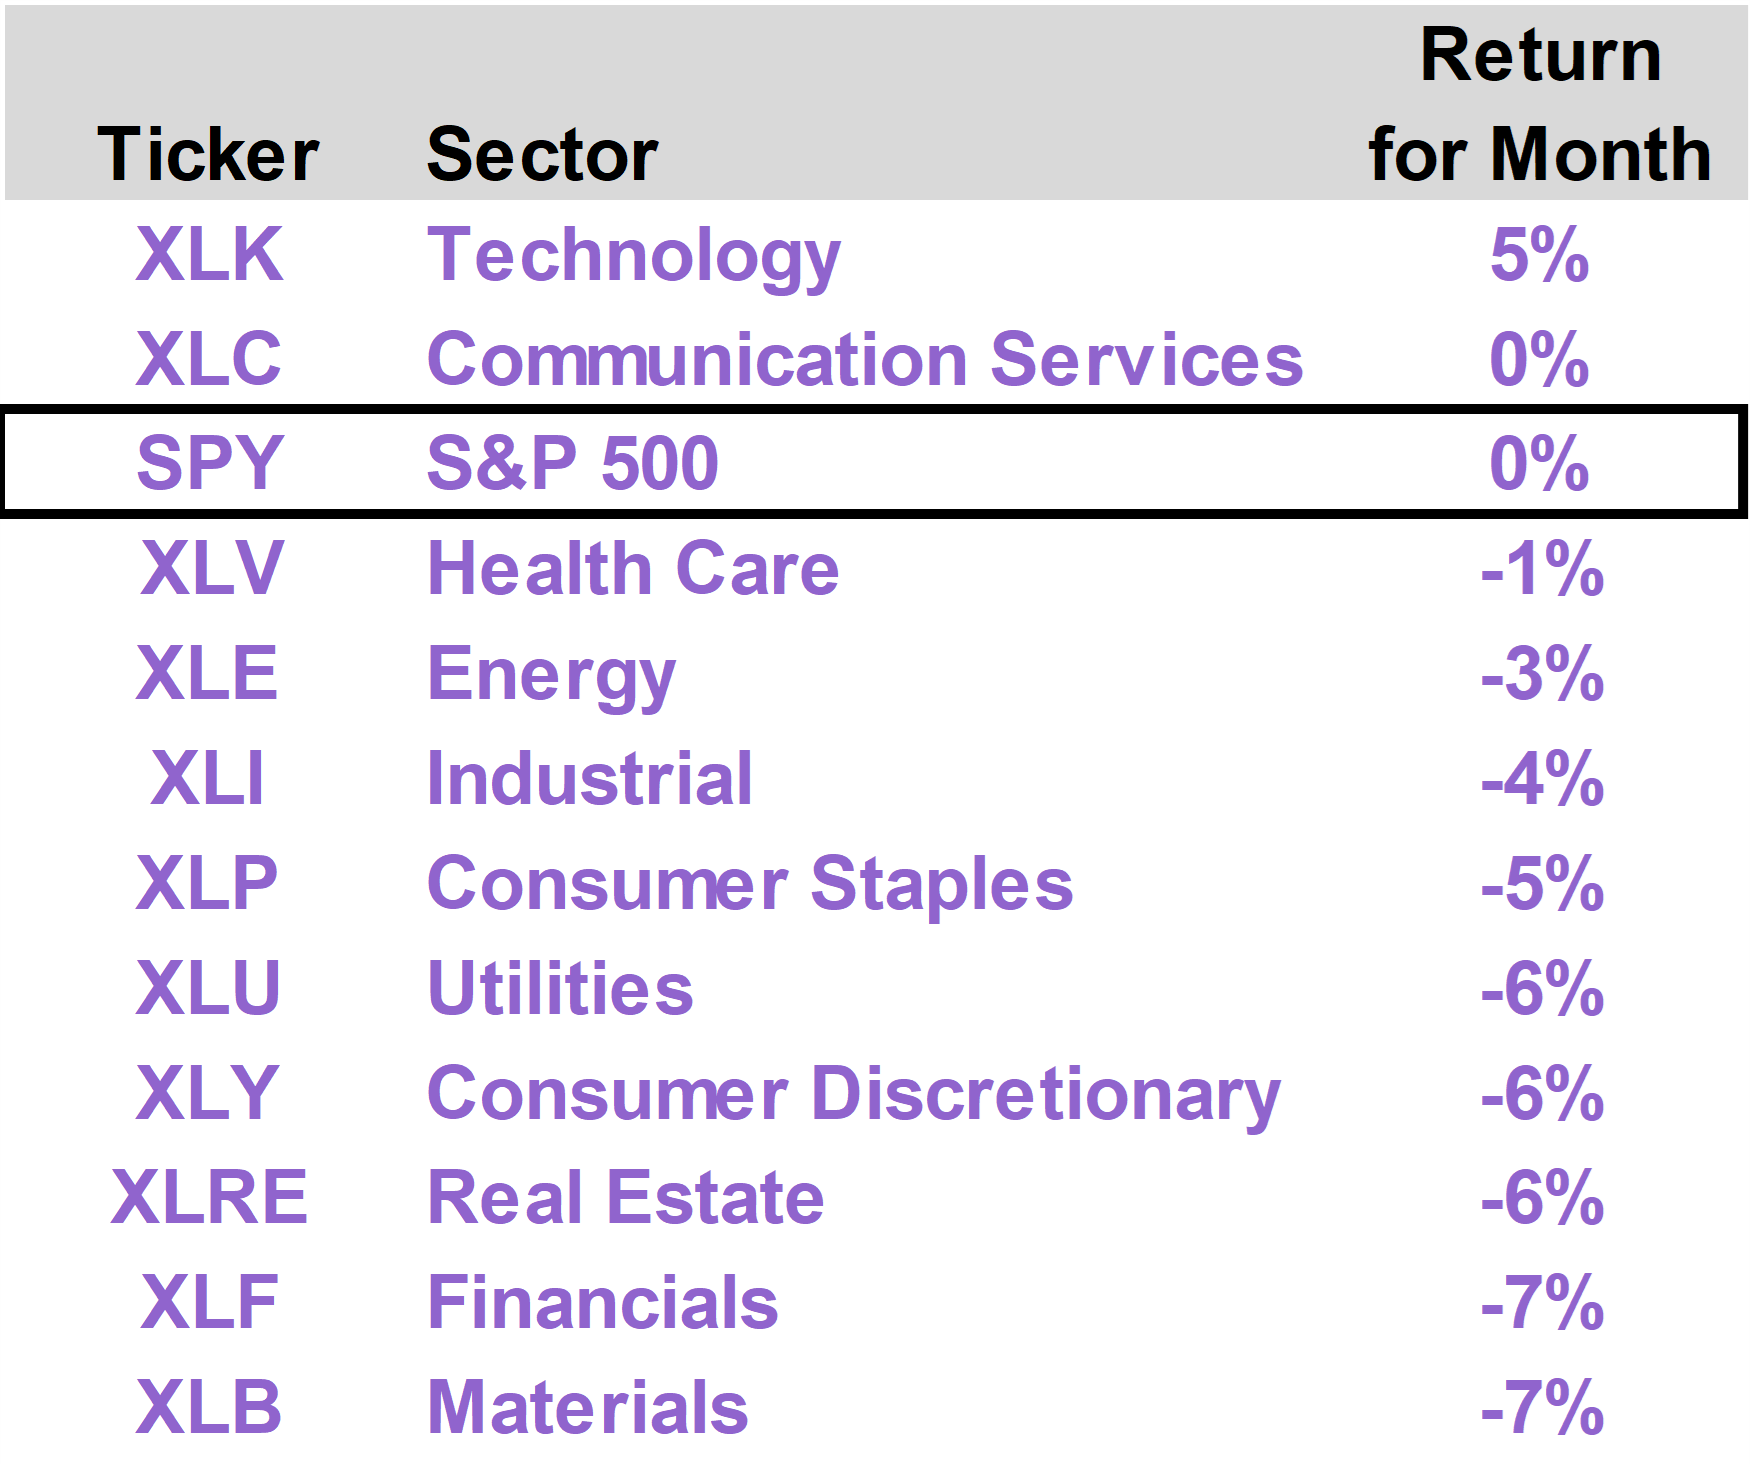
At the sector level, Technology stocks within the S&P 500 led the way and advanced 5%.
The Communication Services sector was marginally positive—but only because Meta Platforms (META), which gained 27% in September on enthusiasm around its launch of the Muse agentic AI service, has a weighting within that sector that exceeds 20%.
Excluding META, Communication Services would have delivered a negative result, along with the remaining nine other industry sectors. |
|
|
|
Bond yields spike
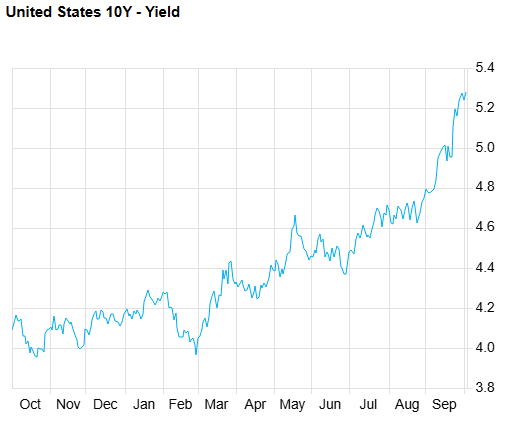
The main reason most stocks performed so poorly in September was the dramatic move higher in Treasury yields.
The 10-Year Treasury yield rose more than 50 basis points during September to approximately 5.3%, while the 30-Year Treasury yield climbed above 5.6%. |
|
|
|
10-Year Treasury Yields—Last 12 Months(Source: FactSet) |
|
|
Several factors have contributed to rising long-term bond yields this year. Economic growth has been resilient. Inflation has proven sticky. Oil prices have moved higher.
Meanwhile, the federal government continues to issue enormous quantities of debt, as the AI infrastructure boom simultaneously creates vast private sector demand for capital. In effect, the federal government and some of the world's largest corporations are competing for the same pool of long-term savings.
Some of the increase in rates therefore reflects relatively positive forces. As we discussed last month, higher real interest rates can accompany stronger expectations for long-term economic growth and productivity.
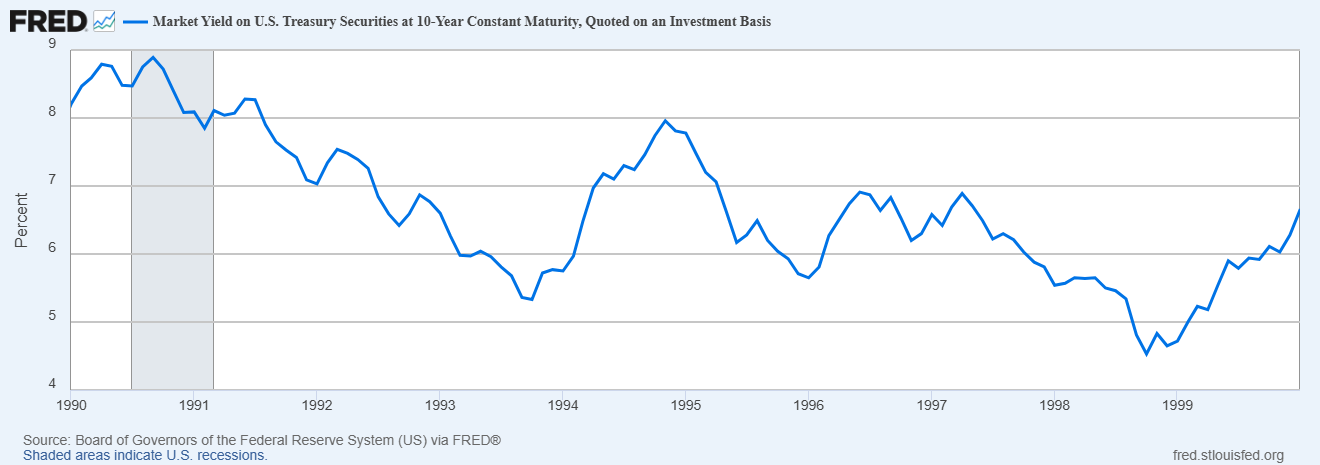
It is worth remembering that in the 1990s (a technology-driven growth era), yields on 10-Year Treasuries generally fluctuated between 5% and 8%. And the S&P 500 compounded at a remarkable 18.2% over the course of the decade. |
|
|
|
10-Year Treasury Yields in the 1990s |
|
|
While periods of real economic growth tend to be associated with higher real interest rates, the speed of September's move had significant consequences.
Higher discount rates reduce the present value investors assign to future corporate earnings. Financing becomes more expensive. Treasury securities become more competitive with stocks.
September's extraordinary market dispersion therefore makes more sense when viewed through the lens of interest rates.
Companies capable of producing explosive earnings growth could overcome the valuation pressure created by higher rates. Most other stocks could not.
The Fed adds to the pressure
While independent market forces have been pushing yields higher, the Federal Reserve significantly contributed to that dynamic in September.
At Kevin Warsh's first FOMC meeting as Chairman, the Fed unanimously raised the federal funds rate by 25 basis points to 3.75%-4.00%, its first increase in more than three years.
Warsh emphasized that inflation remained too high and that the economy remained strong enough to tolerate somewhat tighter monetary policy.
As we previously discussed in the 76report (The Rate Hike Trump Didn’t Want—But Why It Could Lead to Lower Rates Down the Road), there is a reasonable longer-term case for this approach. Establishing credibility on inflation today could ultimately give the Fed considerably more flexibility to reduce rates later.
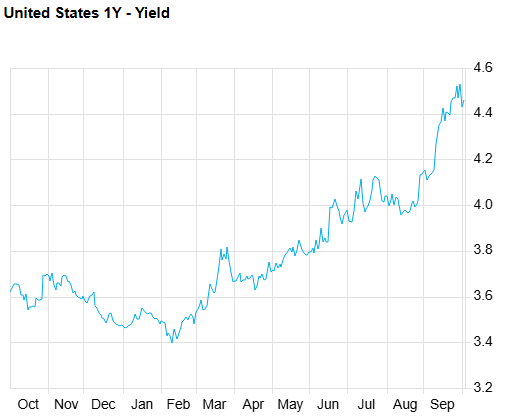
But as markets have priced in at least two incremental rate hikes in September, with 1-Year Treasury yields rising approximately a half-percent as well, the upward movement in rates has extended across the entire yield curve.
Long-term bond yields are rising in large part because they must compete with short-term bond yields. |
|
|
|
1-Year Treasury Yields—Last 12 Months(Source: FactSet) |
|
|
Oil complicates the picture
The other major macroeconomic complication remains oil.
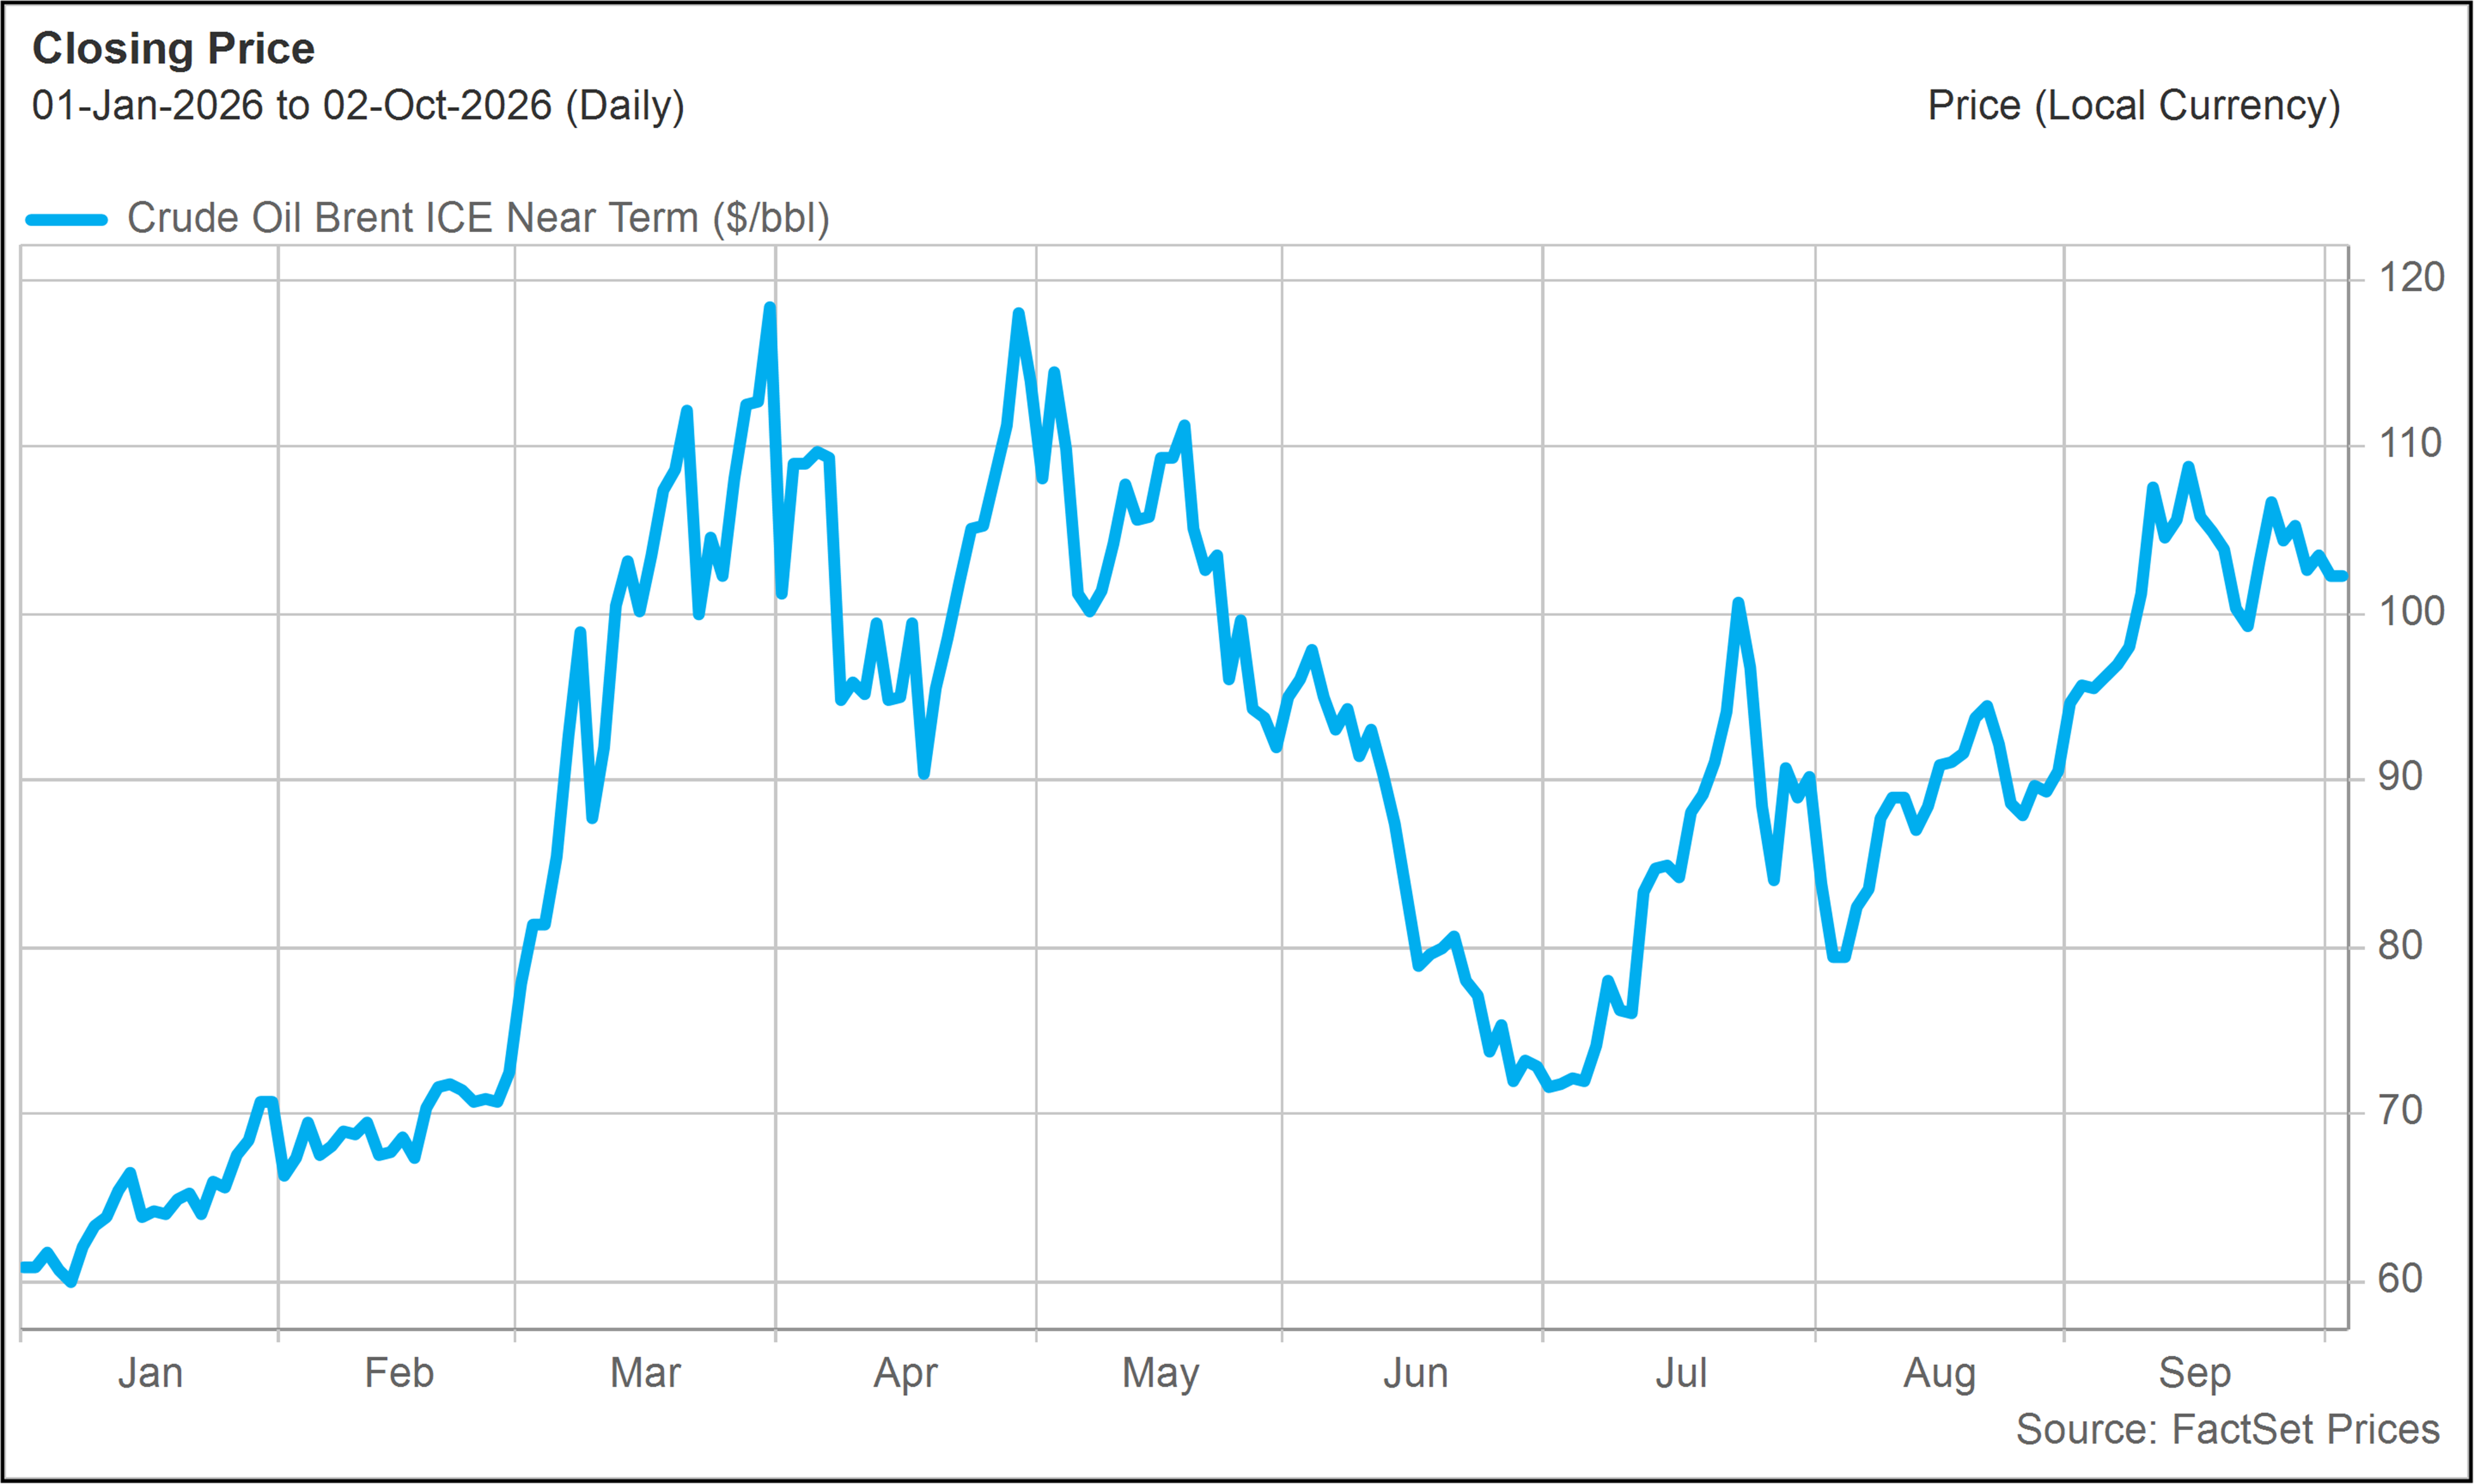
Energy prices moved higher again during September as the conflict with Iran continued to disrupt global petroleum flows and investors remained concerned about the reliability of shipments through the Strait of Hormuz. |
|
|
|
Crude Oil($/barrel - Year to Date) |
|
|
High oil prices make it more difficult for the Fed to declare victory over inflation and move toward easier monetary policy.
As we recently discussed (Iran Is Running Out of Financial Oxygen—Will Oil Prices Finally Break?), we are optimistic that oil prices could soon reverse, perhaps sharply. But the upward movement in oil made September particularly challenging: higher long-term rates, a Fed rate hike and rising energy prices all arrived at essentially the same time.
Gold takes a hit, as Bitcoin rallies
The surge in real interest rates also reversed part of the recent strength in precious metals.
Gold had rallied sharply in August as investors once again embraced the so-called debasement trade, but the environment became considerably less favorable in September.
Gold does not generate income. As government bond yields rise, the opportunity cost of holding it increases. A stronger dollar creates an additional headwind.
Gold consequently came under meaningful pressure during September, declining more than 6%, as real yields moved sharply higher and expectations for tighter Fed policy going forward increased.
While Bitcoin is often linked to gold as part of the debasement trade, it fared much better in September, advancing approximately 7%.
That strength largely reflects crypto-specific fundamentals, including continued institutional adoption and further regulatory progress despite the failure of the CLARITY Act to advance in the Senate.
The broader direction in Washington still appears to favor deeper integration of crypto into the traditional financial system, with growing momentum around tokenization and the link between crypto and agentic AI. This helped offset the macroeconomic headwinds that weighed on gold.
Has the rate move gone too far?
It is possible investors have become too carried away with the “higher for longer” narrative. The first meaningful evidence supporting that possibility arrived immediately after September ended.
The September employment report showed that the economy added only 29,000 jobs, well below expectations. The unemployment rate increased to 4.2%, wage growth moderated and previous months' employment gains were revised lower.
The report does not suggest the economy is falling into recession. Layoffs remain limited, and the labor market still resembles a relatively stable low-hire, low-fire environment.
But the softness in hiring reduces the urgency for additional Fed tightening, and both the stock and bond market responded positively to the weak jobs report.
If employment growth continues to moderate, inflation gradually recedes and the disruptions in oil markets eventually ease, investors may discover that September represented something close to a high-water mark for interest rate anxiety.
That could have important consequences for the areas of the market that suffered most.
A stabilization—or even modest decline—in long-term rates would relieve pressure on small-cap stocks, real estate, utilities, industrial companies, dividend-paying equities and many other businesses that have recently been overshadowed by the AI trade.
A difficult month—but potentially a healthier setup
September delivered an unusual combination.
The largest AI beneficiaries continued to perform well on underlying fundamental strength. On the other hand, long-term interest rates surged, the Fed tightened, oil remained expensive, and gold reversed.
Those pressures are now reflected much more aggressively in market prices.
Meanwhile, the underlying economy remains healthy. Corporate earnings remain solid. AI-related capital investment continues at an extraordinary pace. And the latest labor market data suggest the forces pushing rates relentlessly higher may finally be encountering some resistance.
If long-term yields begin to stabilize or retreat, the next phase of the market could look very different from September—and considerably more favorable for the broad range of high-quality businesses that were left behind during the month's unusually narrow AI-driven rally. |
|
| | | The top performing positions within the portfolio in September were Texas Instruments (TXN), which returned 7%; Strategy 8% Perpetual Preferred , which returned 5%; and Sempra (SRE), which returned -4%.
The worst performing positions were Blackstone (BX), which returned -22%; Carlyle Group (CG), which returned -18%; and Crown Castle (CCI), which returned -11%.
|
|
| |
TXN advanced this month on confidence that the recovery in its core industrial and automotive markets is continuing, following a company update at a major investment conference in London.
Demand trends remain relatively strong across industrial, automotive, consumer and data center end markets. In industrial, growth has been particularly strong in aerospace and defense, energy infrastructure and automated test equipment, while the broader industrial business is still growing more than 20% year over year.
The data center business is also growing in importance.
TXN’s data center revenue is annualizing at roughly $3 billion and remains on track to potentially double this year, driven by demand for power-management, voltage-regulation and other analog products used across compute and networking systems.
TXN also appears well positioned from a supply standpoint.
After years of heavy investment in 300mm manufacturing capacity, the company now has roughly $25 billion of revenue capacity and substantial additional capacity under construction. That should allow TXN to take share if competitors become supply constrained, while supporting better utilization and margins.
We continue to view TXN as an attractive way to participate in both a cyclical recovery in traditional semiconductor demand and the longer-term growth in AI infrastructure, autonomous vehicles, robotics, and other manifestations of physical AI. |
|
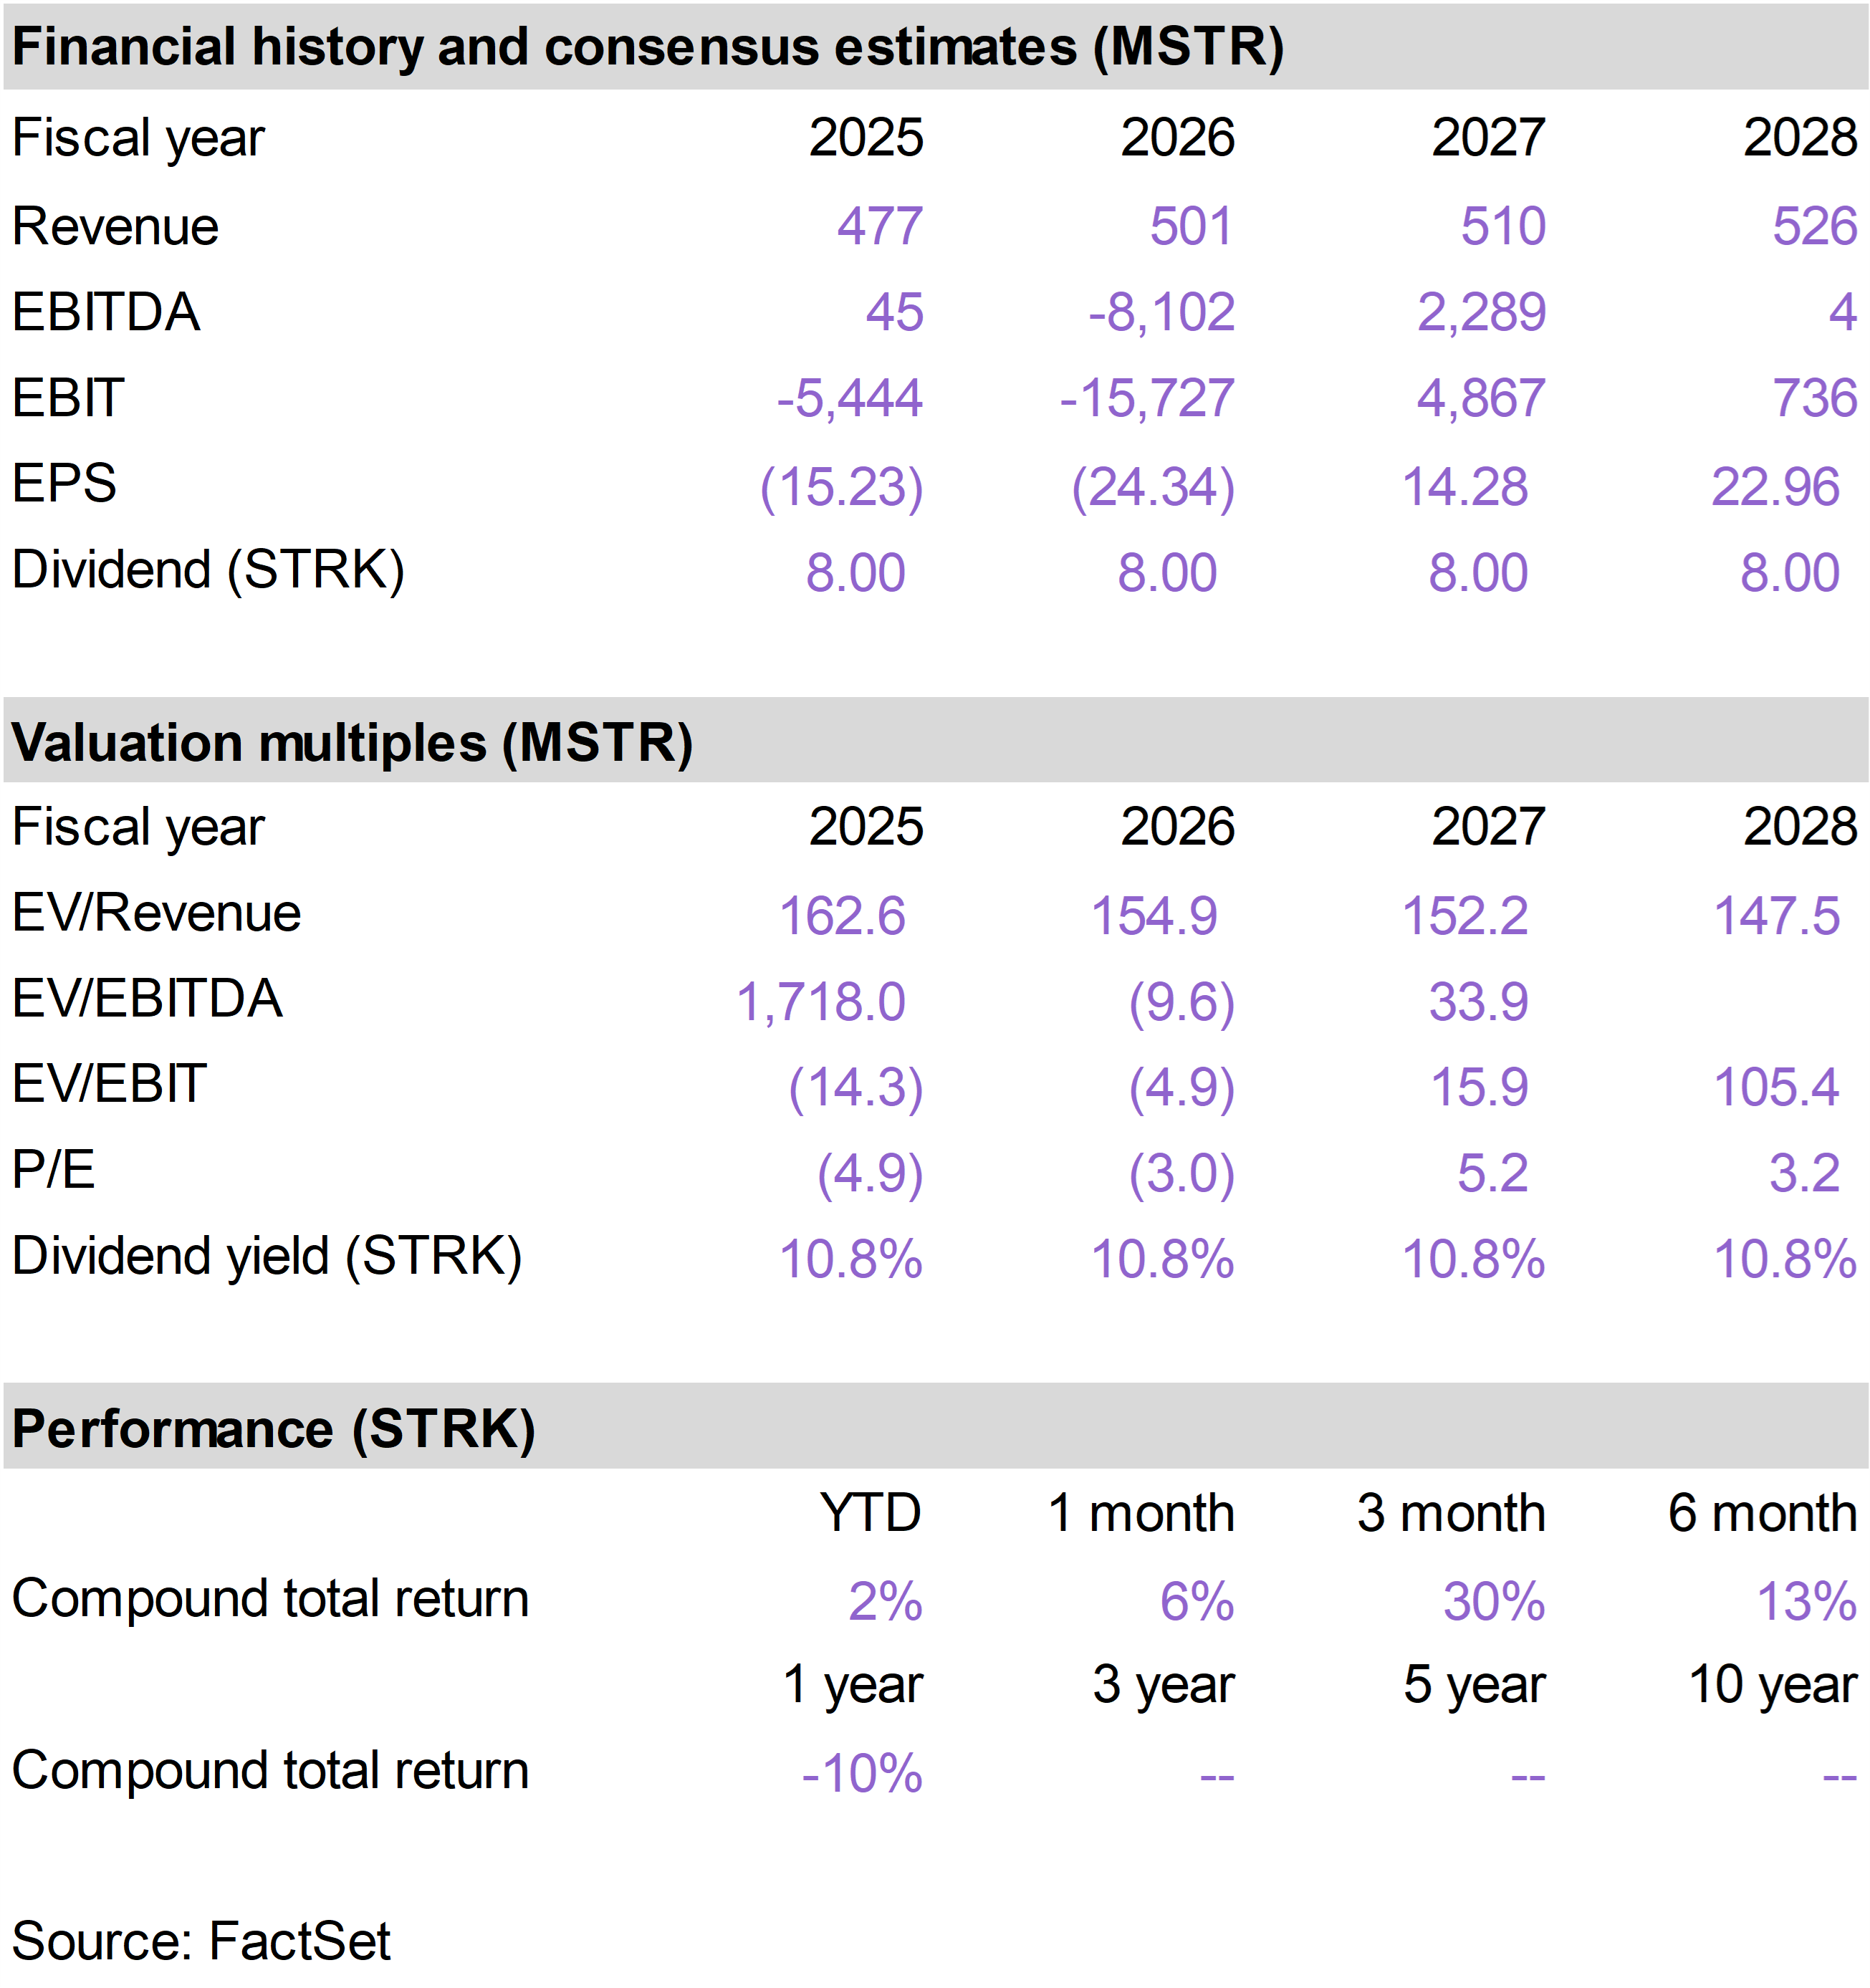
| | STRK continued to rally as Bitcoin recovered and Strategy has addressed the confidence crisis over the balance sheet that brought down the preferred shares along with the common stock (MSTR) over the summer.
Shares of STRC, the variable rate preferred instrument that the company intends to maintain very close to its $100 par value, has returned in recent weeks extremely close to that $100 level.
Fixing STRC is critical because it serves as the primary vehicle by which Strategy obtains leverage to accumulate Bitcoin.
While the substantial increase in the company’s U.S. dollar cash reserves primarily drove the upside in STRK in August, there was an additional development in September that led to further momentum.
The company announced its intention to move toward a daily dividend payment schedule for all of its preferred securities. The main idea is to make all of these instruments less volatile and to improve their appeal as income tools.
This move benefits STRC, which was already on a bi-monthly schedule, but especially benefits STRK, which was on a quarterly dividend schedule. If the proposal passes with shareholders, which we expect, STRK holders will receive dividends on every business day (with larger distributions after weekends and holidays).
With a 10.5% tax-advantaged distribution yield and exposure to long-term MSTR upside via the perpetual conversion feature, along with a now significantly strengthened balance sheet that can withstand Bitcoin volatility, we continue to view STRK as a uniquely attractive investment. |
|
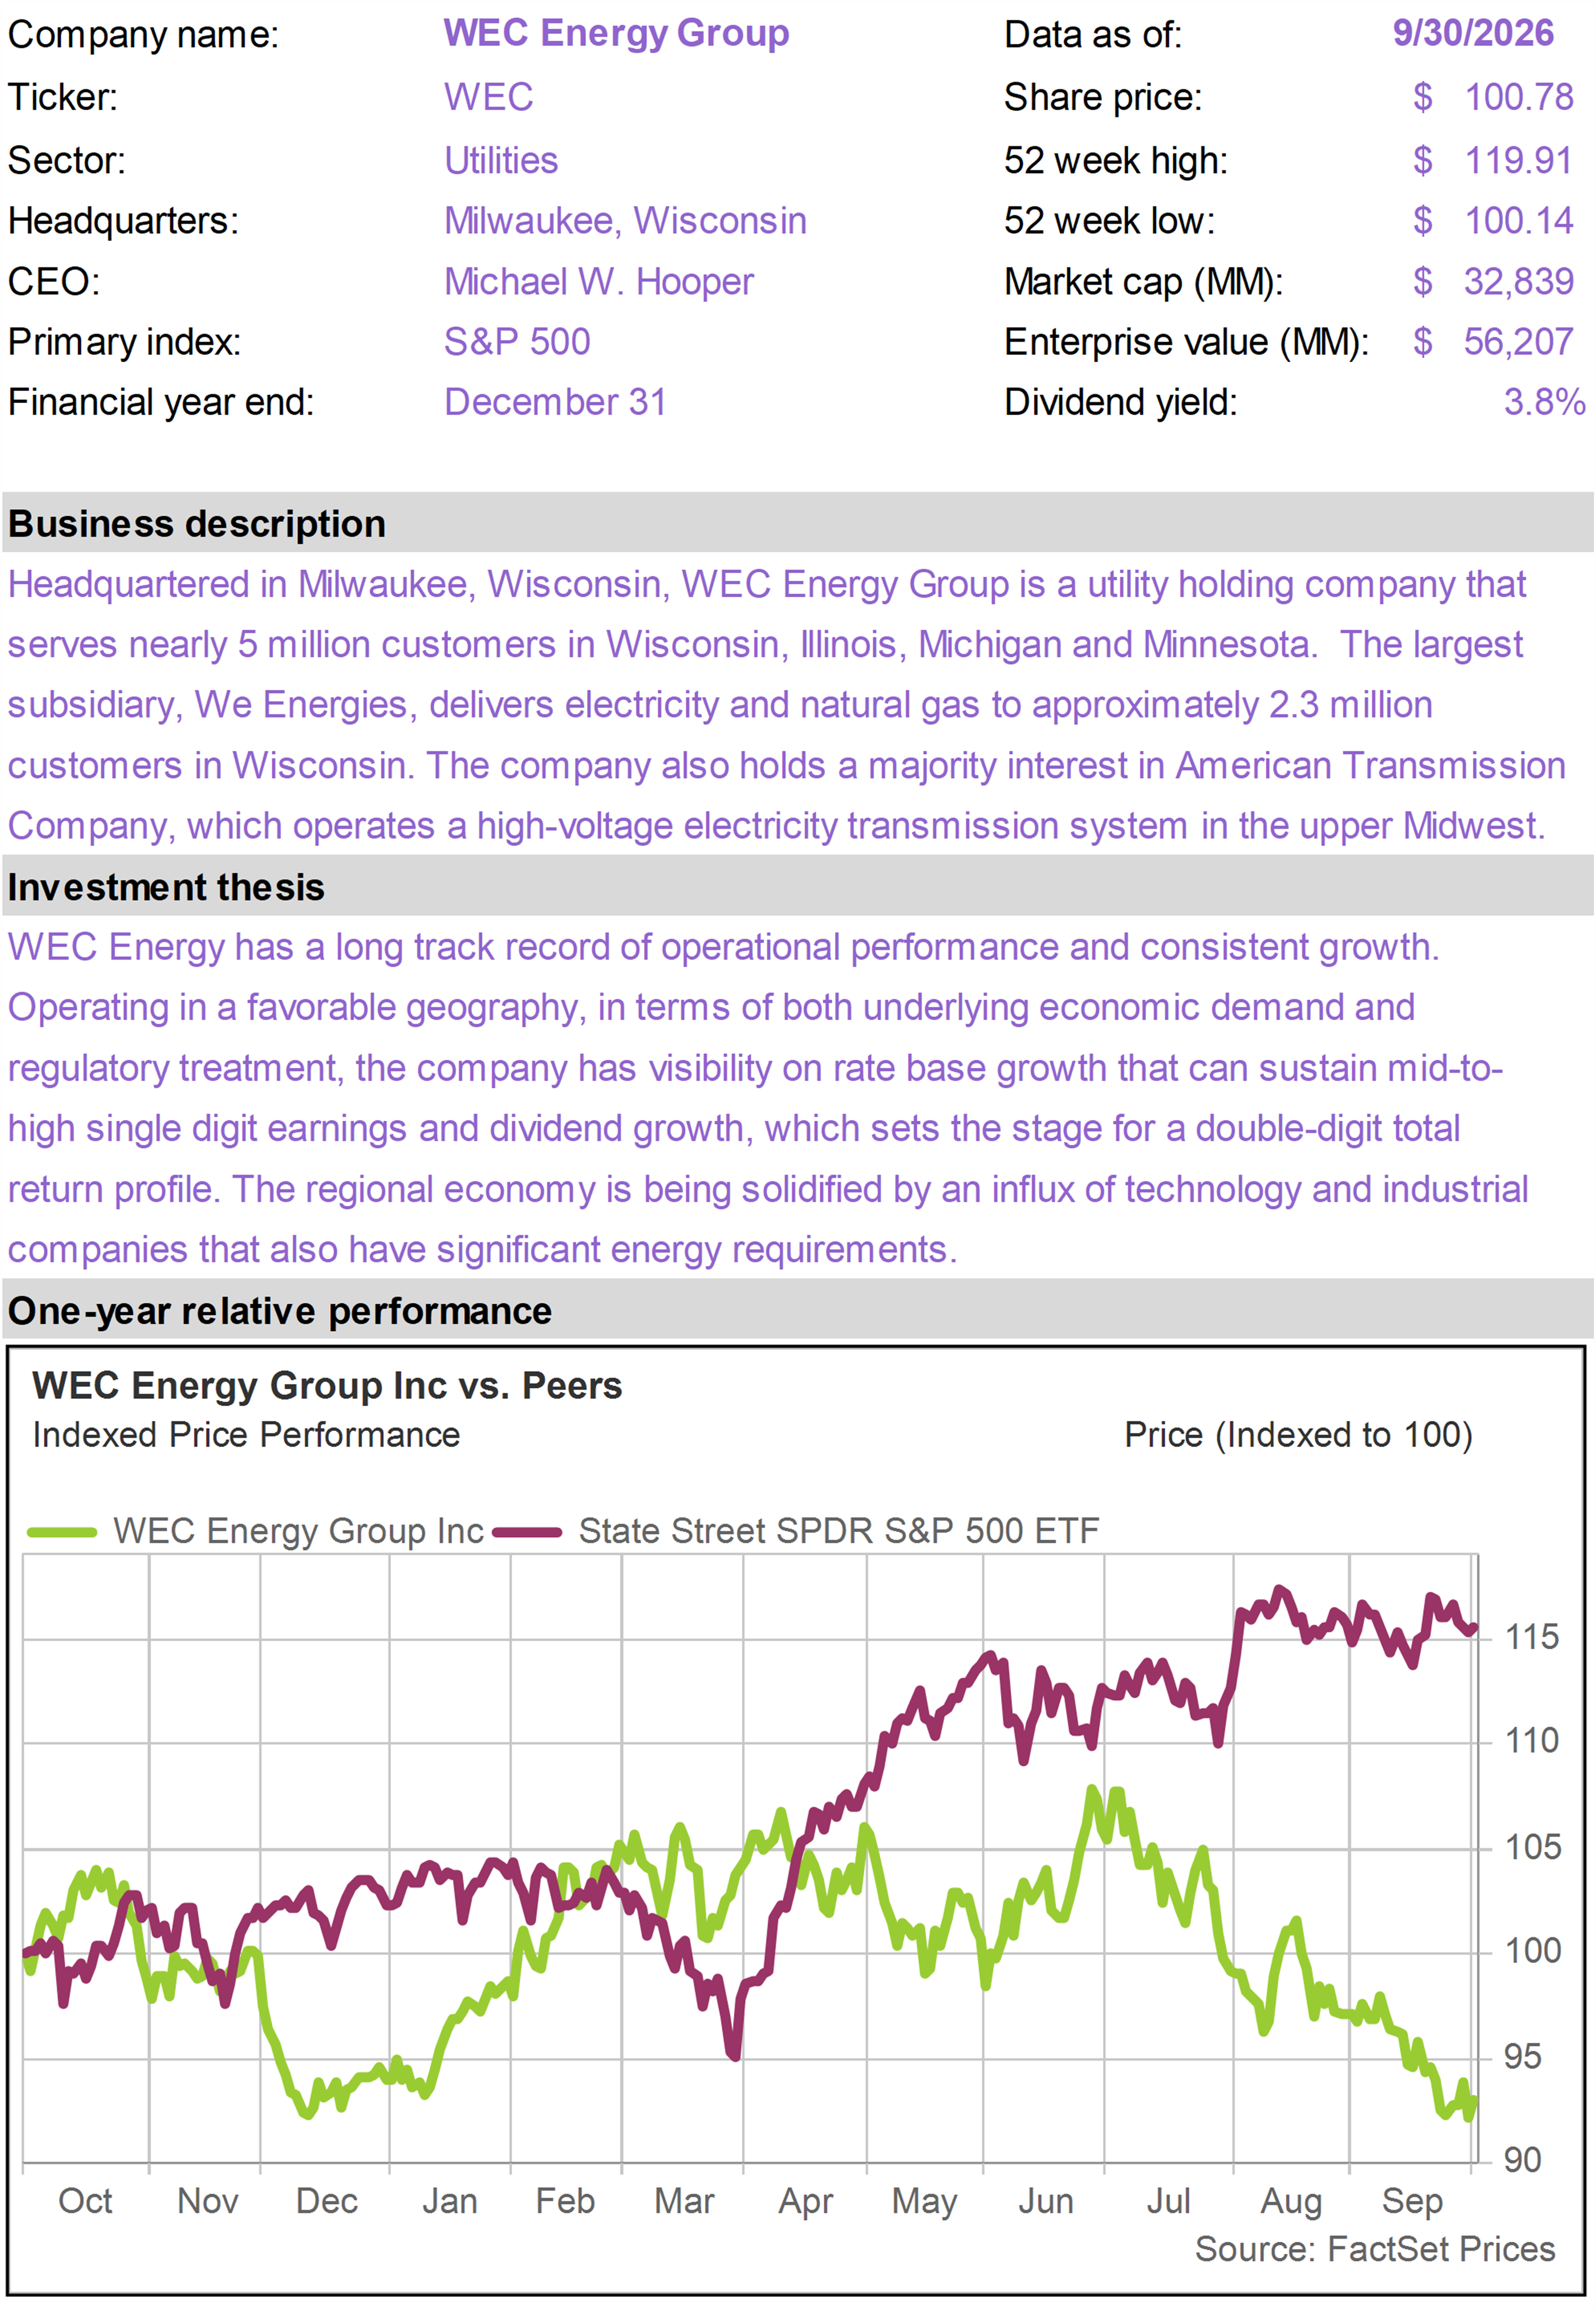
| | SRE came under some pressure in September as sharply higher long-term interest rates weighed on utilities and other income-oriented stocks, although SRE modestly outperformed.
The underlying business continues to perform well on the heels of second quarter earnings results. Adjusted EPS increased to $1.16 from $0.89 a year ago, and management reaffirmed its 2026 adjusted EPS guidance of $4.80 to $5.30, its 2027 guidance of $5.10 to $5.70, and its long-term EPS growth target of 7%-9%.
The company is increasingly emphasizing its regulated utility growth strategy. SRE’s large investment programs in Texas and California should support rate-base expansion for many years, while the company continues to simplify the portfolio through asset sales and capital recycling.
Sempra Infrastructure also continues to make progress. During the month, the business announced a long-term Liquefied Natural Gas (LNG) supply agreement with Petrobras, providing another indication of durable demand for U.S. LNG exports.
For the Income Builder portfolio, the main attraction remains the combination of a well-supported dividend and above-average earnings growth for a utility. SRE’s large regulated investment pipeline should support continued dividend growth over time. |
|
| | BX declined significantly in September as sharply higher long-term interest rates pressured alternative asset managers, while a softer-than-expected update on third-quarter realizations added a company-specific headwind.
Higher rates can weigh on alternative asset managers in several ways. They raise financing costs, can slow M&A and private-equity exit activity, and reduce the valuation investors are willing to place on future fee and performance income.
Against that backdrop, BX’s disclosure that third-quarter realizations were tracking below consensus added to near-term concerns around earnings.
Importantly, the weakness appears to be more about timing than a deterioration in underlying investment performance. Management continues to expect a stronger realization environment in the fourth quarter as IPO and transaction activity improves.
The growth story also remains intact. BX attracted more than $260 billion of inflows over the past 12 months, up 24% from the prior-year period and its strongest fundraising performance in nearly four years. Demand remains robust across institutional investors, insurance companies and private wealth.
Management also expects base management fees to return to double-digit growth in 2027, supported by new private-equity funds, infrastructure, private wealth products and continued expansion in credit and insurance.
We continue to view BX as a high-quality alternative asset manager with exceptional scale and strong exposure to long-term secular themes including AI infrastructure, power and private credit. We view the sharp selloff as an opportunity. |
|
| | CG also declined in September as higher long-term interest rates pressured alternative asset managers and raised concerns about the pace of private-market activity.
Unlike BX, CG did not face a specific negative realization update during the month. In fact, its most recent results showed strong momentum. Second quarter fee-related earnings reached a record $358 million, up 11% year over year, while distributable earnings of $472 million were the highest in nearly four years.
CG also returned almost $7 billion to fund investors during the quarter and $37 billion over the past year.
Fundraising is becoming an increasingly important part of the story. CG raised roughly $30 billion of organic inflows in the first half of 2026 and is entering what management has described as a fundraising “super cycle,” with flagship strategies across private equity, secondaries, portfolio finance and credit coming to market over the next two years.
The company has also made meaningful progress diversifying beyond traditional private equity. Global Credit and Carlyle AlpInvest both delivered record earnings in the second quarter, while wealth-management inflows continue to grow rapidly.
We therefore view the September weakness largely as a reflection of the difficult rate environment for alternative asset managers rather than a deterioration in Carlyle’s fundamentals. If long-term rates stabilize and transaction activity improves, Carlyle could benefit from both stronger realizations and an accelerating fundraising cycle. |
|
| | CCI declined in September as higher long-term interest rates continued to pressure tower REITs, while investors also remained cautious about the near-term outlook for wireless leasing activity.
The company is now a much simpler business following the sale of its fiber and small-cell operations in May. CCI is the only publicly traded U.S. pure-play tower company, with management focused on improving organic growth and operating efficiency.
Near-term leasing activity remains subdued. Management continues to expect 2026 to represent a low point, with core leasing of roughly $60-$70 million and ongoing Sprint-related churn weighing on reported growth. This softer outlook contributed to additional investor concern during the month.
The longer-term picture is more encouraging. AT&T’s acquisition of 600 MHz spectrum should require substantial new antenna equipment, while the upcoming upper C-band auction and eventual transition toward 6G could support another multi-year cycle of network investment and tower densification.
Management also believes AI will increase mobile data traffic, particularly upload traffic, creating another potential source of network demand.
We continue to view CCI as an attractive income-oriented holding, although near-term growth is likely to remain modest. The shares offer a high dividend yield and significant exposure to a potential recovery in wireless infrastructure spending. |
|
| | Why higher long-term rates hit income stocks especially hard
The sharp rise in long-term interest rates had a disproportionate impact on many Income Builder holdings in September. Dividend-oriented stocks such as utilities, REITs and infrastructure companies are often valued partly on the income they provide, so when Treasury yields rise, their dividends become relatively less attractive and investors demand higher yields from the stocks as well.
That generally means lower share prices, even when the underlying businesses remain stable.
Higher rates can also increase financing costs for capital-intensive sectors such as utilities, real estate and communications infrastructure, adding another layer of pressure to valuations. Alternative asset managers can be affected as well, since higher borrowing costs may slow transaction activity and private-market realizations.
Importantly, these effects are primarily valuation-related and can reverse if the interest-rate environment improves. September’s softer employment data suggests that monetary tightening may already be having an impact on the economy, reducing the need for additional aggressive Fed action.
If long-term yields stabilize—or begin to decline—the same sectors that were hit hardest in September could become some of the biggest beneficiaries.
Sentiment toward income-oriented names reversed sharply in September. The unexpected surge in long-term rates caught many investors off-guard.
But with many income-oriented stocks now offering historically attractive dividend yields and lower valuations, we believe the setup for longer-term investors has become increasingly compelling. |
|
| | | |
| | |
| | |
| | | |
|
| | Digital Realty Trust (DLR) |
|
|
|
| | |
|
| | |
|
| | |
|
| | |
|
| | |
|
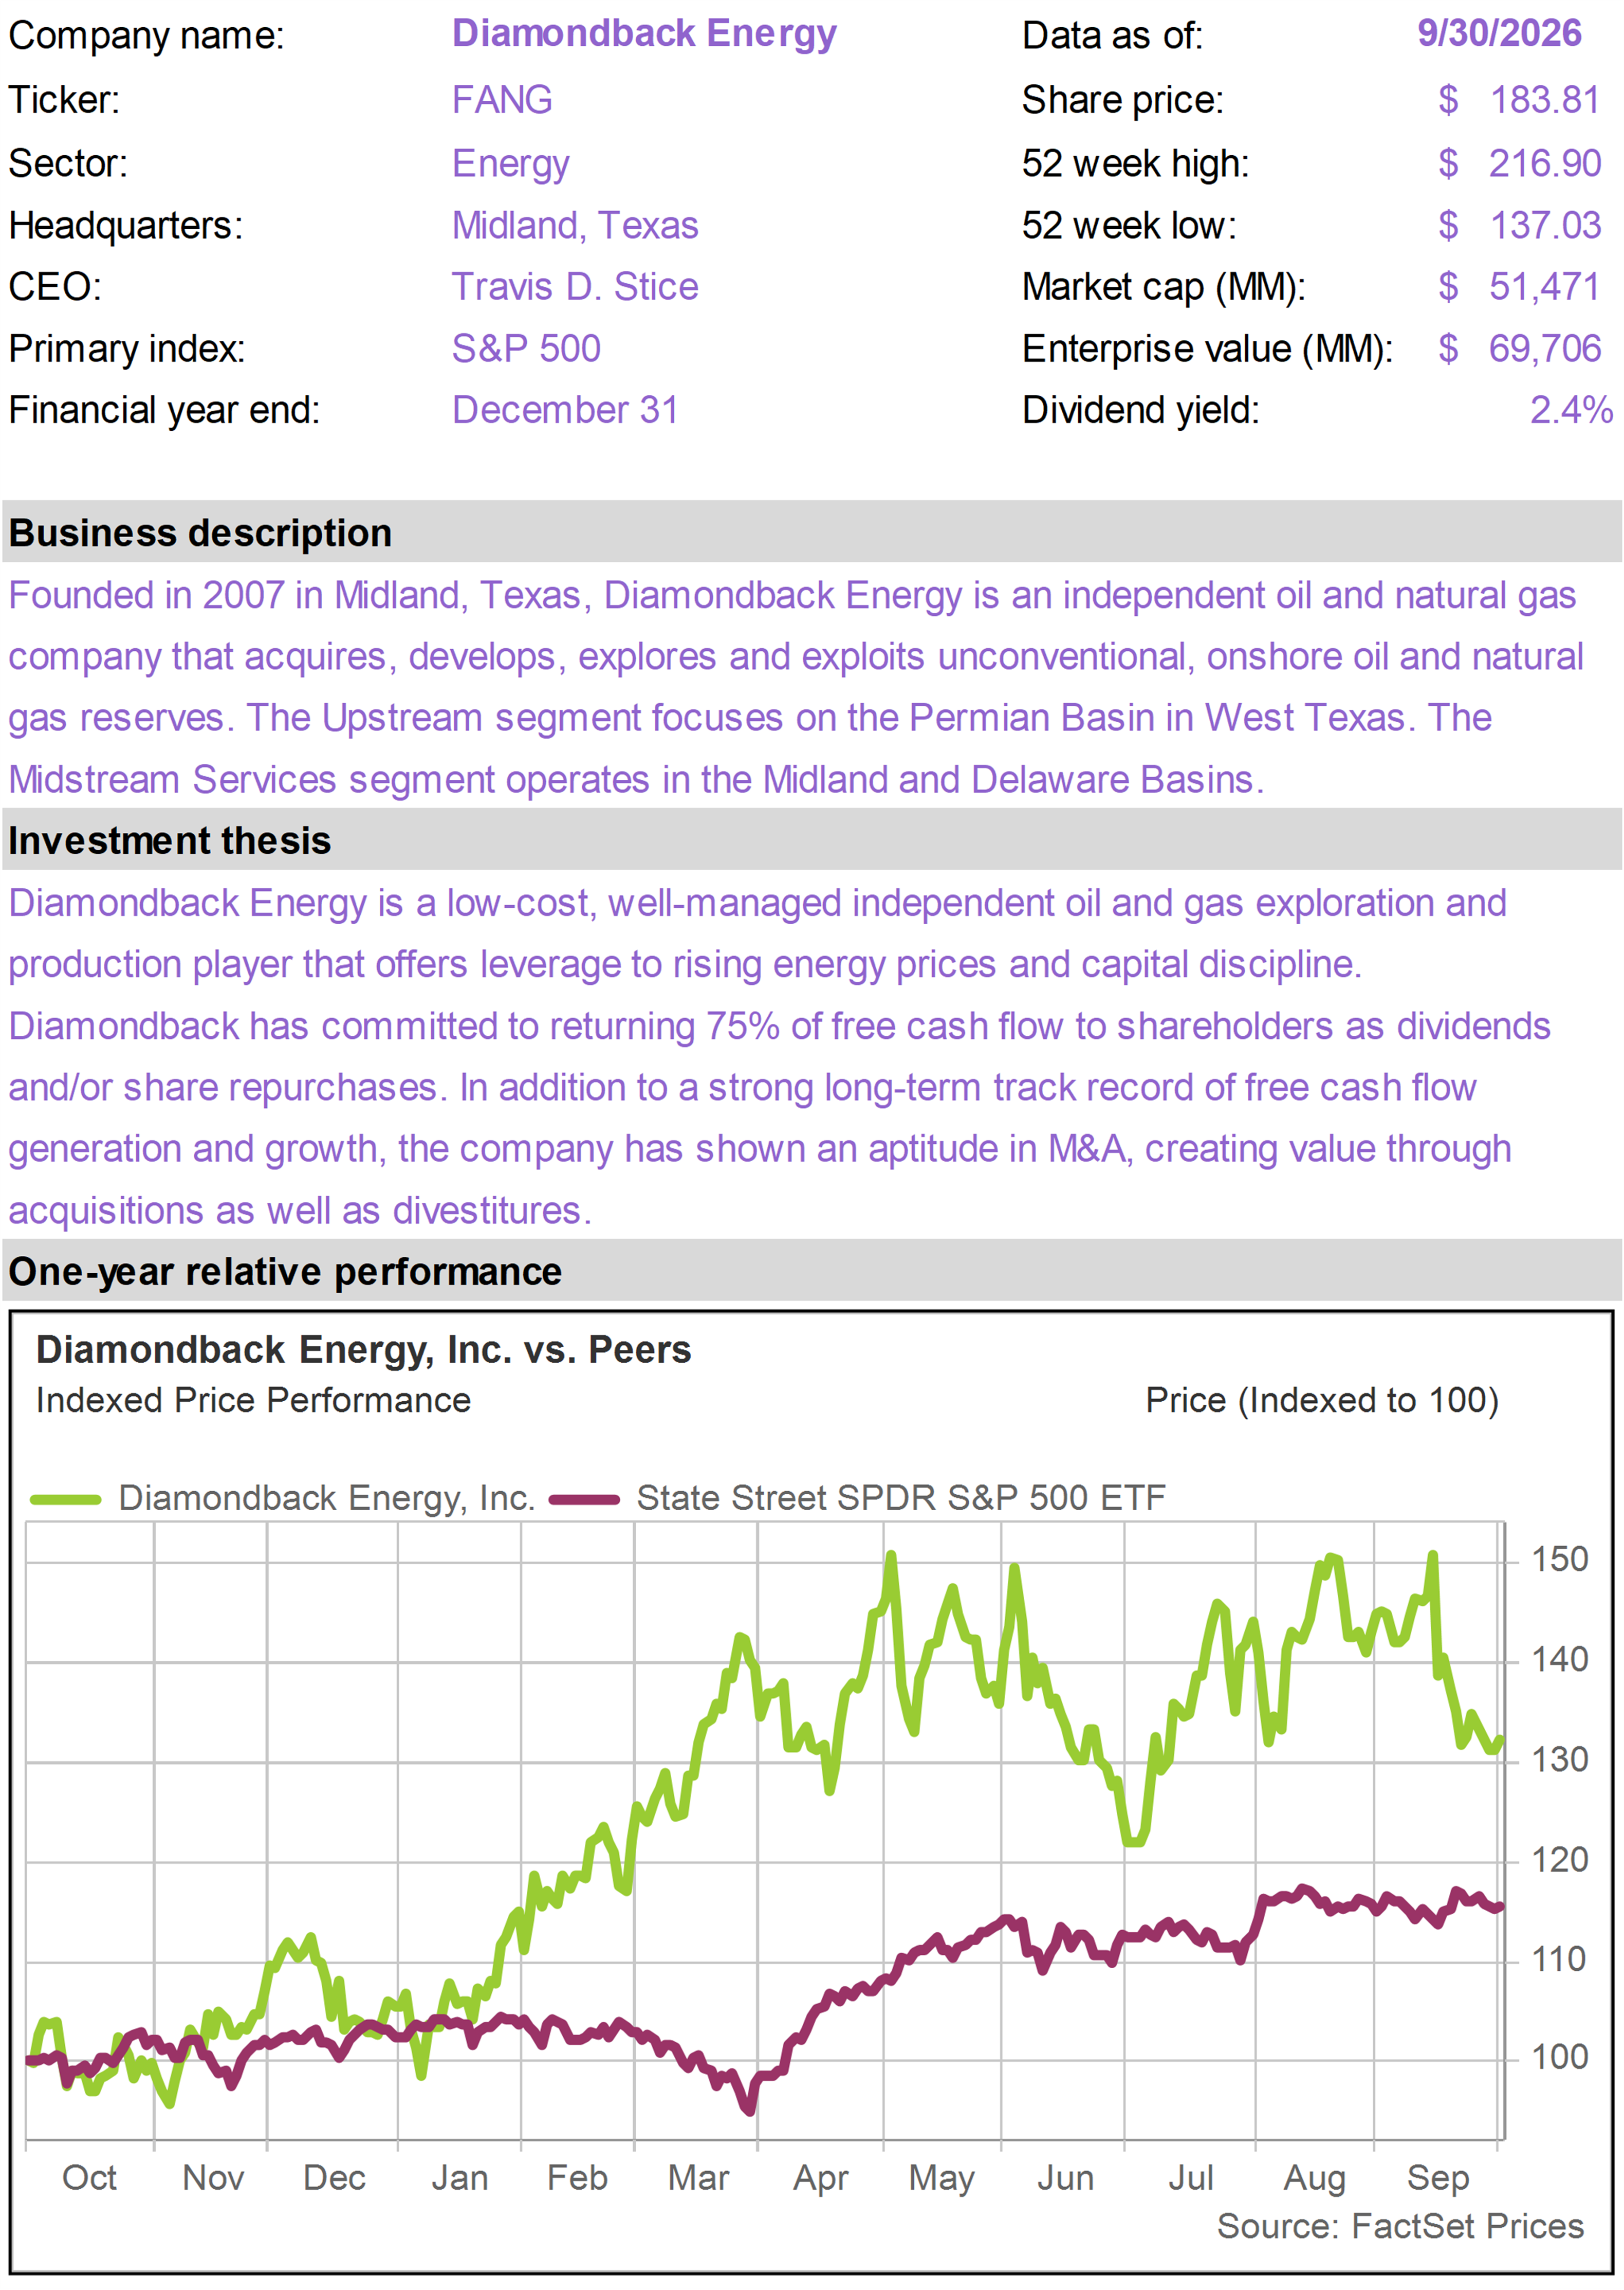
| | Diamondback Energy (FANG) |
|
|
|
| | |
|
| | Mid-America Apartment (MAA) |
|
|
|
| | |
|
| | |
|
| | |
|
| | Strategy 8% Perpetual Pref (STRK) |
|
|
|
| | |
|
| | The 76research Income Builder Model Portfolio is intended for income-oriented investors and managed to generate an overall yield that is materially higher than broad equity indices. The portfolio includes stocks with above average dividend yields from a cross section of industries. While investments are screened for their income and income growth characteristics, specific holdings are chosen based on valuation and general business quality, growth and risk considerations. |
|
| | FOR SUBSCRIBER USE ONLY. DO NOT FORWARD OR SHARE. |
|
| | | |
|
|
|
|
|