American Resilience
*|MC:SUBJECT|*
͏ ‌     ͏ ‌     ͏ ‌     ͏ ‌     ͏ ‌     ͏ ‌     ͏ ‌     ͏ ‌     ͏ ‌     ͏ ‌     ͏ ‌     ͏ ‌     ͏ ‌     ͏ ‌     ͏ ‌     ͏ ‌     ͏ ‌     ͏ ‌     ͏ ‌     ͏ ‌     ͏ ‌     ͏ ‌     ͏ ‌     ͏ ‌     ͏ ‌     ͏ ‌     ͏ ‌     ͏ ‌     ͏ ‌     ͏ ‌     ͏ ‌     ͏ ‌     ͏ ‌     ͏ ‌     ͏ ‌     ͏ ‌     ͏ ‌     ͏ ‌     ͏ ‌     ͏ ‌     ͏ ‌     ͏ ‌     ͏ ‌     ͏ ‌     ͏ ‌     ͏ ‌     ͏ ‌     ͏ ‌     ͏ ‌     ͏ ‌     ͏ ‌     ͏ ‌     ͏ ‌     ͏ ‌     ͏ ‌     ͏ ‌     ͏ ‌     ͏ ‌     ͏ ‌     ͏ ‌     ͏ ‌     ͏ ‌     ͏ ‌     ͏ ‌     ͏ ‌     ͏ ‌     ͏ ‌     ͏ ‌     ͏ ‌     ͏ ‌     ͏ ‌     ͏ ‌     ͏ ‌     ͏ ‌     ͏ ‌     ͏ ‌     ͏ ‌     ͏ ‌     ͏ ‌     ͏ ‌     ͏ ‌     ͏ ‌     ͏ ‌     ͏ ‌     ͏ ‌     ͏ ‌     ͏ ‌     ͏ ‌     ͏ ‌     ͏ ‌     ͏ ‌     ͏ ‌     ͏ ‌     ͏ ‌     ͏ ‌     ͏ ‌     ͏ ‌     ͏ ‌     ͏ ‌     ͏ ‌     ͏ ‌     ͏ ‌     ͏ ‌     ͏ ‌     ͏ ‌     ͏ ‌     ͏ ‌     ͏ ‌     ͏ ‌     ͏ ‌     ͏ ‌     ͏ ‌     ͏ ‌     ͏ ‌     ͏ ‌     ͏ ‌     ͏ ‌     ͏ ‌     ͏ ‌     ͏ ‌     ͏ ‌     ͏ ‌     ͏ ‌     ͏ ‌     ͏ ‌     ͏ ‌     ͏ ‌     ͏ ‌     ͏ ‌     ͏ ‌     ͏ ‌     ͏ ‌     ͏ ‌     ͏ ‌     ͏ ‌     ͏ ‌     ͏ ‌     ͏ ‌     ͏ ‌     ͏ ‌     ͏ ‌     ͏ ‌     ͏ ‌     ͏ ‌     ͏ ‌     ͏ ‌     ͏ ‌     ͏ ‌     ͏ ‌     ͏ ‌     ͏ ‌     ͏ ‌     ͏ ‌     ͏ ‌     ͏ ‌     ͏ ‌     ͏ ‌     ͏ ‌     ͏ ‌     ͏ ‌     ͏ ‌     ͏ ‌     ͏ ‌     ͏ ‌     ͏ ‌     ͏ ‌     ͏ ‌     ͏ ‌     ͏ ‌     ͏ ‌     ͏ ‌     ͏ ‌     ͏ ‌     ͏ ‌     ͏ ‌     ͏ ‌     ͏ ‌     ͏ ‌     ͏ ‌     ͏ ‌     ͏ ‌     ͏ ‌     ͏ ‌     ͏ ‌     ͏ ‌     ͏ ‌     ͏ ‌     ͏ ‌     ͏ ‌     ͏ ‌     ͏ ‌     ͏ ‌     ͏ ‌     ͏ ‌     ͏ ‌     ͏ ‌     ͏ ‌     ͏ ‌     ͏ ‌     ͏ ‌     ͏ ‌     ͏ ‌     ͏ ‌     ͏ ‌     ͏ ‌     ͏ ‌     ͏ ‌     ͏ ‌     ͏ ‌     ͏ ‌     ͏ ‌     ͏ ‌     ͏ ‌     ͏ ‌     ͏ ‌     ͏ ‌     ͏ ‌     ͏ ‌     ͏ ‌     ͏ ‌     ͏ ‌     ͏ ‌     ͏ ‌     ͏ ‌     ͏ ‌     ͏ ‌     ͏ ‌     ͏ ‌     ͏ ‌     ͏ ‌     ͏ ‌     ͏ ‌     ͏ ‌     ͏ ‌     ͏ ‌     ͏ ‌     ͏ ‌     ͏ ‌     ͏ ‌     ͏ ‌     ͏ ‌     ͏ ‌     ͏ ‌     ͏ ‌     ͏ ‌     ͏ ‌     ͏ ‌     ͏ ‌     ͏ ‌     ͏ ‌     ͏ ‌     ͏ ‌     ͏ ‌     ͏ ‌     ͏ ‌     ͏ ‌     ͏ ‌     ͏ ‌     ͏ ‌     ͏ ‌     ͏ ‌     ͏ ‌     ͏ ‌     ͏ ‌     ͏ ‌     ͏ ‌     ͏ ‌     ͏ ‌     ͏ ‌     ͏ ‌     ͏ ‌     ͏ ‌     ͏ ‌     ͏ ‌     ͏ ‌     ͏ ‌     ͏ ‌     ͏ ‌     ͏ ‌     ͏ ‌     ͏ ‌     ͏ ‌     ͏ ‌     ͏ ‌     ͏ ‌     ͏ ‌     ͏ ‌     ͏ ‌     ͏ ‌     ͏ ‌     ͏ ‌     ͏ ‌     ͏ ‌     ͏ ‌     ͏ ‌     ͏ ‌     ͏ ‌     ͏ ‌     ͏ ‌     ͏ ‌     ͏ ‌     ͏ ‌     ͏ ‌     ͏ ‌     ͏ ‌     ͏ ‌     ͏ ‌     ͏ ‌     ͏ ‌     ͏ ‌     ͏ ‌     ͏ ‌     ͏ ‌     ͏ ‌     ͏ ‌     ͏ ‌     ͏ ‌     ͏ ‌     ͏ ‌     ͏ ‌    ­ ­ ­ ­ ­ ­ ­ ­ ­ ­ ­ ­ ­ ­ ­ ­ ­ ­ ­ ­ ­ ­ ­ ­ ­ ­ ­ ­ ­ ­ ­ ­ ­ ­ ­ ­ ­ ­ ­ ­ ­ ­ ­ ­ ­ ­ ­ ­ ­ ­ ­ ­ ­ ­ ­ ­ ­ ­ ­ ­ ­ ­ ­ ­ ­ ­ ­ ­ ­ ­ ­ ­ ­ ­ ­ ­ ­ ­ ­ ­ ­ ­ ­ ­ ­ ­ ­ ­ ­ ­ ­ ­ ­ ­ ­ ­ ­ ­ ­ ­ ­ ­ ­ ­ ­ ­ ­ ­ ­ ­ ­ ­ ­ ­ ­ ­ ­ ­ ­ ­ ­ ­ ­ ­ ­ ­ ­ ­ ­ ­ ­ ­ ­ ­ ­ ­ ­ ­ ­ ­ ­ ­ ­ ­ ­ ­ ­ ­ ­ ­ ­ ­ ­ ­ ­ ­ ­ ­ ­ ­ ­ ­ ­ ­ ­ ­ ­ ­ ­ ­ ­ ­ ­ ­ ­ ­ ­ ­ ­ ­ ­ ­ ­ ­ ­ ­ ­ ­ ­ ­ ­ ­ ­ ­ ­ ­ ­ ­ ­ ­ ­ ­ ­ ­ ­ ­ ­ ­ ­ ­ ­ ­ ­ ­ ­ ­ ­ ­ ­ ­ ­ ­ ­ ­ ­ ­ ­ ­ ­ ­ ­ ­ ­ ­ ­ ­ ­ ­ ­ ­ ­ ­ ­ ­ ­ ­ ­ ­ ­ ­ ­ ­ ­ ­ ­ ­ ­ ­ ­ ­ ­ ­ ­ ­ ­ ­ ­ ­ ­ ­ ­ ­ ­ ­ ­ ­ ­ ­ ­ ­ ­ ­

American Resilience Model Portfolio

Monthly Portfolio Review: January 2026

Publication date: February 2, 2026

Current portfolio holdings

FOR SUBSCRIBER USE ONLY. DO NOT FORWARD OR SHARE.

Executive summary

  • Stocks moved marginally higher in January, as technology and growth took a back seat this month to last year’s underperformers.

  • Commodities performed extremely well amid geopolitical tensions.

  • Precious metals staged a historic rally, while Energy was the best performing sector.  

  • The American Resilience portfolio generated a total return of 4.7%, versus 1.5% for the S&P 500.

  • Texas Instruments (TXN) was the standout this month, delivering a 25% total return following a highly encouraging earnings report.

  • Oracle (ORCL) was the worst performer, declining 15%, and in our view is now significantly undervalued.

  • Shares of Meta Platforms (META) advanced 15% on strong earnings since the stock’s mid-month addition to the portfolio.

  • With inflation subsiding and productivity increasing, we continue to view the macroeconomic outlook as highly favorable for stocks.

  • We expect Trump’s nominee to Chair the Federal Reserve, Kevin Warsh, to be an effective advocate for supportive monetary policy and institutional reform.

Performance review

The American Resilience portfolio delivered a total return of 4.7% in January, versus the S&P 500 Index return of 1.5%. On a one-year basis through the end of the month, the portfolio returned 8.9%, versus 16.4% for the S&P 500.


The top performing portfolio positions in January were Texas Instruments (TXN), which returned 25%; Williams (WMB), which returned 12%; and Air Products & Chemicals (APD), which returned 11%.


Two positions in the portfolio generated negative returns this month. Oracle (ORCL) declined 15%, and Visa (V) declined 8%.

Geopolitical surprises


Geopolitics had a meaningful impact this month, first with the capture of Nicolas Maduro in Venezuela and then with Trump’s maneuvering to take effective control of Greenland.


Market reaction to the elimination of Maduro was positive as we discussed in the 76report (Why Markets Celebrated the Fall of Maduro). The Maduro regime has been a source of risk and instability for the United States. His removal improves the outlook for Latin America.


Trump’s actions with respect to Greenland were not as well-received by markets, at least initially, mainly because of potential fallout from the approach he took. Trump’s strategy was to pressure European nations into selling Greenland to the U.S. through the threat of tariffs, stoking concerns over another potential trade war.


This led to some volatility mid-month, but it was short-lived. In a matter of days, Trump announced that a framework arrangement had been reached with European counterparts that would address U.S. strategic objectives in Greenland.


Commodities soar


All of this geopolitical commotion, which also included widespread and violent protest activity in Iran, helped to spur investment demand for various commodities in January.


Precious metals in particular had an extraordinary month, even though the rally was clipped on the last trading day with Trump’s announcement that Kevin Warsh will be nominated as Fed Chair.


Gold and silver ended the month up 9% and 43% respectively, even after precipitous drops on January 30. At their peak, the two metals had risen more than 20% and 60% over the course of the month.

Gold and Silver

(Total Return - January 2026)

The sharp rally in precious metals, which clearly took on some speculative momentum, had many drivers. Geopolitical uncertainty contributed by underscoring the value of gold as a neutral reserve asset that cannot be confiscated.


As we discussed in the 76report (Gold Hits $5,000: This Is Scarcity, Not Risk Aversion), we also see more structural drivers behind the move in gold and other commodities, with rising productivity spurring demand for scarce assets.


Warsh gets the nod


The party in precious metals was called off early when Trump announced his pick for Fed Chair on January 30.


Kevin Warsh is perceived by many as an inflation hawk, mainly because of the positions he took as Fed Governor during the global financial crisis. He has been a sharp critic of Quantitative Easing (QE) and the massive growth of the Fed’s balance sheet, first with the financial crisis and again with the pandemic.


Despite his hawkish reputation, we believe Warsh is very much aligned with Trump’s pro-growth agenda, including his desire to bring interest rates down for the benefit of Main Street consumers and businesses.


As we discussed last week (Why Trump Picked Kevin Warsh to Lead the Fed in the Era of AI and Crypto), Warsh is also very much focused on AI and the modernization of the financial system.


In recent interviews, Warsh has drawn an analogy between the current economic environment and the early 1990s when productivity gains from the Internet were just starting to kick in. He has praised former Fed Chair Alan Greenspan for keeping interest rates low in this time frame, suggesting a template for his own tenure as Fed Chair.


For many months, Trump has been bashing current Fed Chair Jerome Powell for keeping monetary policy too restrictive. Rate cuts are clearly Trump’s top priority.


Trump and Treasury Secretary Scott Bessent conducted an extensive search process to replace Powell with an individual who shares their macroeconomic vision. Clearly, they believe they have found one in Warsh, notwithstanding his structural concerns over QE.


Gold and silver had risen so sharply, however, that it is not surprising that they retreated with the announcement of Warsh’s nomination, especially given his historic criticism of the endless growth of the Fed’s balance sheet.


Energy stocks lead


While metal prices surged in January, contributing to a 9% total return for the Materials sector, stocks in the Energy sector did even better, delivering a 14% return. Oil prices moved up noticeably in January, following several months of trading at relatively depressed levels.


The Maduro capture initially led to some pressure on oil prices (based on the potential for more Venezuelan supply) but oil then drifted higher on a combination of geopolitical uncertainty, strong economic growth, and potentially strong demand from the mining sector (with the rise in metals prices).    

Crude Oil - Last 12 Months

Energy stocks were also helped by a sharp spike in spot natural gas prices in response to the cold snap that swept much of the United States.


Technology stocks generally lagged the rest of the market, as money moved into sectors that had underperformed in 2025.


January was notable in that the S&P 500 Equal Weight Index substantially outperformed the market-cap weighted index, returning 3.3% versus 1.5%. Similarly, Value outperformed Growth, returning 2.4% versus 0.5%.


But these moves only partly reversed the 2025 outperformance of the market-cap weighted index (versus equal weight) and the growth index (versus value).


In 2025, the S&P 500 returned 16.4%, versus 9.3% for the equal weight index. Meanwhile, the S&P 500 Growth Index returned 21.4%, versus 11.0% for the S&P 500 Value Index.

S&P 500 vs. Equal Weight, Value, Growth

(Total Return - January 2026)

The Technology sector as a whole was only slightly positive in January. There were some bright spots, such as the recovery in Meta Platforms (META), which gained 9%. This was offset by weakness in mega-cap tech stocks like Microsoft (MSFT), down 11%, and Apple (AAPL), down 5%.

Source: FactSet


A constructive outlook


January was an eventful and, at times, chaotic month. Headlines were noisy and often unsettling. But stepping back from the day-to-day distractions, the underlying macroeconomic picture looks increasingly favorable.


The economy appears to be moving into a period of strong, non-inflationary growth, supported by rising productivity rather than excess demand. Inflation continues to cool, and importantly, shelter costs—one of the most persistent and lagging components of inflation—are now declining, reinforcing the disinflation trend.


As price pressures ease, interest rates are likely to follow, particularly as policymakers look to stimulate growth through lower rates rather than further balance sheet expansion (assuming Warsh is confirmed, which we expect, and starts to push the Fed in this direction later this year).


The stock market continues to wrestle with AI as it attempts to differentiate winners and losers. Meanwhile, AI adoption continues to accelerate across the economy, providing a tailwind for corporate profits.


META’s success this month actually represents a useful case study.


META came under pressure in late 2025 as the company ramped up AI spending, raising concerns about near-term profitability. Those concerns are now fading as AI investments are yielding meaningful gains in revenue growth and operating efficiency within META’s core advertising business.


META may be early, but it will not be unique. AI has the potential to improve nearly every business by speeding up decision-making, reducing friction, and lowering costs. One unavoidable implication, however, is that many business processes now require fewer people.


On META’s most recent earnings call, CEO Mark Zuckerberg noted that “2026 is going to be the year that AI starts to dramatically change the way that we work.” He added that they are “starting to see projects that used to require big teams now be accomplished by a single very talented person.”


That dynamic helps explain the recent wave of corporate restructuring. Amazon (AMZN) recently announced that it would reduce roughly 16,000 corporate roles. These are not warehouse jobs tied to weakening demand, but office roles being eliminated as productivity improves.


It is important to distinguish between layoffs driven by economic distress and those driven by technological efficiency. While painful for affected workers, AI-driven job reductions are positive for corporate margins and at the macro level give the Fed more room to ease policy.


As AI adoption deepens, we may see more unsettling labor headlines and even modest increases in unemployment. Counterintuitive as it may sound, that combination—higher productivity, softer labor pressure, and easier monetary policy—creates a favorable backdrop for stocks and supports the case for a durable expansion.

Portfolio highlights


The top performing stocks in the portfolio in January were Texas Instruments (TXN), which returned 25%; Williams (WMB), which returned 12%; and Air Products & Chemicals (APD), which returned 11%.


Two positions generated negative returns this month. Oracle (ORCL) returned -15%, and Visa (V) returned -8%.


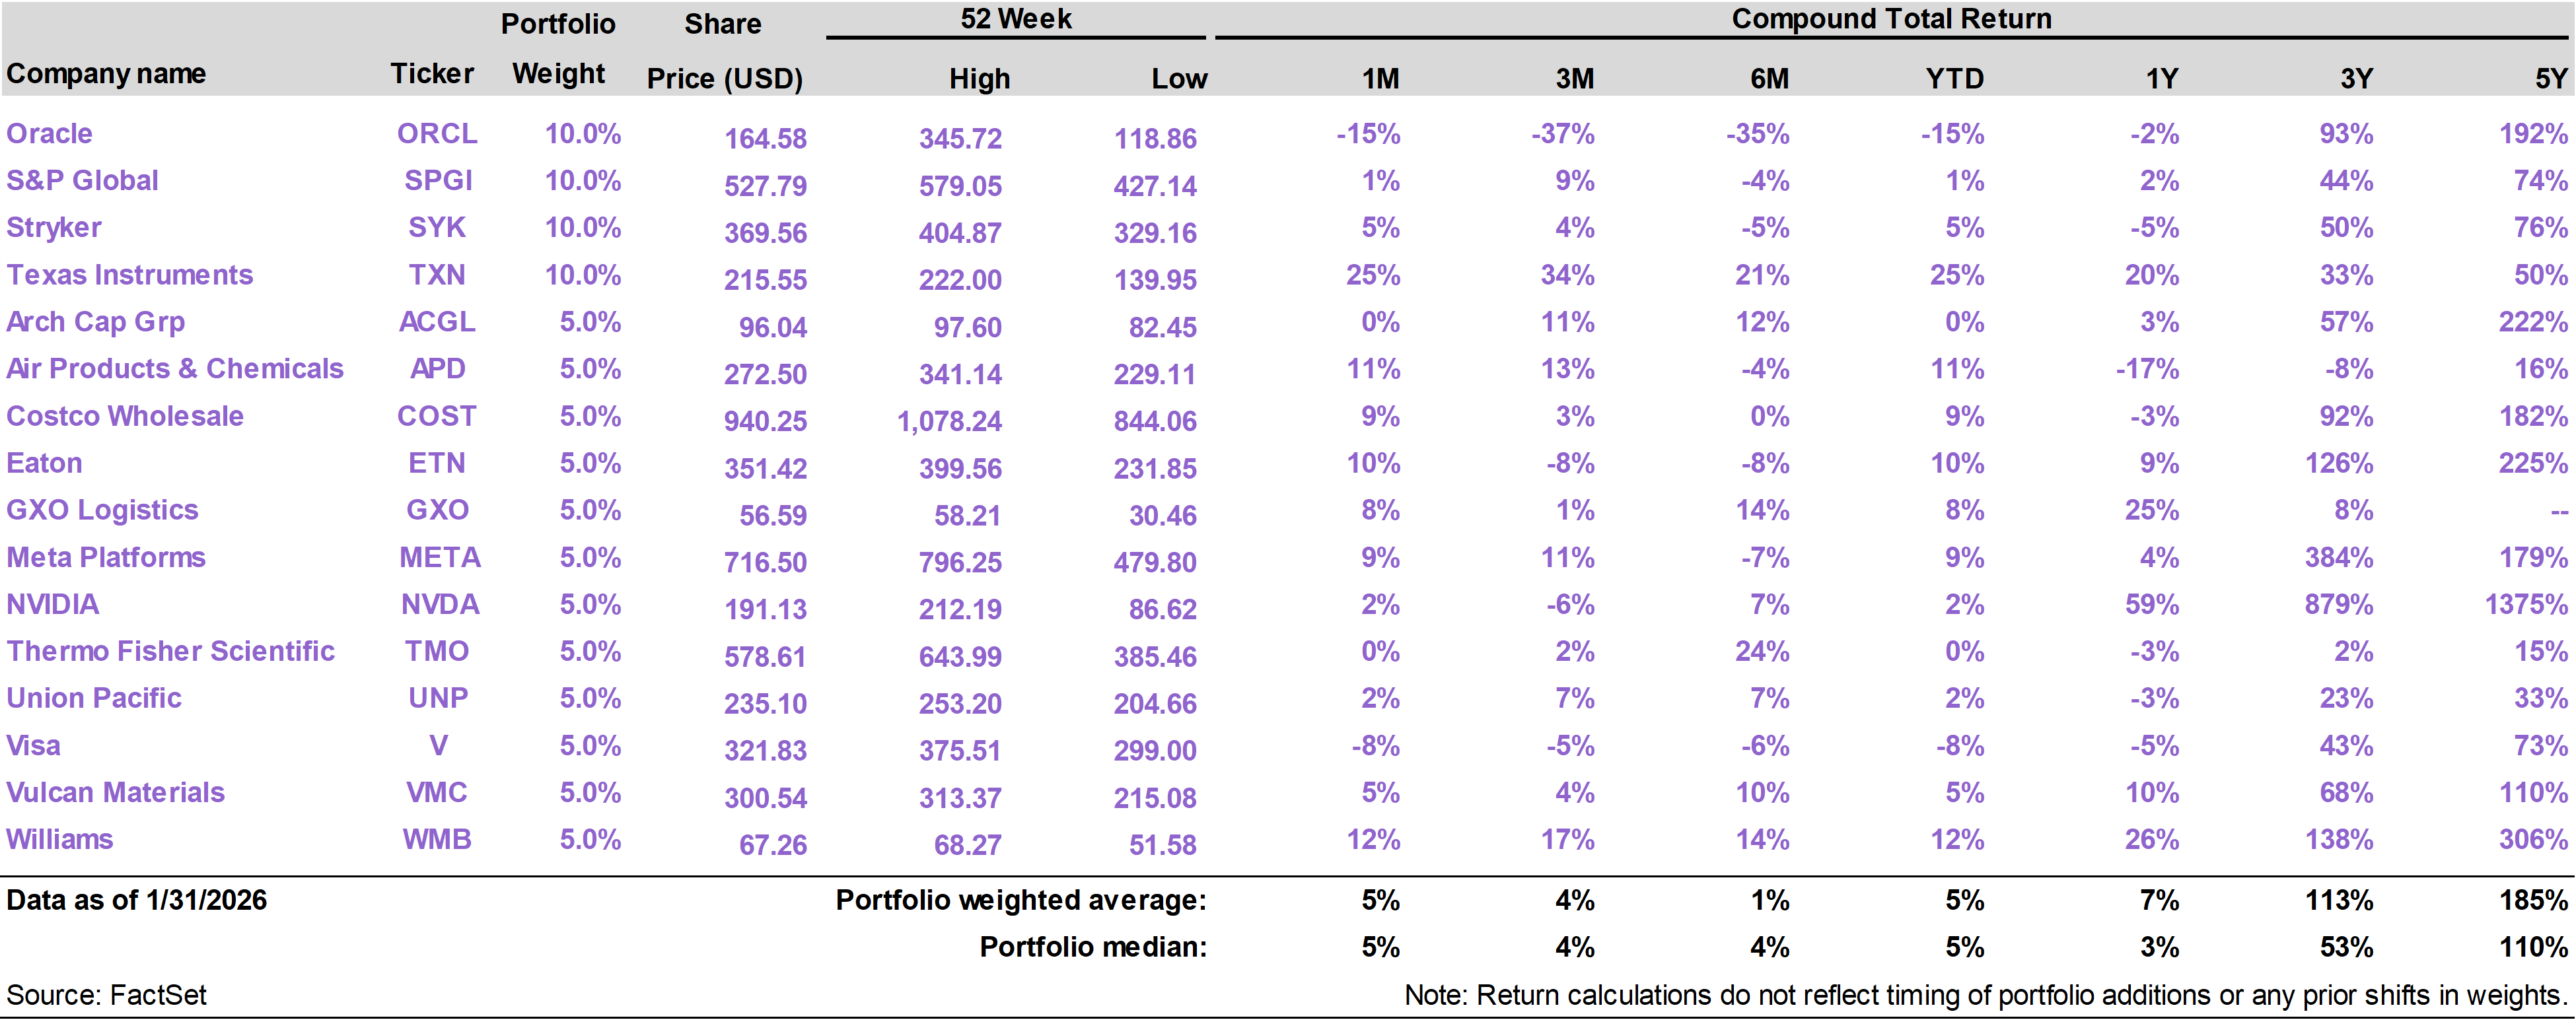
TXN shares performed quite well this month on the heels of a strong fourth quarter earnings report.


Results and guidance point to revenue growth running ahead of normal seasonality, supported by improving order trends, better bookings visibility, and rising activity across core analog and embedded chip markets. Management also struck a confident tone on margins, with improved factory utilization and mix driving upside.


Data center exposure is now emerging as a meaningful incremental growth driver, while the industrial and automotive segments still have room to recover toward (and potentially above) prior peaks.


Capital intensity is beginning to roll over, setting up the long-awaited inflection in free cash flow. Historically, the combination of above-trend growth and accelerating free cash flow has been a powerful catalyst for TXN shares.


We have been bullish on TXN because of falling capital expenditure (as multi-year capacity expansions wind down) and long-term structural exposure to AI-driven demand via data centers, robotics, automation, and autonomous vehicles.


TXN has been held back in recent quarters by cyclical pressures in the industrial segment, but the latest earnings report suggests this is diminishing as a headwind.


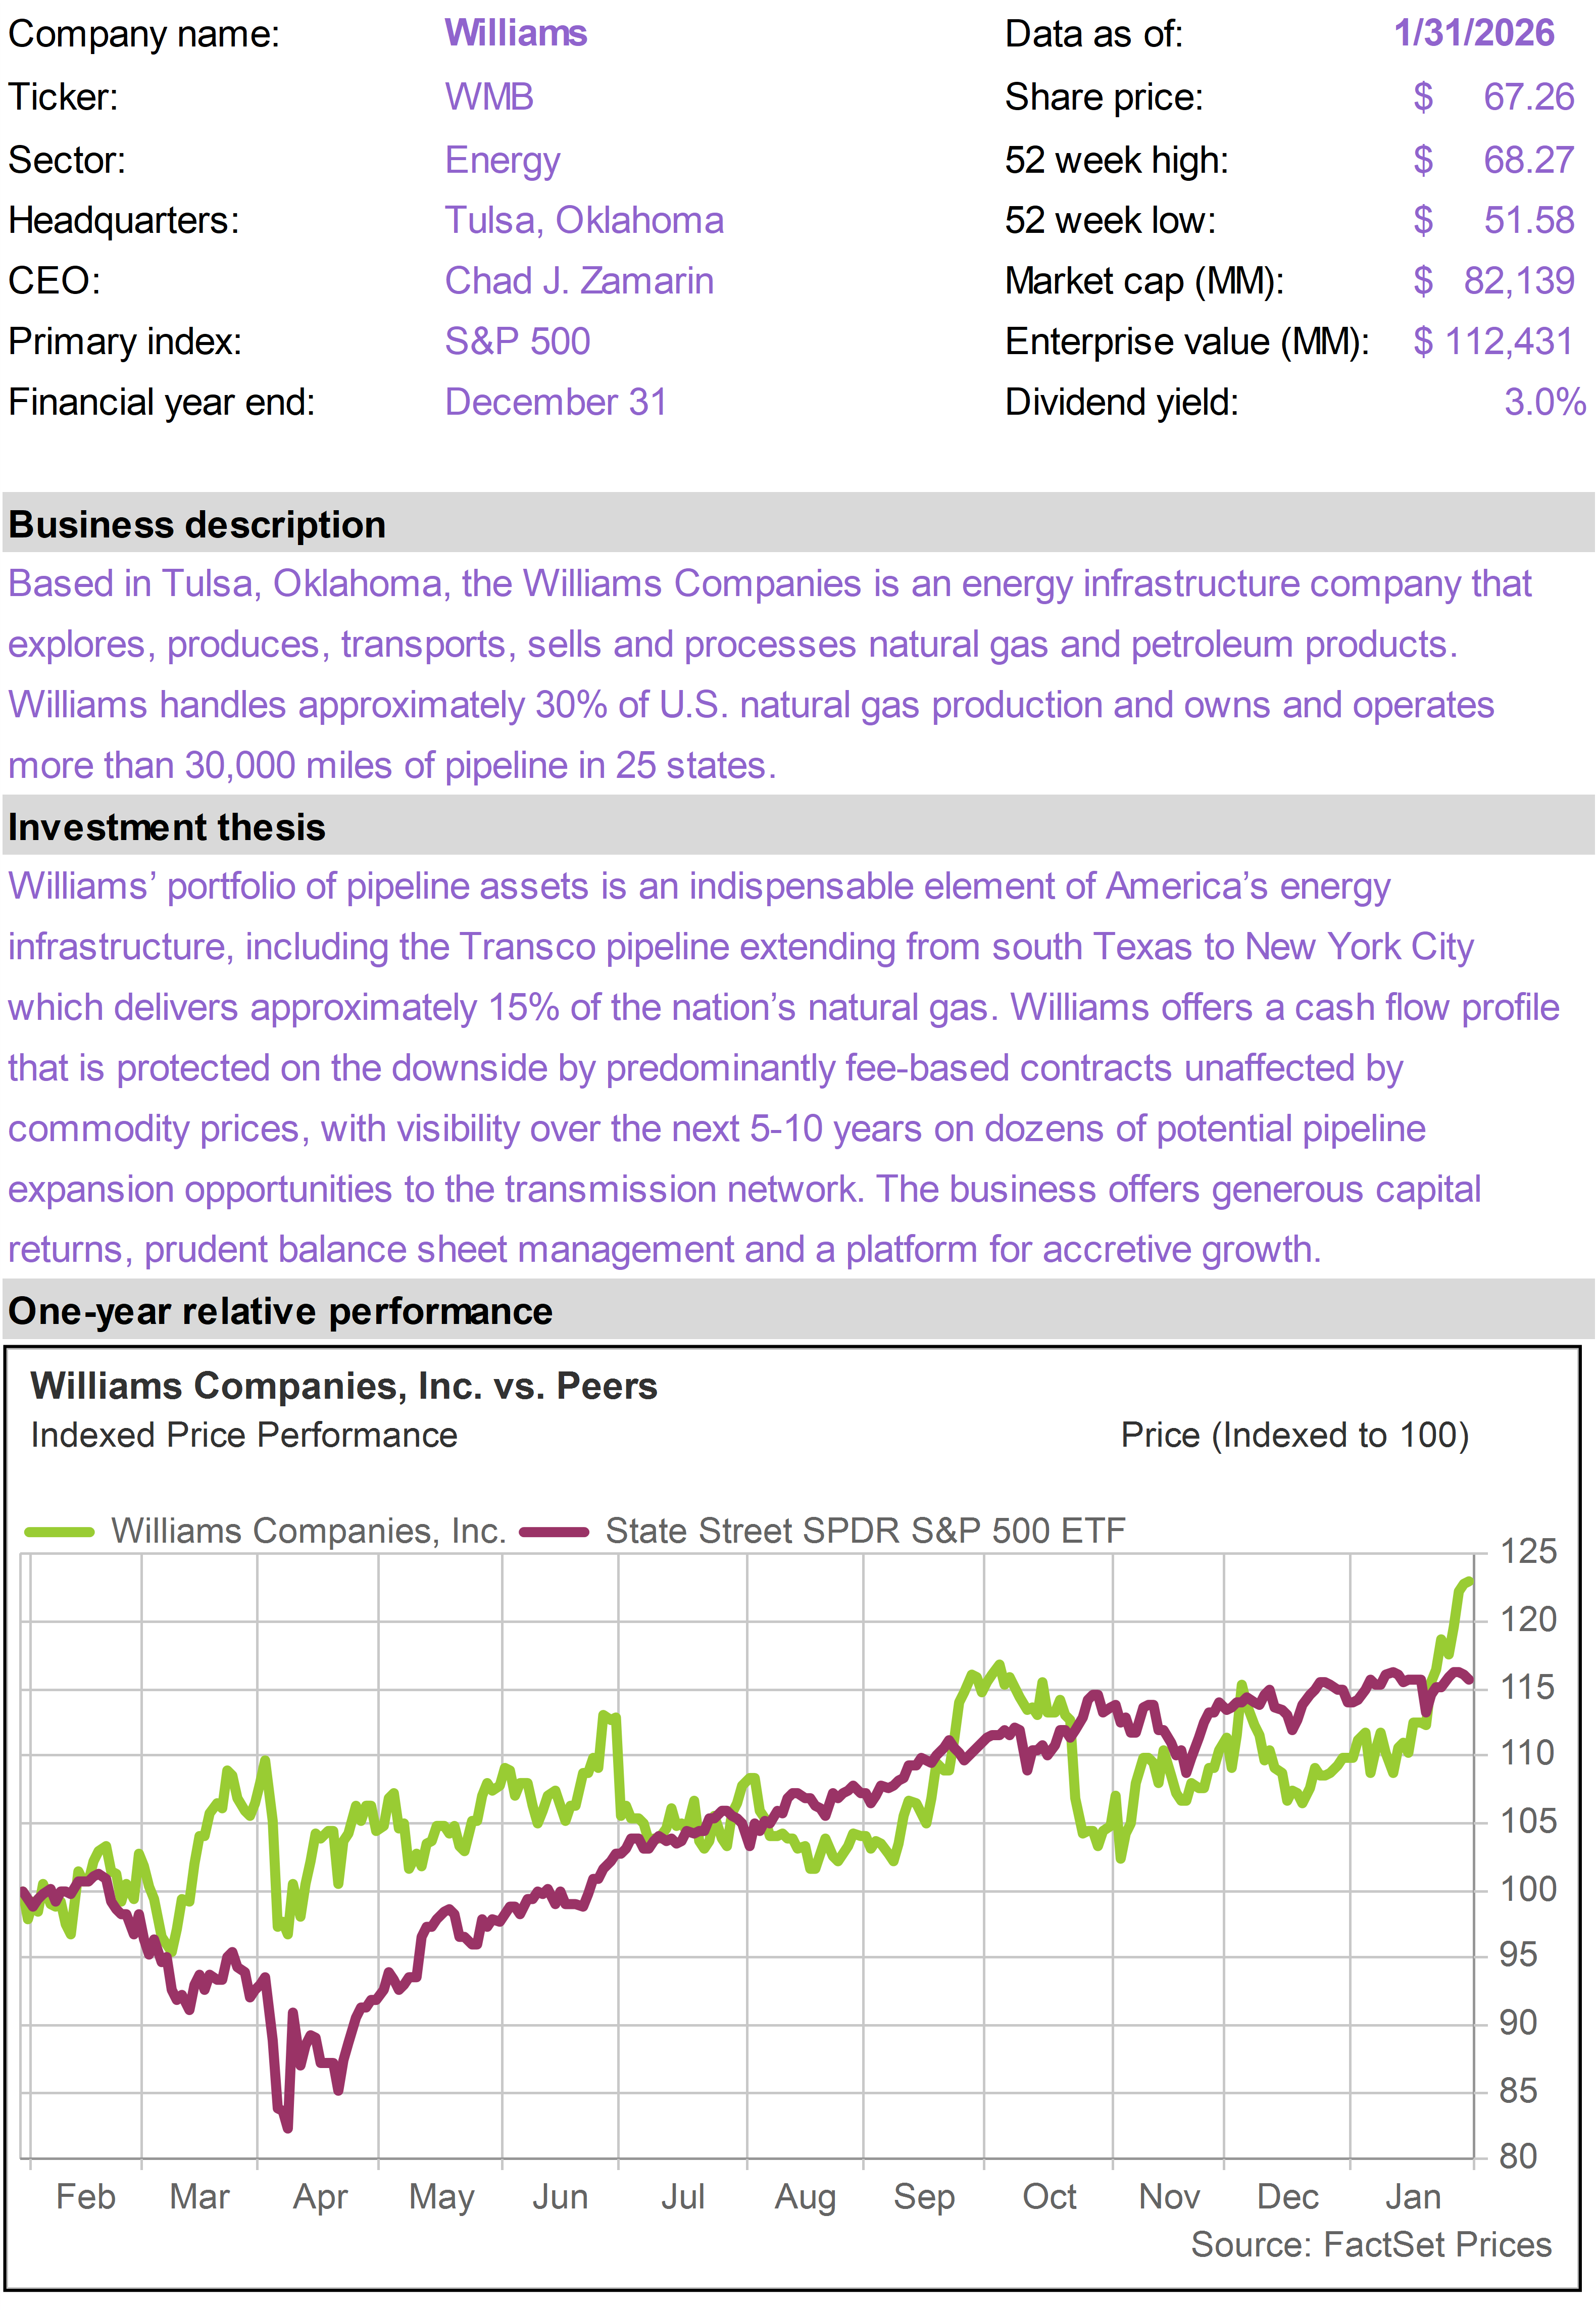
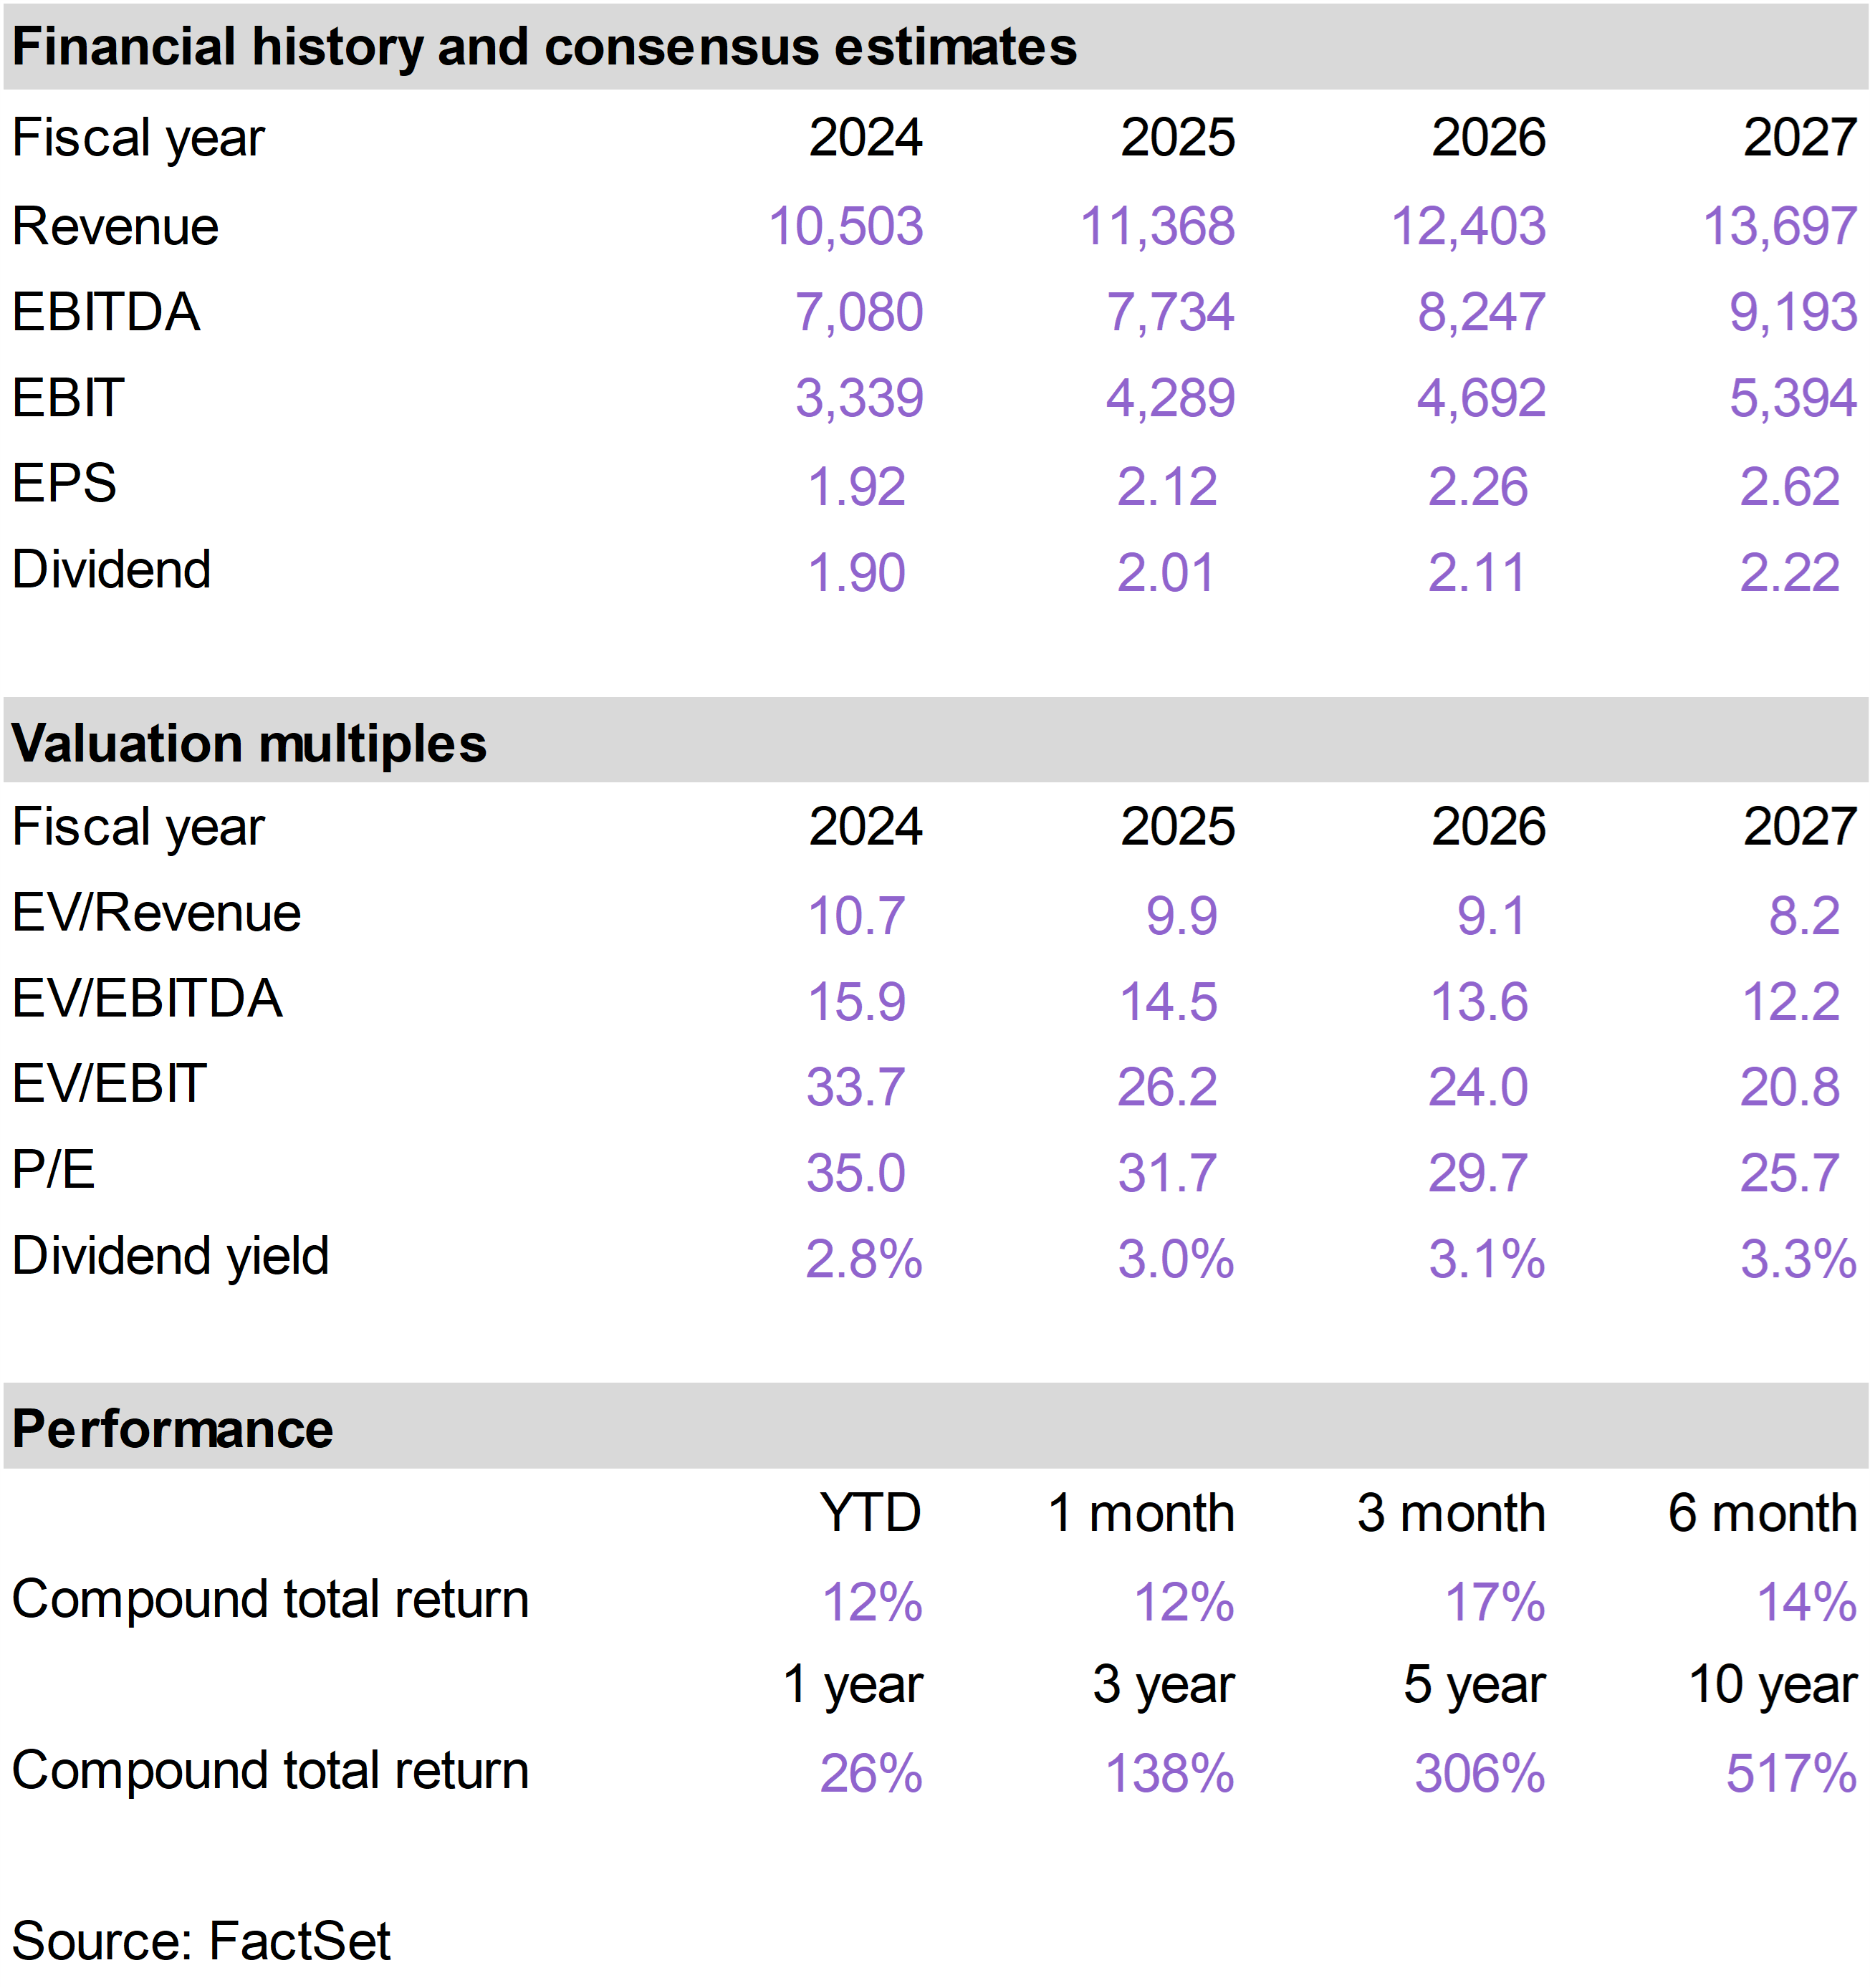
WMB performed well in January as investors continue to appreciate how its growth story is evolving beyond traditional gas pipelines.


The market is increasingly focused on WMB’s expanding role in supplying natural gas-powered electricity to data centers and other large power users, an area seeing rapid and durable demand growth. These projects are typically long-term and contract-based, giving WMB visible cash flows rather than exposure to volatile commodity prices.


At the same time, the core pipeline network, especially along the East Coast, is benefiting from rising gas demand tied to electricity generation, LNG exports, and regional capacity constraints. Management has recently signaled confidence in sustaining faster cash flow growth over the coming years, which will likely be discussed at its annual Investor Day next week.


WMB announced a 5% increase in its dividend on January 27. The company has paid a dividend every quarter since 1974.


APD gained momentum in January as investors focused on improving near-term fundamentals alongside the company’s longer-term reset.


A key driver was a favorable backdrop for U.S. refiners, where cheaper heavy crude from Venezuela has encouraged higher refinery utilization. Refineries are major customers for its hydrogen business, supporting higher volumes and better operating leverage in the Americas.


With a sharper focus on cost control, productivity gains, and disciplined capital allocation following recent project scrutiny, APD looks like a business with downside increasingly contained and multiple paths to improving cash flow.


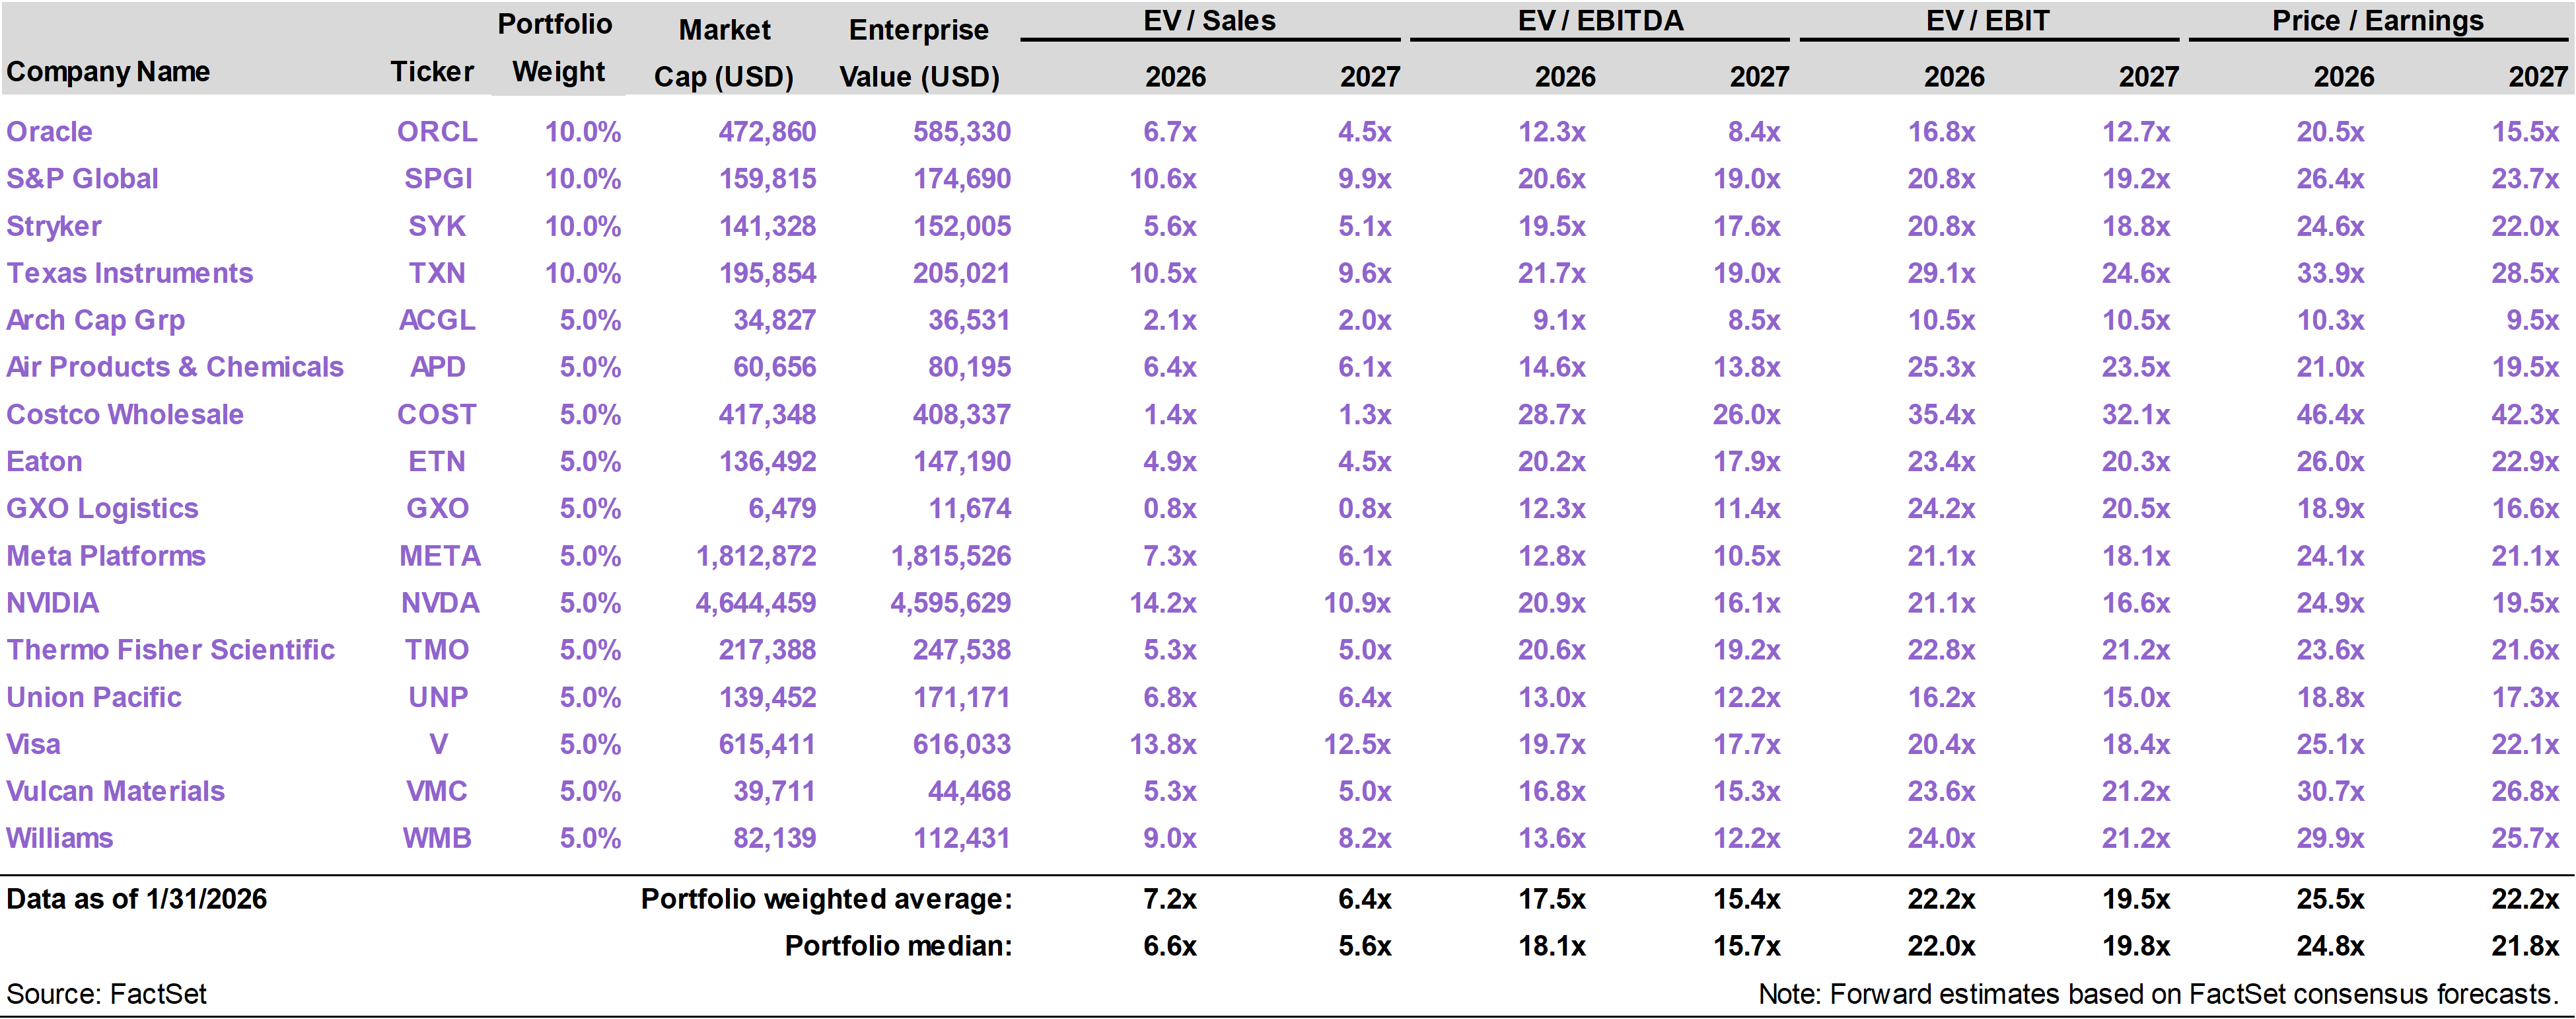
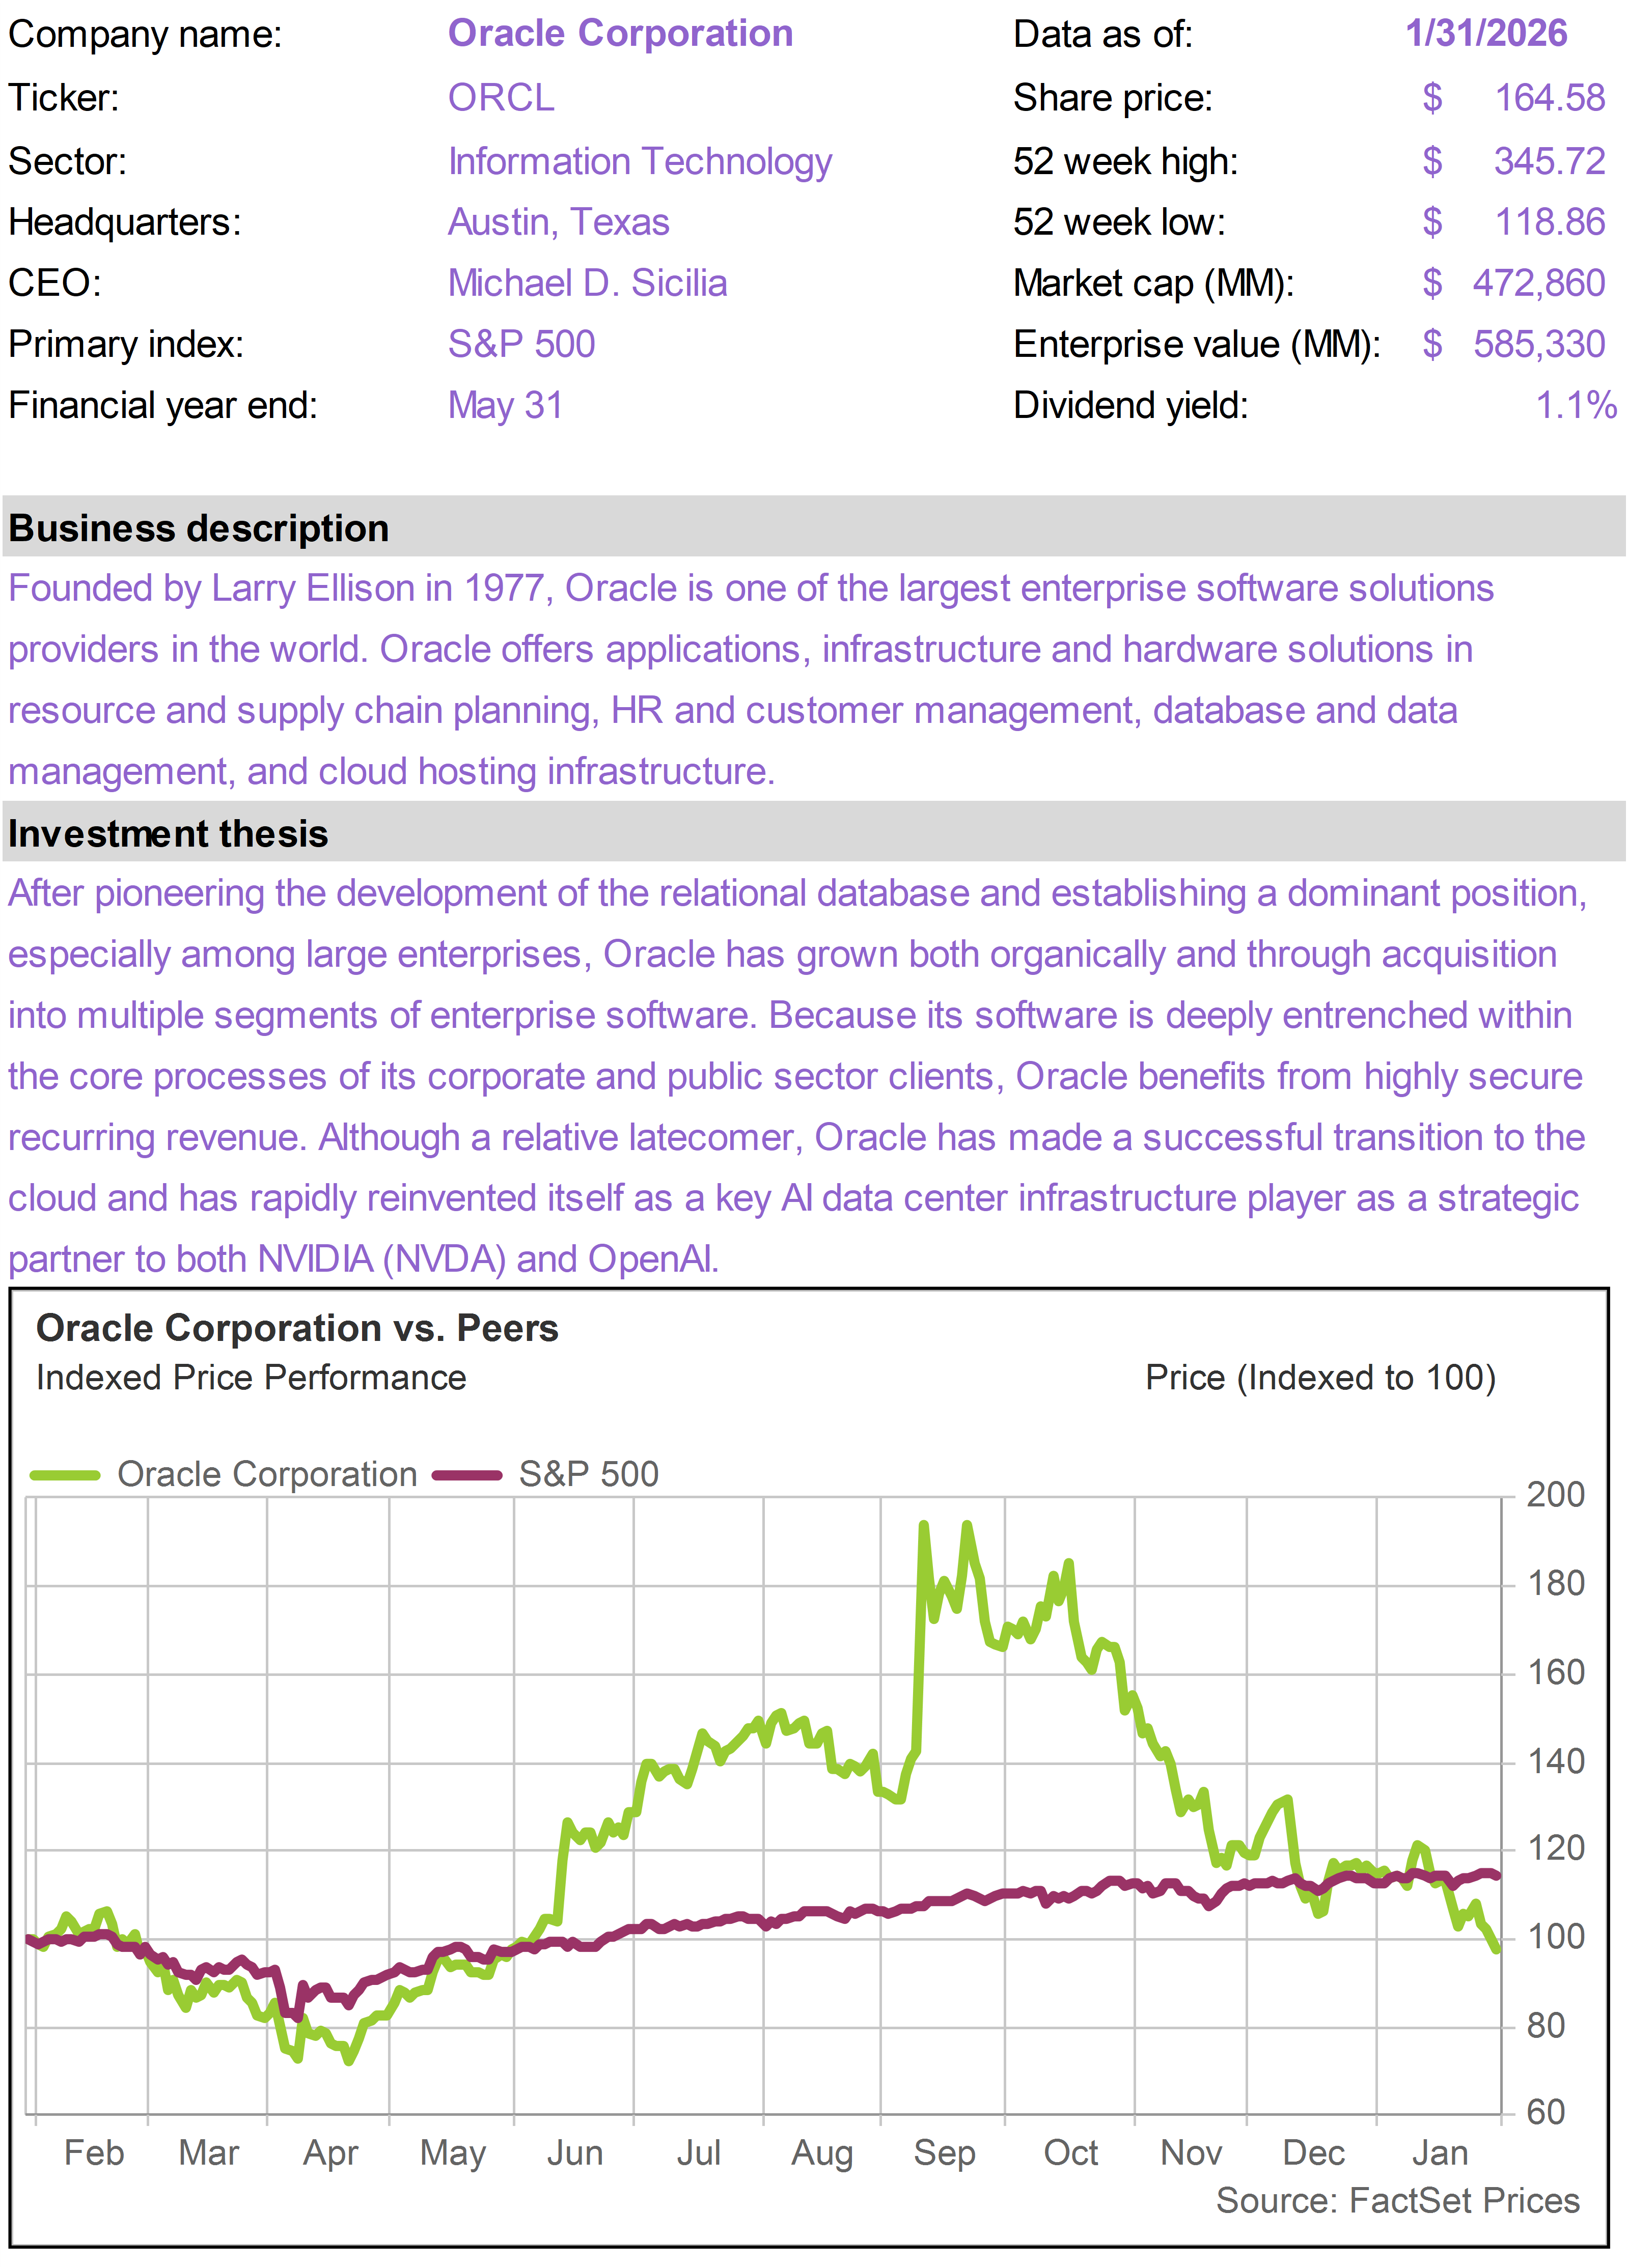
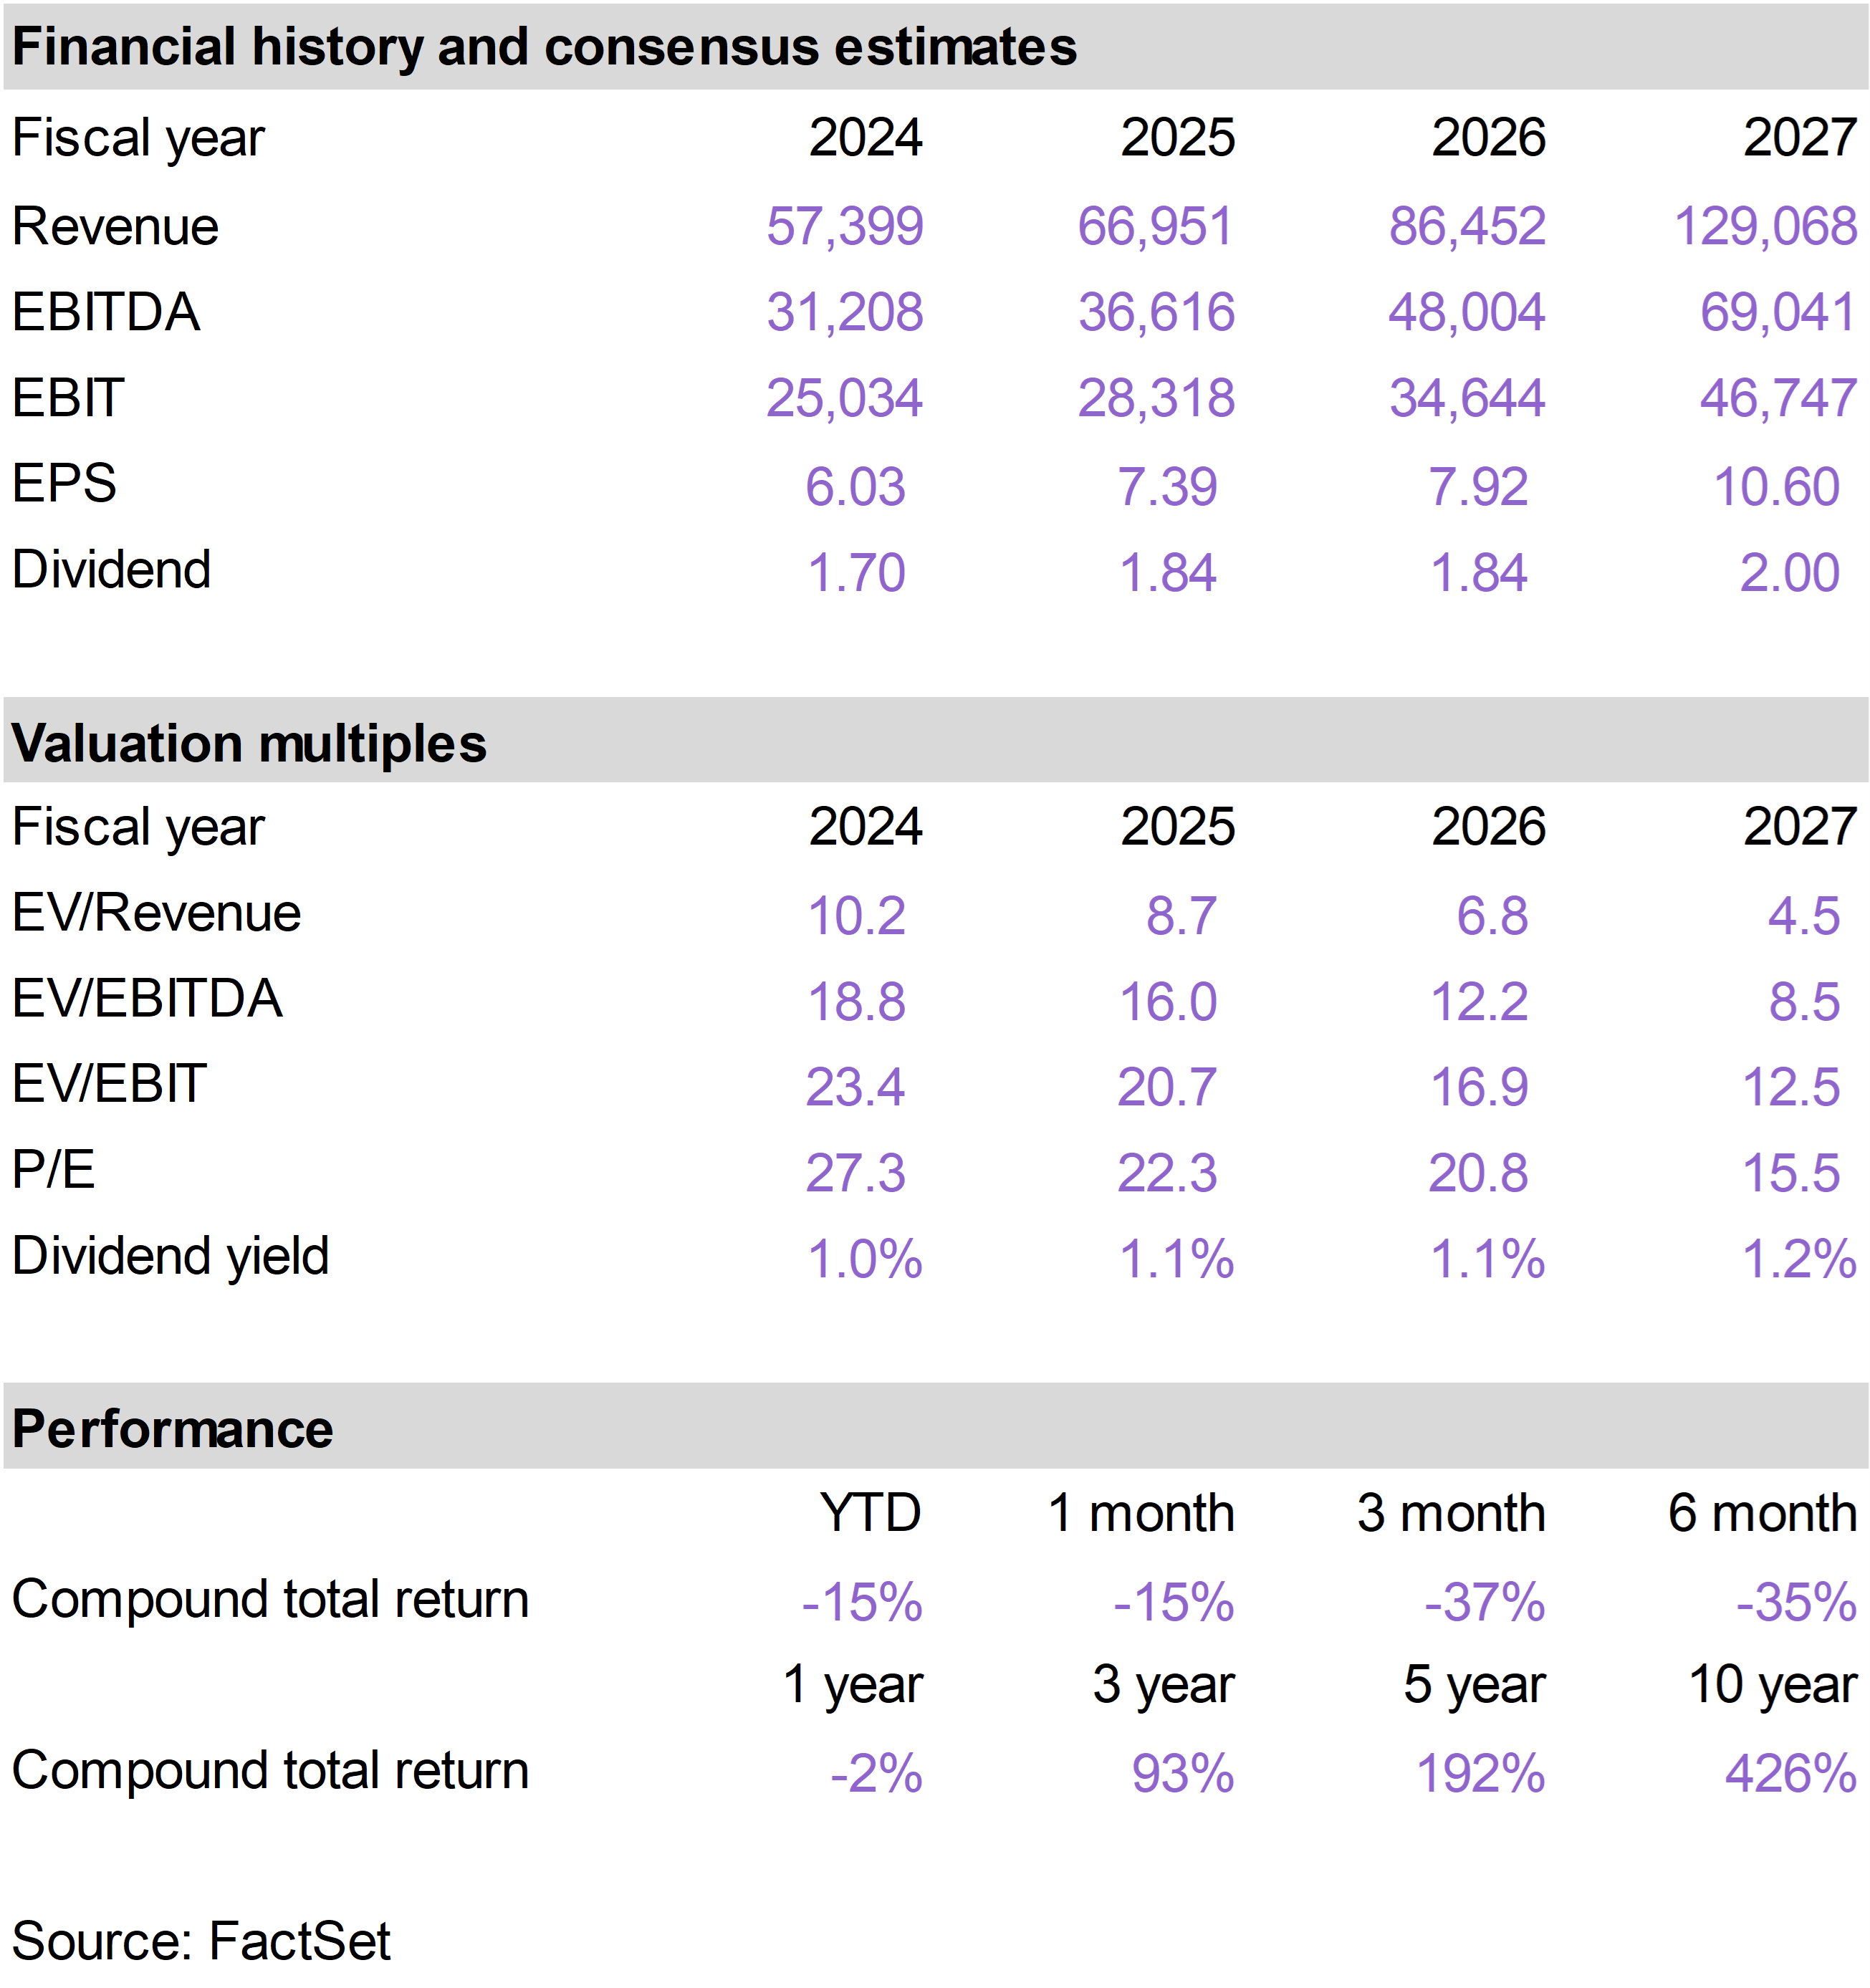
ORCL shares declined as investors have become increasingly skeptical of its capital intensive AI infrastructure strategy. Valuation here has once again become compelling, with the company now trading at less than 11x the fiscal 2028 consensus earnings forecast.


The market is arguably mispricing both of ORCL’s major businesses.


When broken apart, the company’s core applications and database segment warrants a much higher valuation given its durable, low-growth but very high-margin profile. Separately, the cloud infrastructure business is growing rapidly and is being valued at a steep discount to comparable cloud and AI-infrastructure peers, despite strong revenue growth and improving scale economics.


Much of the current expense and debt burden is tied to building out cloud capacity, which temporarily obscures underlying profitability. As cloud growth accelerates and utilization rises, margins and earnings power should improve meaningfully.


Viewed through either lens, the combined valuation does not reflect the long-term earnings and cash-flow potential embedded in the business.


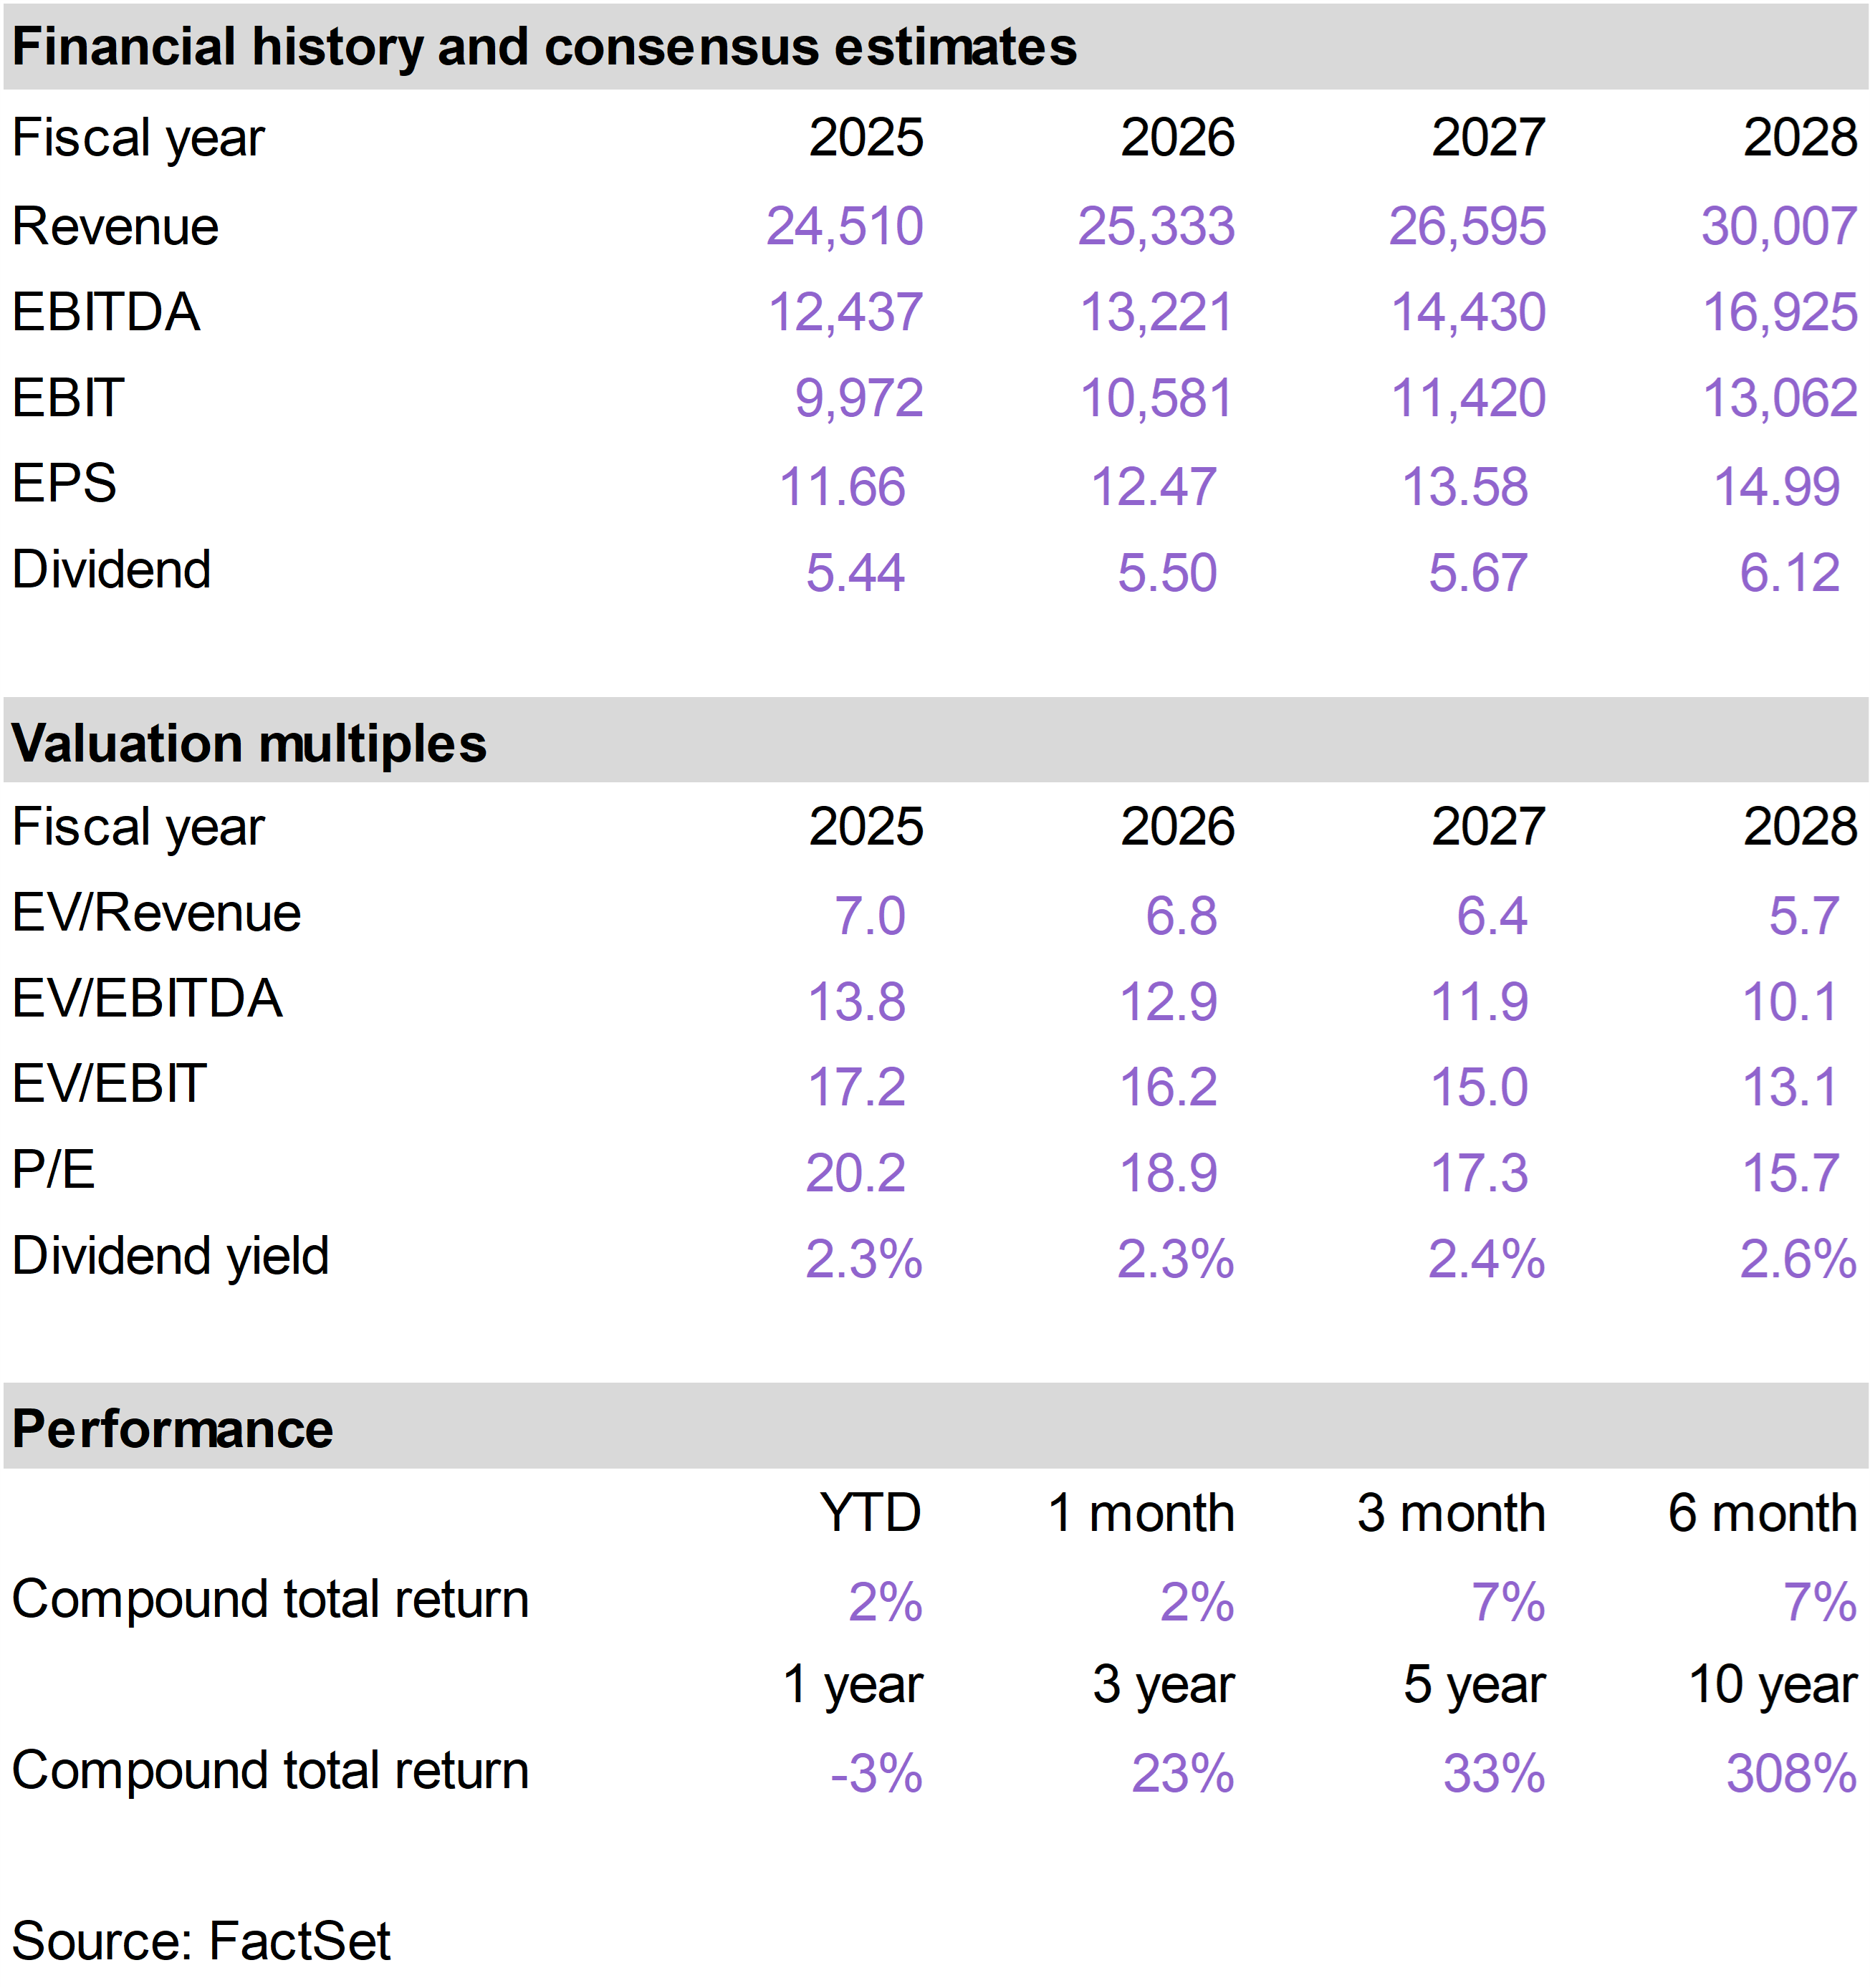
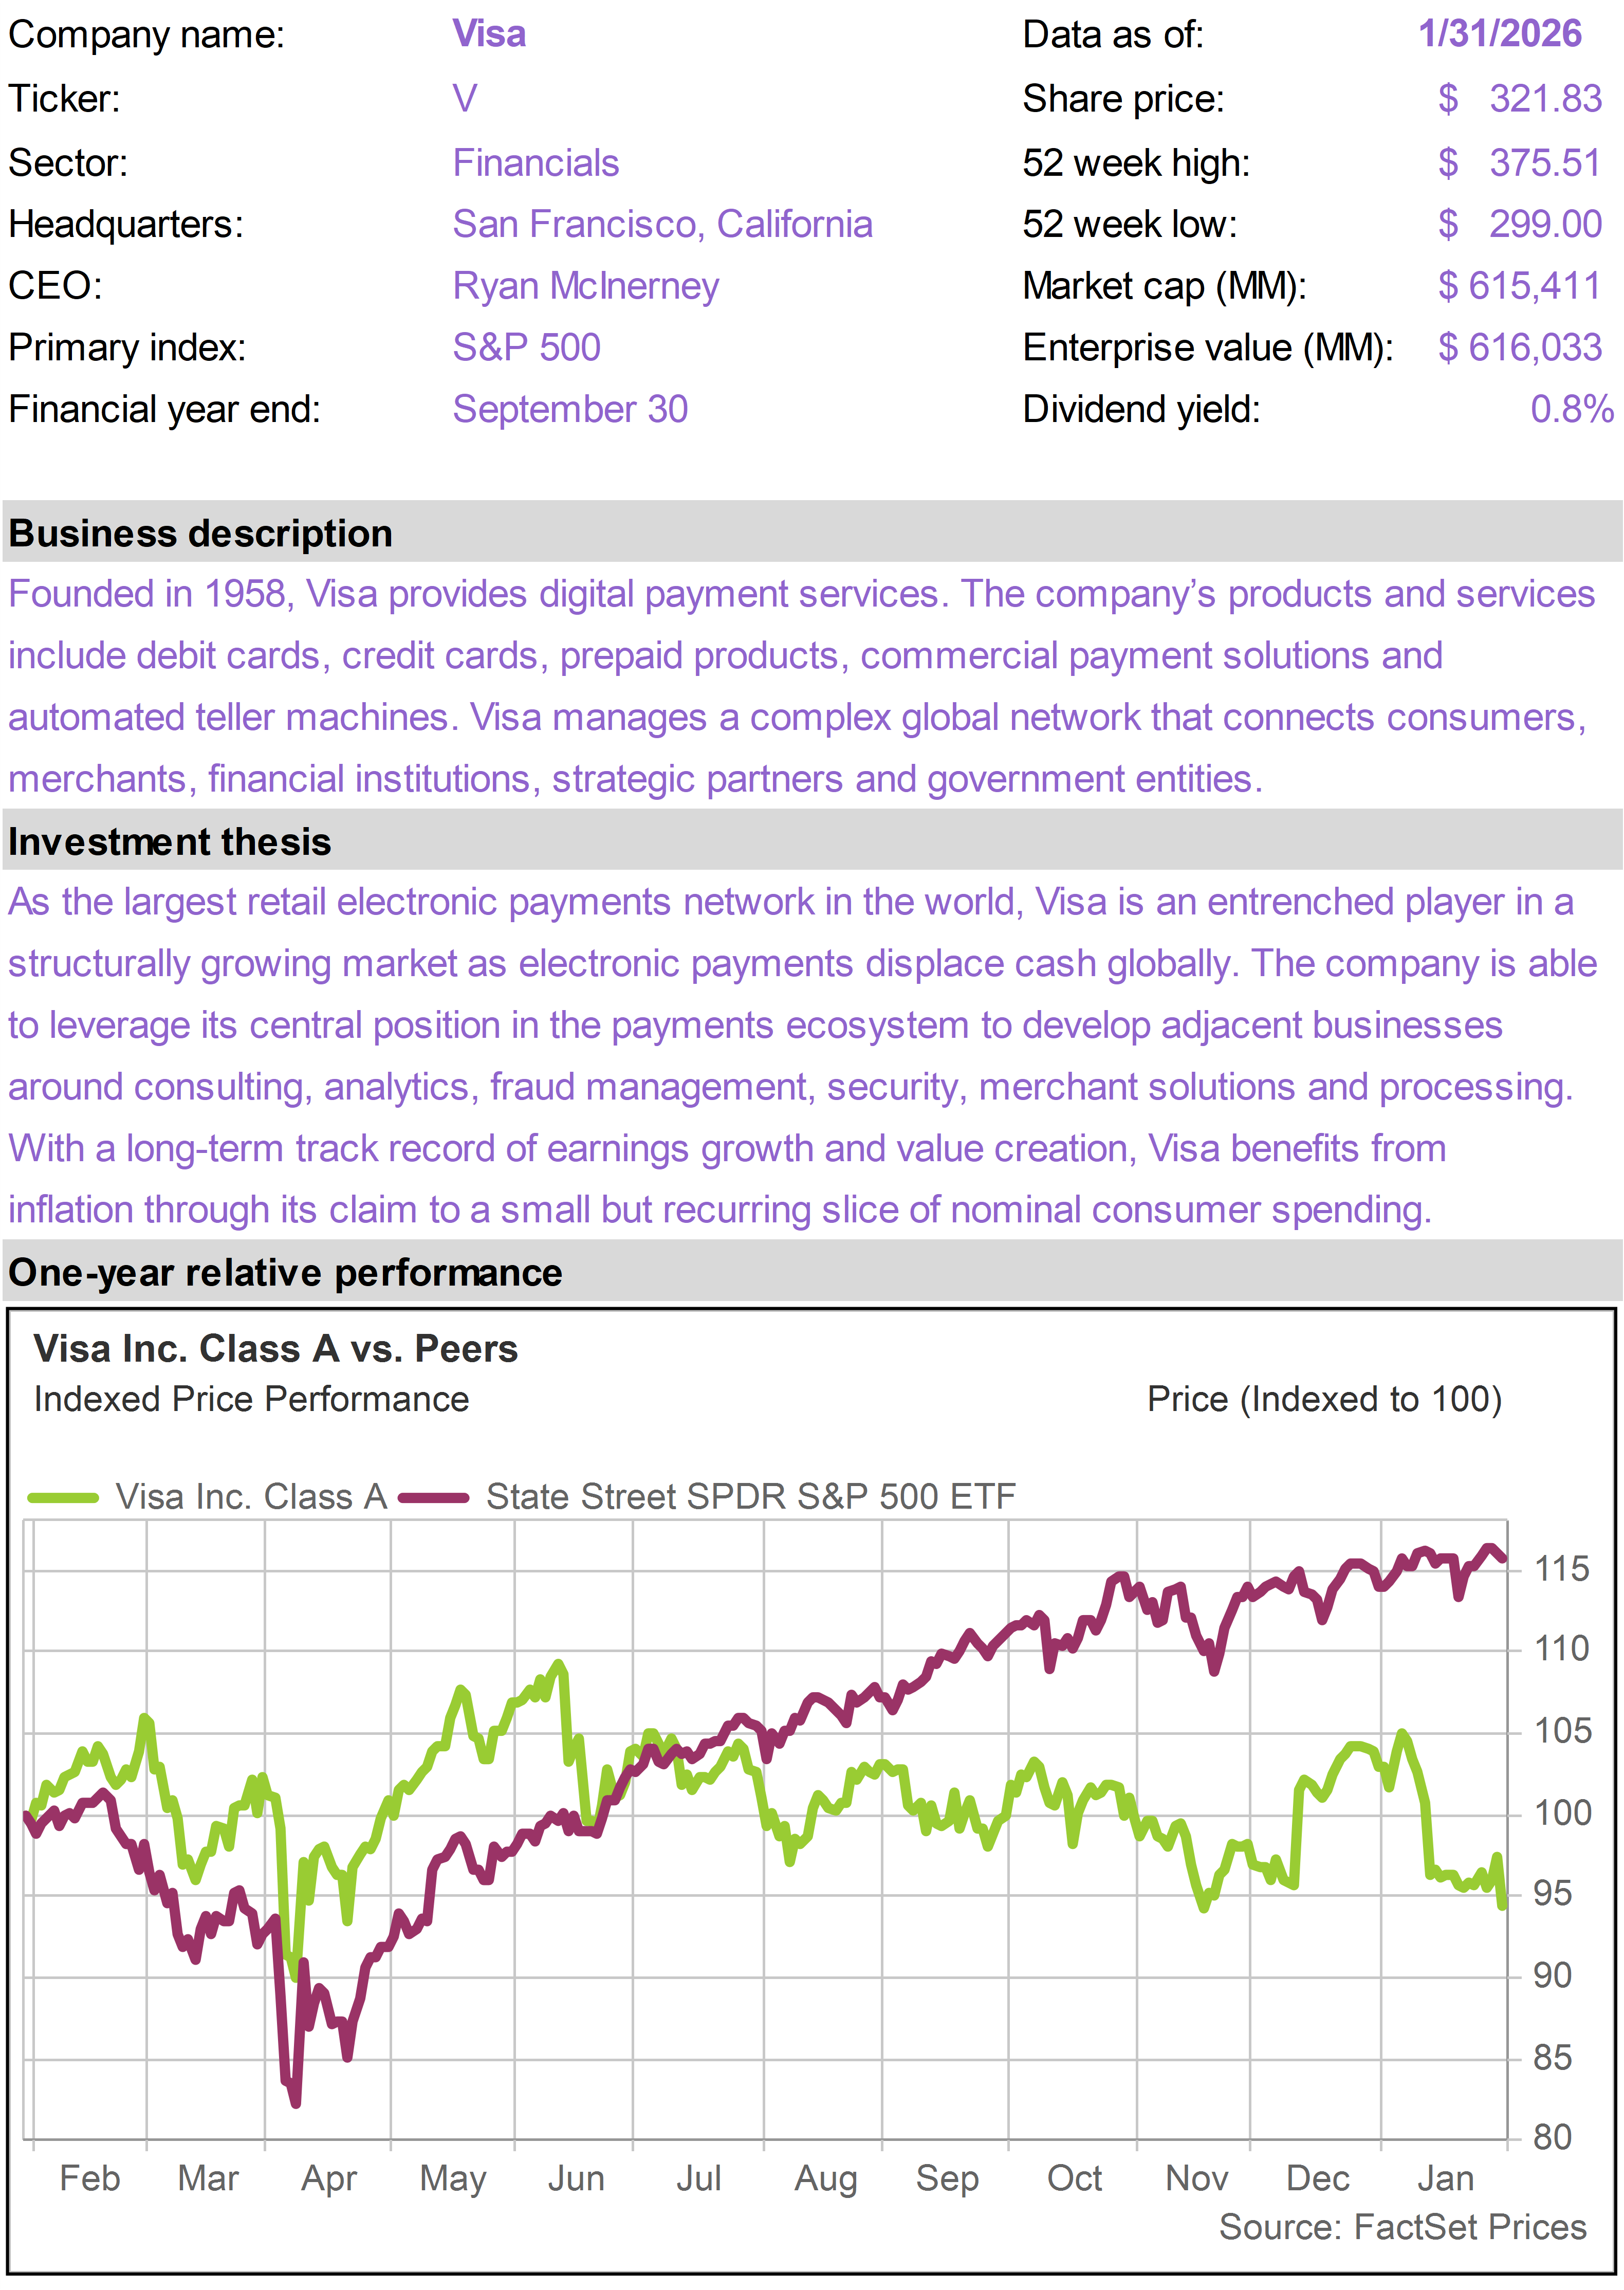
Shares of V were negatively affected by Trump’s proposed plan to cap credit card interest, which could have a marginally negative impact on transaction volumes if implemented.


V also reported earnings at the end of the month. Consumer spending has proven resilient, cross-border volumes continue to grow, and higher value services such as value-added services and commercial payments are expanding rapidly.


Management reaffirmed its full year outlook. With strong volume growth, powerful network effects, and multiple secular growth drivers layered on top of a high-margin base business, V’s long-term earnings power and cash flow profile remain very attractive, even after a choppy start to the year.


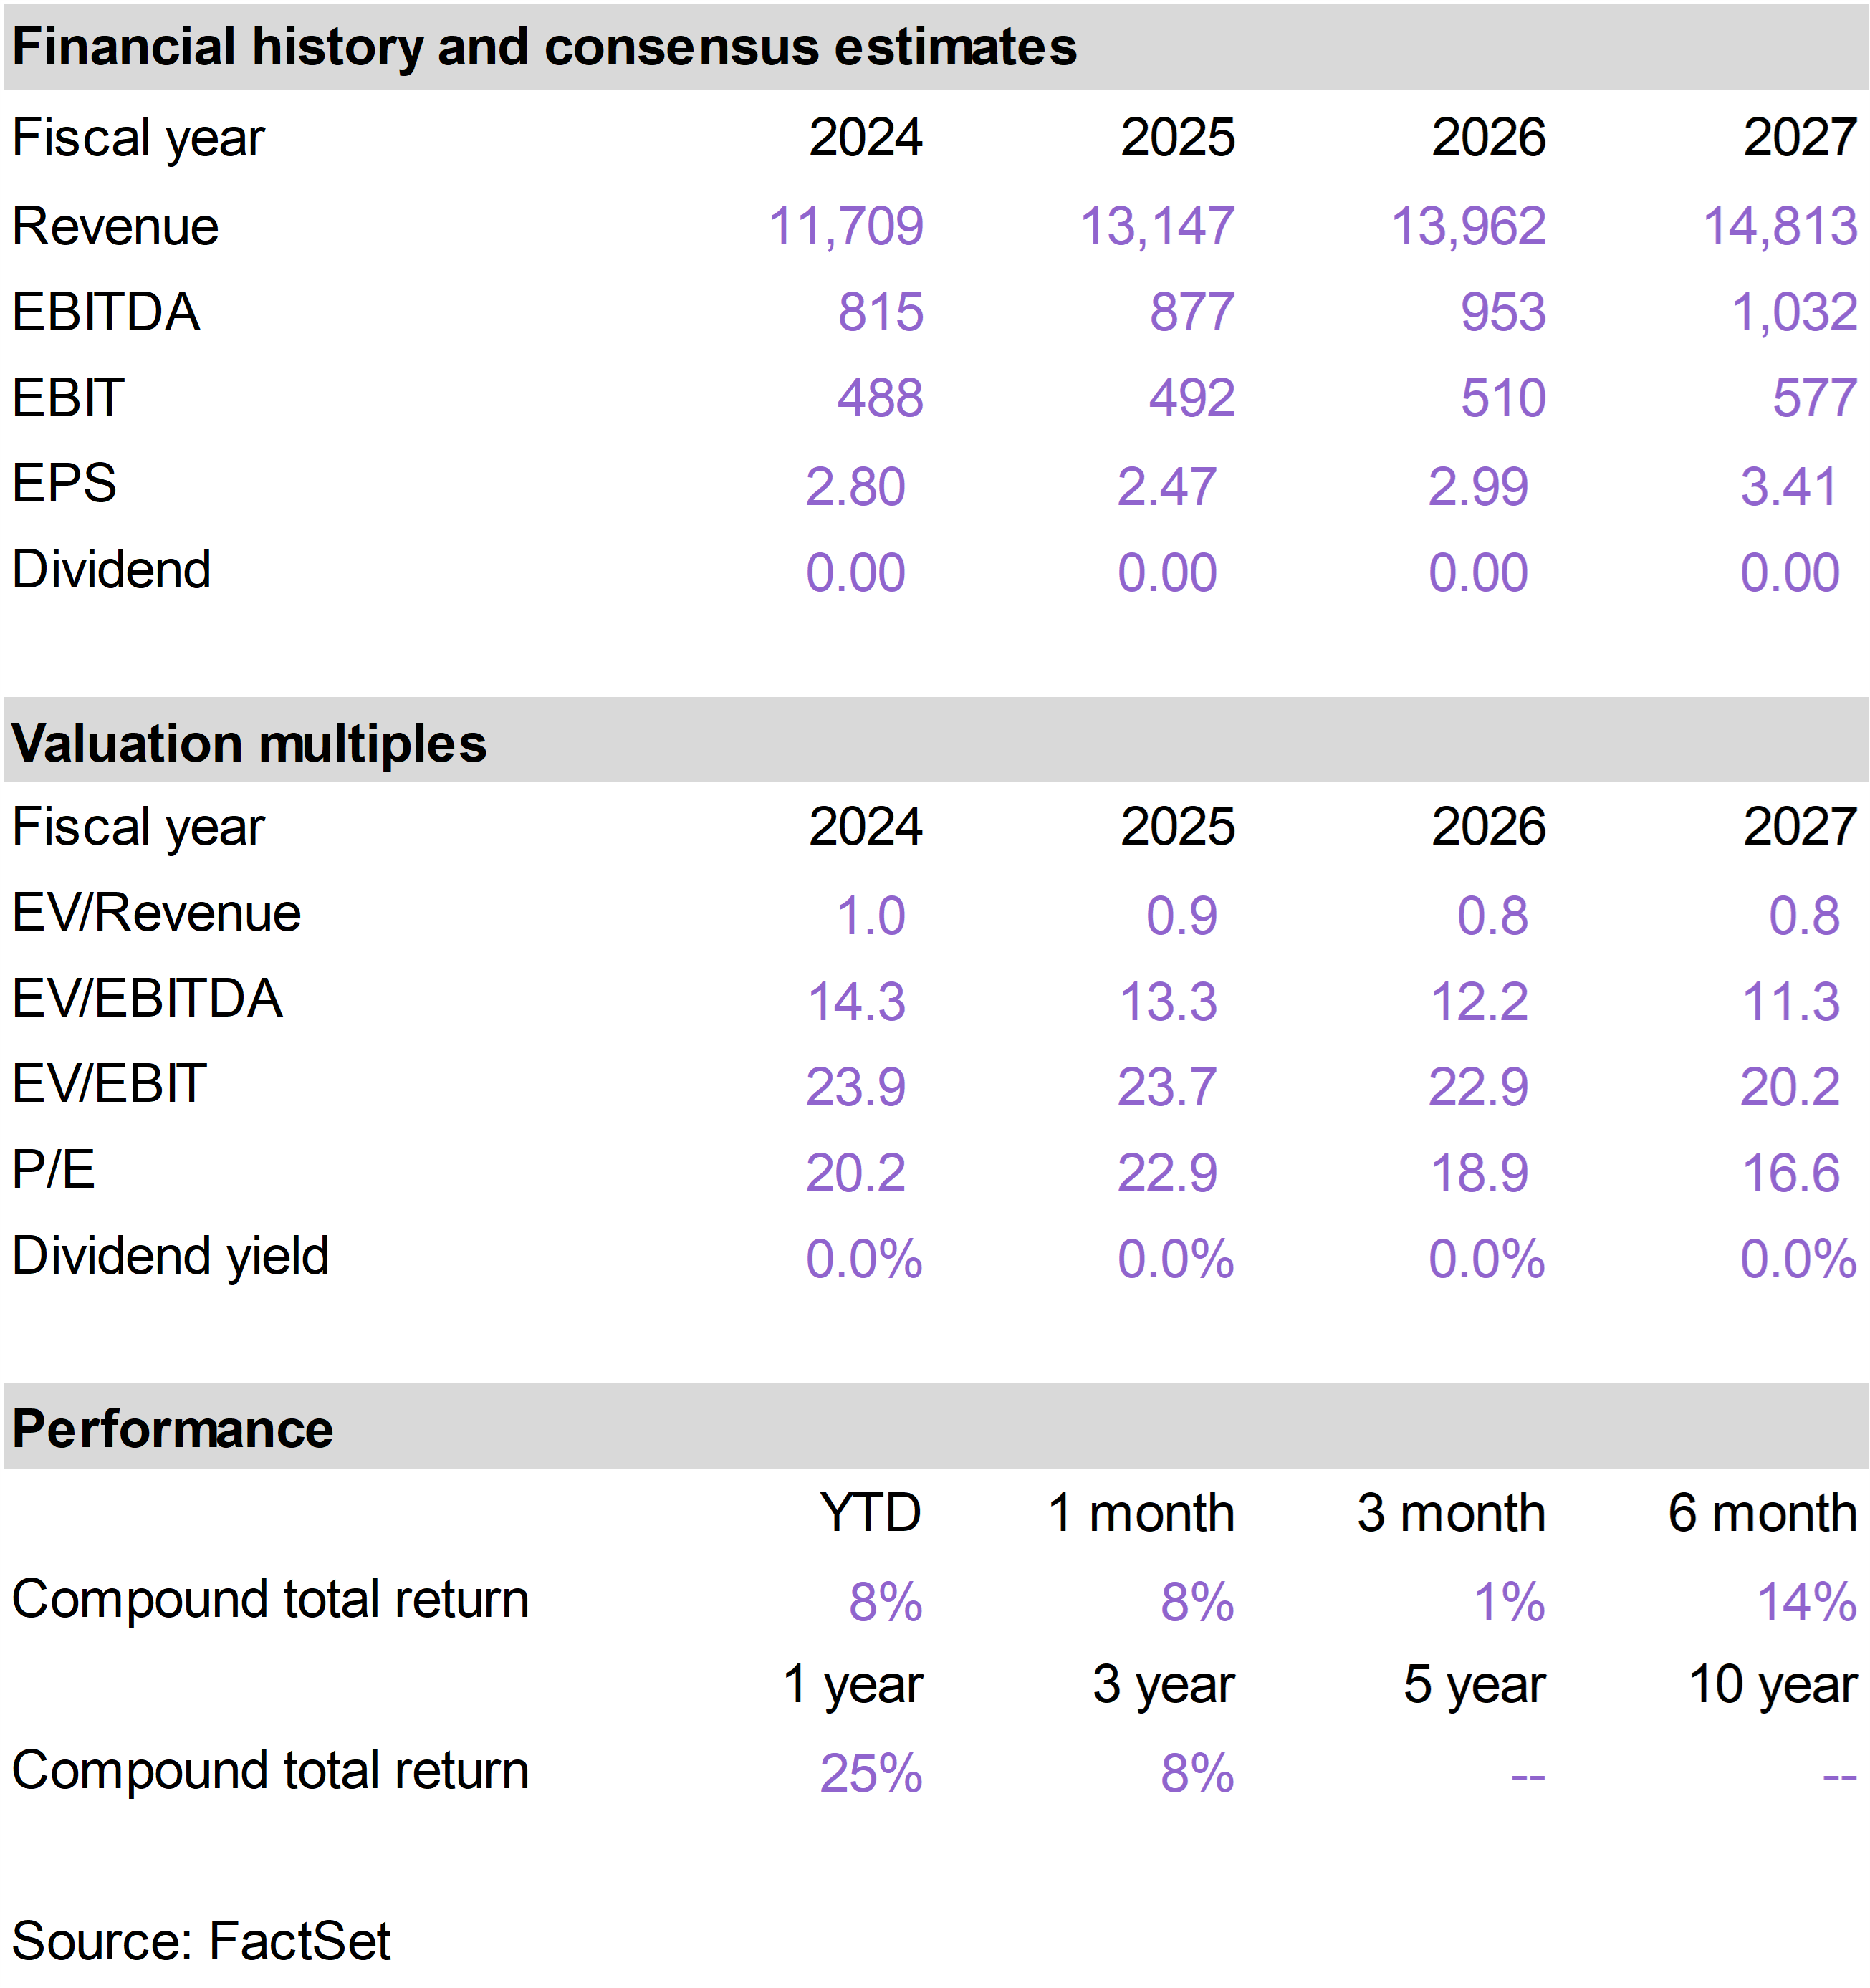
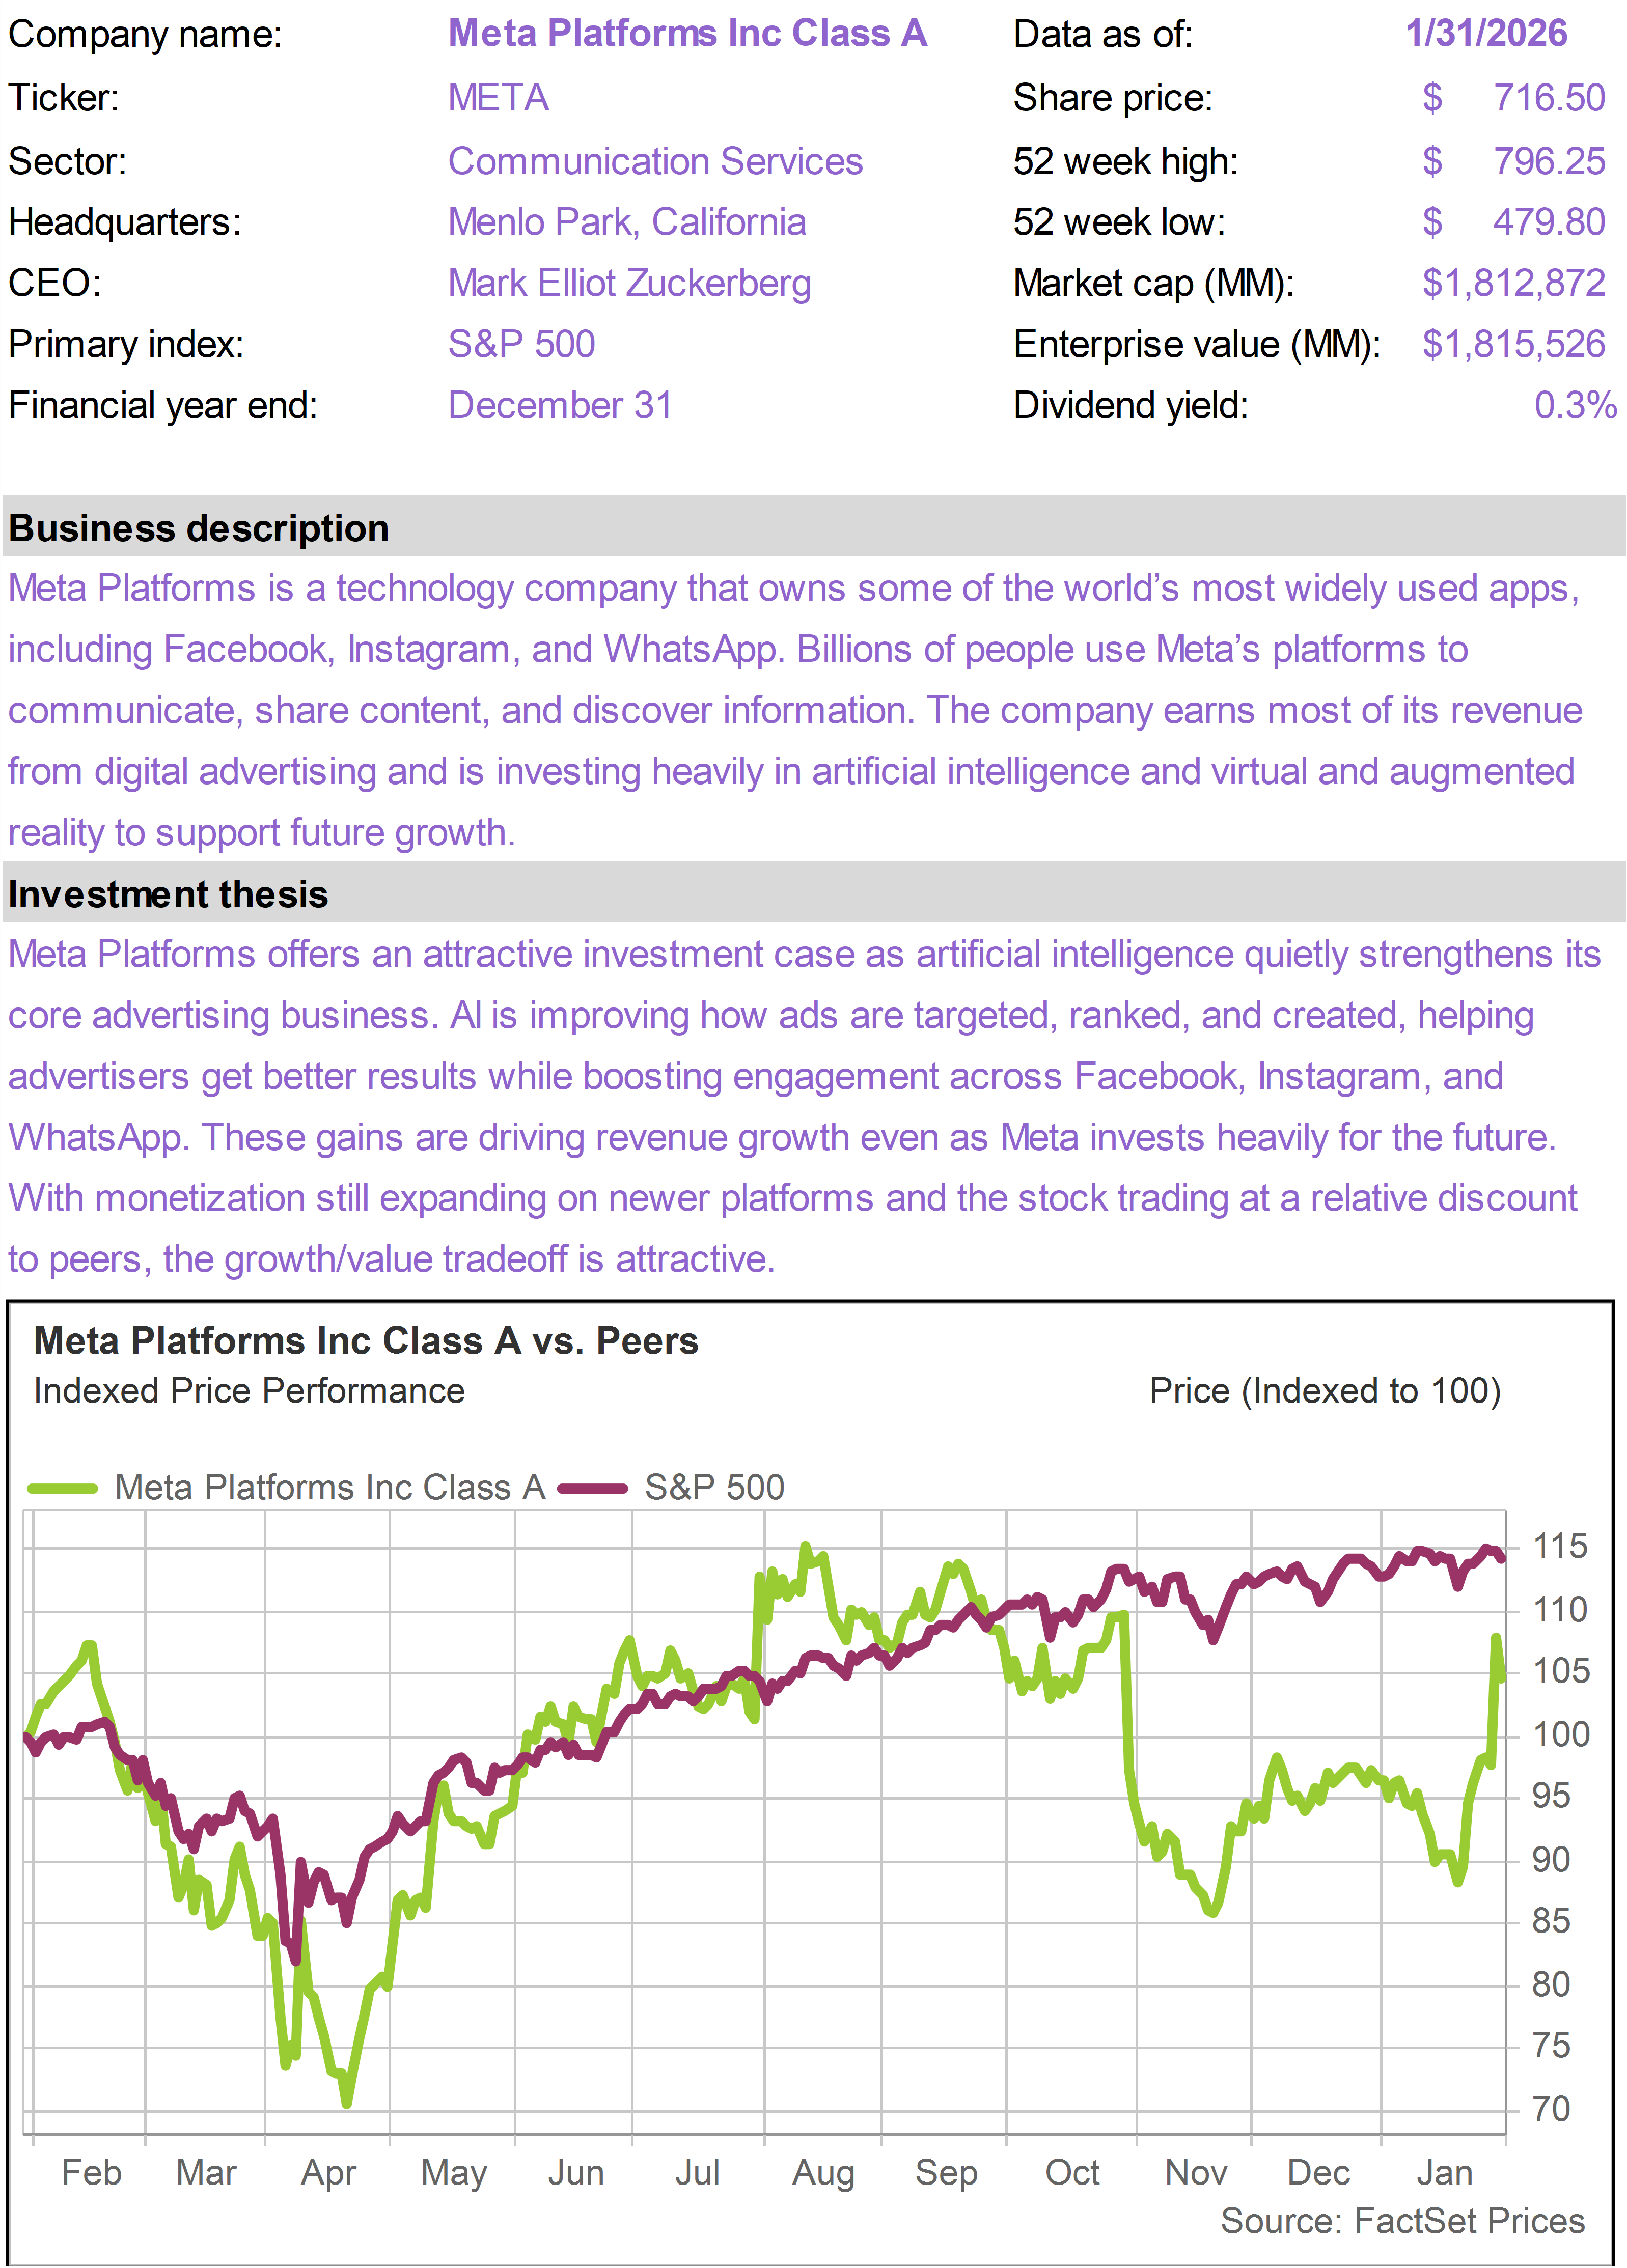
As noted in our portfolio update on January 15, Meta Platforms (META) replaced Roper Technologies (ROP) as a 5% position. Shares of META advanced approximately 15% since then through the end of the month. The upside in META followed impressive fourth quarter results in the final week of January, as discussed in the latest installment of The MAG7 MONITOR.

Key metrics

Valuation detail

Performance detail

Company snapshots

Oracle Corporation (ORCL)

S&P Global (SPGI)

Stryker (SYK)

Texas Instruments (TXN)

Arch Capital Group (ACGL)

Air Products & Chemicals (APD)

Costco Wholesale (COST)

Eaton (ETN)

GXO Logistics (GXO)

Meta Platforms (META)

NVIDIA (NVDA)

Thermo Fisher Scientific (TMO)

Union Pacific (UNP)

Visa (V)

Vulcan Materials (VMC)

Williams Companies (WMB)

The 76research American Resilience Model Portfolio is designed to provide exposure to growth businesses that operate with competitive advantages in structurally attractive markets. The objective is to identify businesses that can survive and thrive across different macroeconomic environments and whatever geopolitical crises may unfold. The holdings are intended as long-term investments to drive portfolio compounding with minimal need to realize taxable gains. Emphasis is placed on critical markers of business quality such as barriers to entry, physical scarcity of assets, balance sheet strength, effective capital allocation and durable long-term growth drivers. These assessments are paired with careful consideration of valuation and risk.    

FOR SUBSCRIBER USE ONLY. DO NOT FORWARD OR SHARE.